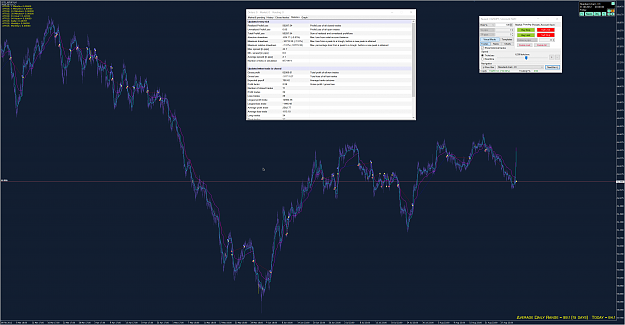
{quote} Yep, but some of them are over 1 month old.... You know as ancient saying goes: {image} You gotta catch them all, these trends.
Ignored
Mate with Instant KARMA on all the time we are going to get anything that moves an inch. I am getting some eye bulging metrics at the moment. Whipsaws are eaten by the momentum and it is across all the instruments I have randomly selected so far. :-)
{quote} Mate with Instant KARMA on all the time we are going to get anything that moves an inch. I am getting some eye bulging metrics at the moment. Whipsaws are eaten by the momentum and it is across all the instruments I have randomly selected so far. :-) Kacccccchiiiiing.
Ignored
Dear C
As far as I am concerned, I was never fond of being continuously in the market, by reversing any given position.
Since you like the "Kacccchiiiig" sound, please test this combo as well.
Two TFs H1 and M30.
Apply KAMA indicators to both of them.
Entry when both TFs agree
Close position according to M30
30m testing but seen on 1h time frame. Less whipsaws, but with worse exits and entries.
Ignored
Worse entries = Yes, some of them but increased winning percentage
Worse exits = No, since we exit according to M30 as I mentioned in my previous post
I repeat that since I don't think it is wise to be 100% of the time in any market by just reversing your position, I proposed to open a position when both H1 and M30 are giving an entry signal (you filter out trades given by M30 but not confirmed by H1) and exit using M30 TF only.
To be even more clear let us suppose that we have in H1 a buy signal which lasts for ie three months. During those three months, M30 gives say three buy signals and two sell signals. We take the three buy signals only.
We always exit using M30 as proposed by you and Mr C
tk
PS I am curious to see how the results of your above test in NZDJPY would be if you traded it as above.
{quote} Worse entries = Yes, some of them but increased winning percentage Worse exits = No, since we exit according to M30 as I mentioned in my previous post I repeat that since I don't think it is wise to be 100% of the time in any market by just reversing your position, I proposed to open a position when both H1 and M30 are giving an entry signal (you filter out trades given by M30 but not confirmed by H1) and exit using M30 TF only. To be even more clear let us suppose that we have in H1 a buy signal which lasts for ie three months. During those...
Ignored
H1 test of same period is coming up.
Cut short your losses. Let your profits run on. David Ricardo (1772-1823)
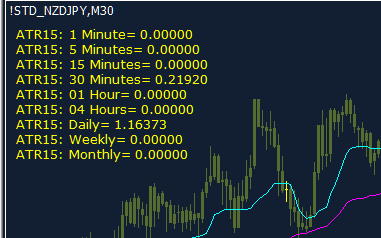
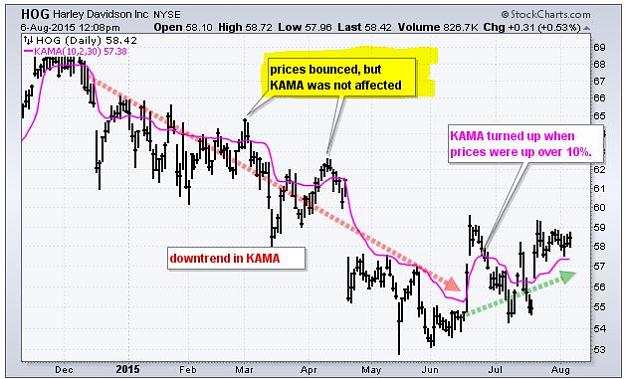
{quote} Great stuff. I start to backtest too If you want to have actual ATR value from the past, you can use attached indi. ATR daily values on NZD JPY changed from 110 pips to 55 pips in matter of 2 months. Open daily chart too and put it there. Must have enough days in the chart to calculate i.e. 15 days. Looks like this: {image} If attached doesn't work, you have to download it through Market tab in your MT4 - name ATR Values
Yep mate. Great thinking. Daily ATR is larger than what I am currently doing. I am eyeballing at the moment and placing my initial stop for position sizing only at the base of the candles of last short term support/resistance. It is approx 0.5 ATR or round abouts. We will be able to definitively test this when the EA is complete but until then it is rubbery.
{quote} Dear C As far as I am concerned, I was never fond of being continuously in the market, by reversing any given position. Since you like the "Kacccchiiiig" sound, please test this combo as well. Two TFs H1 and M30. Apply KAMA indicators to both of them. Entry when both TFs agree Close position according to M30 tk
Ignored
Hi T :-)
Sounds logical.
The intent for the first stage of the EA is to test continuous trading but there will be lots of variations we will build in relating to selective trading. It looks promising and perhaps there are many types of variants we can isolate that have their unique return distributions that together will smooth the portfolio curve.
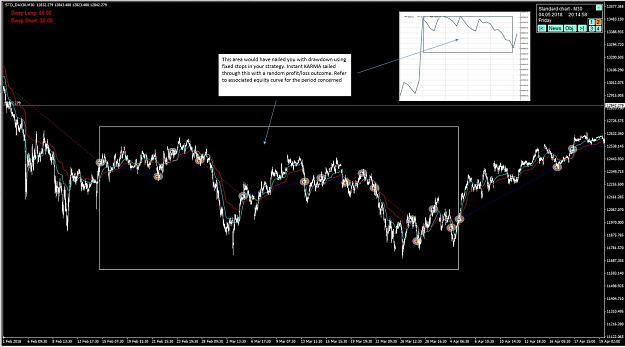
Our first efforts need to be placed on breaking the strategy. Finding the weak spots and in what conditions they occurred. Sideways ranging whipsaws are not as devastating as other forms of crossover such as the moving average cross as the indicator only moves on a signal as opposed to what it defines as noise. There is a bit going on with this indicator and it has a lookback to assist in discriminating between what it terms signal versus noise yet also make it quite adaptive.
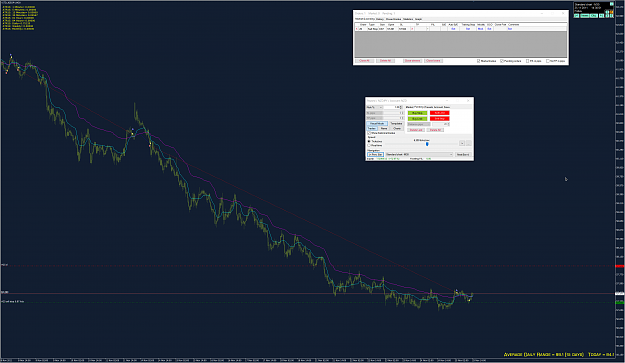
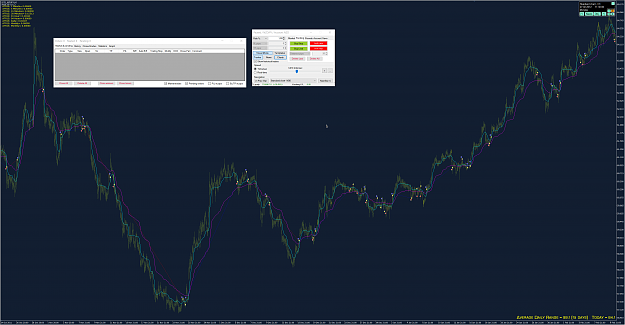
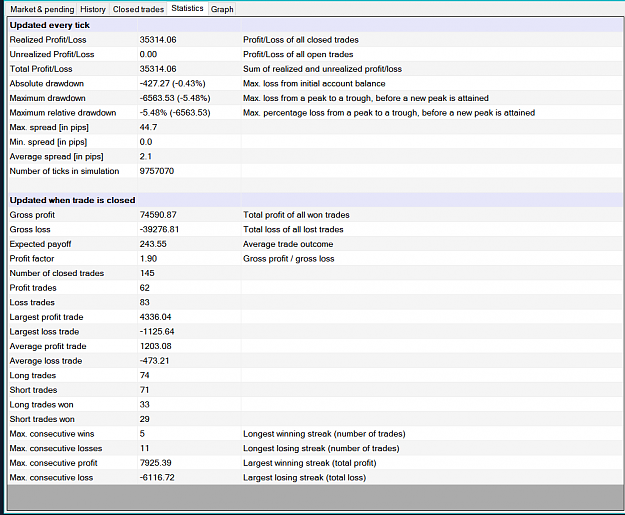
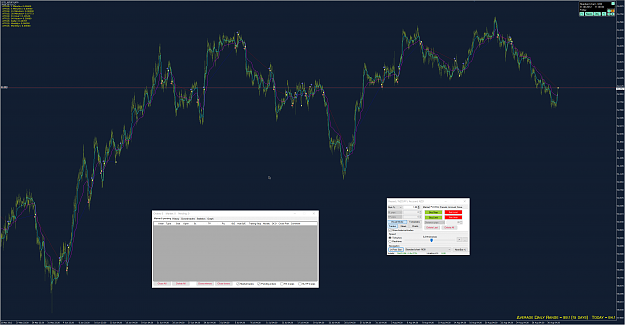
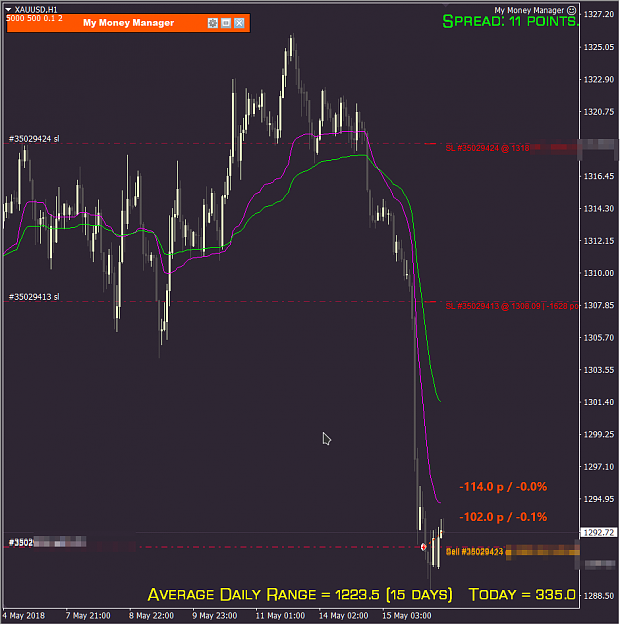
30m testing but seen on 1h time frame. Less whipsaws, but with worse exits and entries. If you are worried about SWAP, I think length of trades is similar to 30m, but much less losses. {image} Another idea: 1. Entry according to M30 2. Exit according to H1. Completely unnecessary chop done on M30 seen from H1: {image}
Ignored
Nice way to visualise mate. Thanks for the idea. If we fully automate...then this approach is going to be more problematic and we might lose this gem :-)
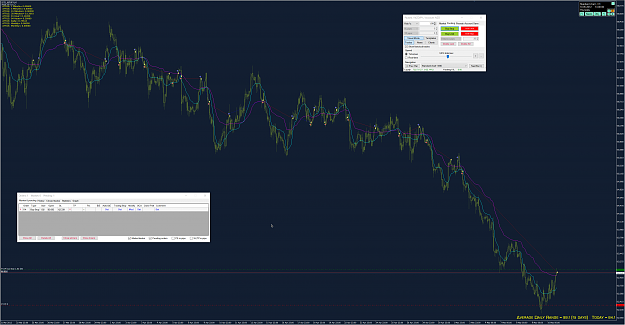
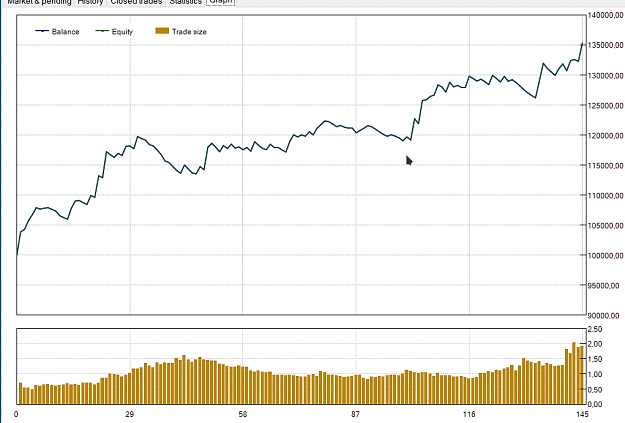
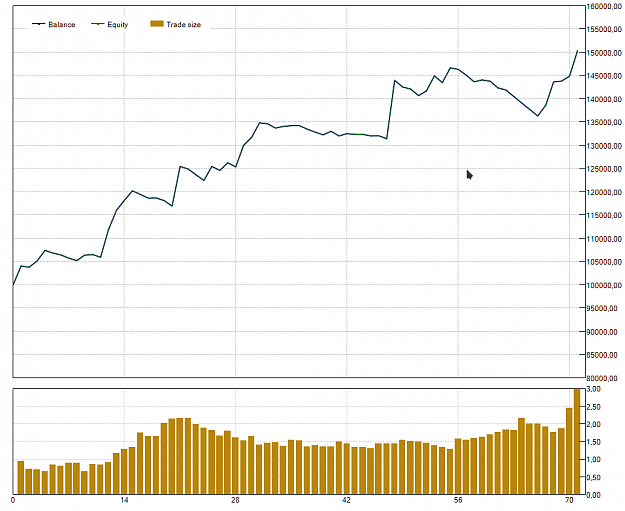
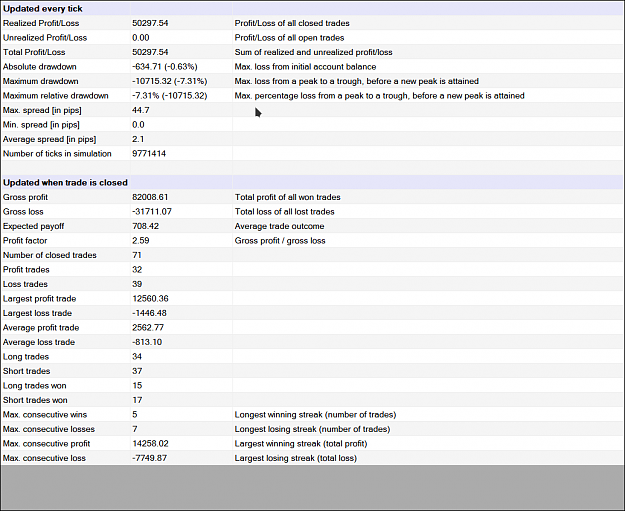
{quote} So here it is. All is the same as in 30M test, except this: 1. Position is 0.75 ATR daily. About 5 full SL hit during year. 2. Time frame is 1h {image} {image} {image} My reaction: {image}
Ignored
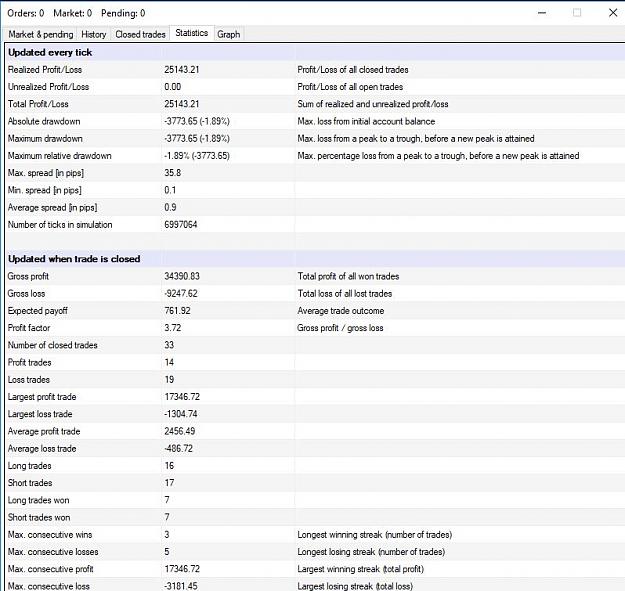
Christ....look at that profit factor. Hehehehehehe. My mind is boggling in regards to what this is going to do in a portfolio.
{quote} Christ....look at that profit factor. Hehehehehehe. My mind is boggling in regards to what this is going to do in a portfolio. Double kaboom. I dare you to touch my head!!!!! {image}
Ignored
And the MAR ratio? Do I calculate it correctly?
50.2%/7.31% = 6.83
Cut short your losses. Let your profits run on. David Ricardo (1772-1823)
{quote} And the MAR ratio? Do I calculate it correctly? 50.2%/7.31% = 6.83
Ignored
Yep mate. That's it. A years worth of % returns/Max Draw = MAR or if a longer time series CAGR/Max Draw
Under such a high MAR....there is lots of room to dilute and still get wicked returns which may be necessary under a *no stops* regime in a portfolio context. I am testing on 0.5% position sizing. Are you on 1%?
Pretty astounding. It is the fidelity of the indicators movement that freaks me out and what it discriminates between noise and signal :-)
{quote} Yep mate. That's it. A years worth of % returns/Max Draw = MAR or if a longer time series CAGR/Max Draw Under such a high MAR....there is lots of room to dilute and still get wicked returns which will may necessary under a *no stops* regime in a portfolio context. I am testing on 0.5% position sizing. Are you on 1%? Pretty astounding. It is the fidelity of the indicators movement that freaks me out and what it discriminates between noise and signal :-) {image}
Ignored
I am on 1% of capital. So it changes with capital. It is not constant.
Entry on gold vs breakout.
Attached Image (click to enlarge)
Cut short your losses. Let your profits run on. David Ricardo (1772-1823)
{quote} I repeat that since I don't think it is wise to be 100% of the time in any market by just reversing your position, I proposed to open a position when both H1 and M30 are giving an entry signal (you filter out trades given by M30 but not confirmed by H1) and exit using M30 TF only. To be even more clear let us suppose that we have in H1 a buy signal which lasts for ie three months. During those three months, M30 gives say three buy signals and two sell signals. We take the three buy signals only. We always exit using M30 as proposed by you...
Ignored
Mate...I really like this idea but am having troubles doing it manually through my soft4fx backtester. Once we get this fully automated...you idea is a very good one and we will test it out. :-)
|
Commercial Member
|
Joined Apr 2013
|4,366 Posts
Testing DAX now.
Just into it and kaboooom....16 x R !!!! It gives you so much more of the meat of the move with compressed position sizing. This smells a lot like DIBS and Millipede.
|
Commercial Member
|
Joined Apr 2013
|4,366 Posts
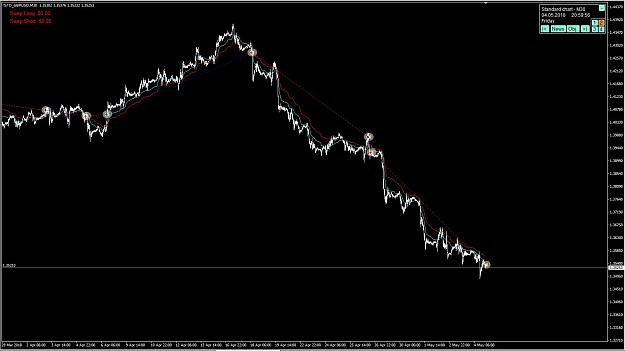
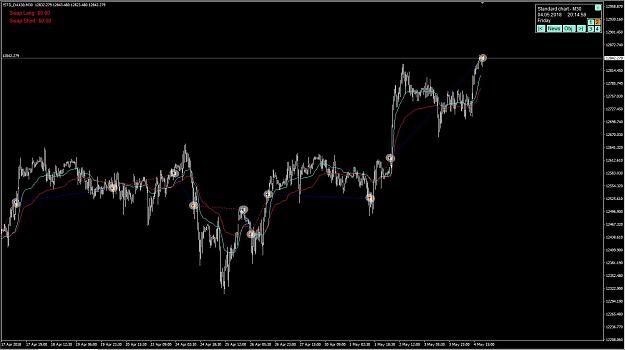
DAX completed 1 Jan 2018 top 5 May 2018
Here is how it ended up.....and still has future long potential.
Attached Image (click to enlarge)
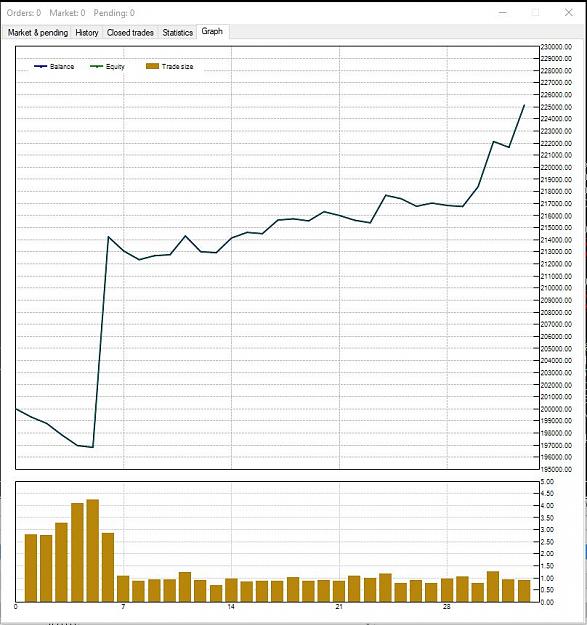
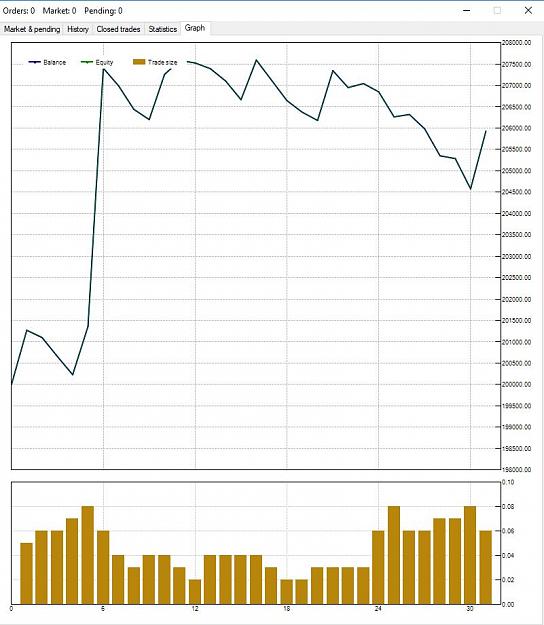
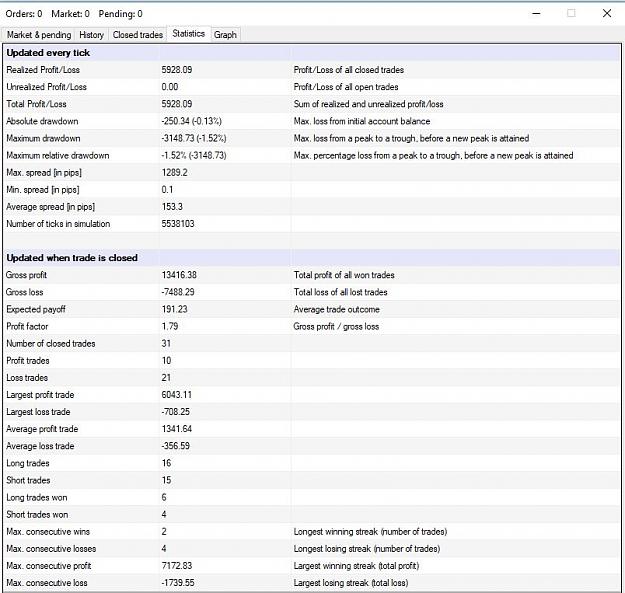
Here are the metrics using approx 0.5 x ATR for position sizing and 0.5% trade risk or in this case a fixed $500 amount.
Attached Image (click to enlarge)
Attached Image (click to enlarge)
Key Point: The avoidance of stops is a key factor of success for this continuously *on* strategy. Defensive stops by their nature introduce adverse drawdowns into the strategy. There is no way around this as your worst temporary adverse excursion will inevitably trigger your stops. With no stops....the result of whipsaws is effectively a random result that could be profitable or unprofitable. Using hard stops...whipsaws are your worst enemy. Under a portfolio...performance exits are usually favored to hard stops.
Attached Image (click to enlarge)
As a single strategy unfortunately stops cannot be avoided for survival long term but as a portfolio play they can..... provided that the trade risk % is sufficiently small and you use performance based exits that are non-lagging in nature. For example a 0.5% trade risk would allow you to get through the famous Swissy event with a max 2% loss. Most portfolio managers in the professional space do not use stops in their portfolios as the whole purpose of the portfolio itself is to manage risk through playing dozens of low correlated return streams.