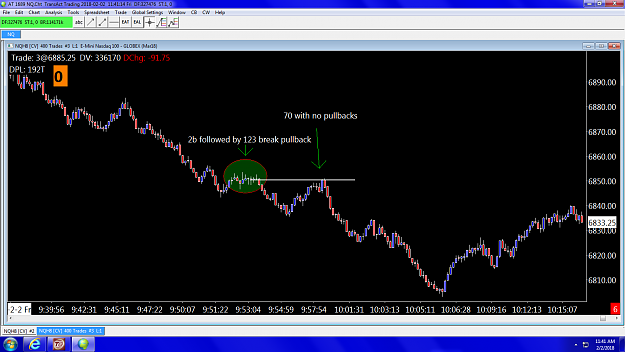
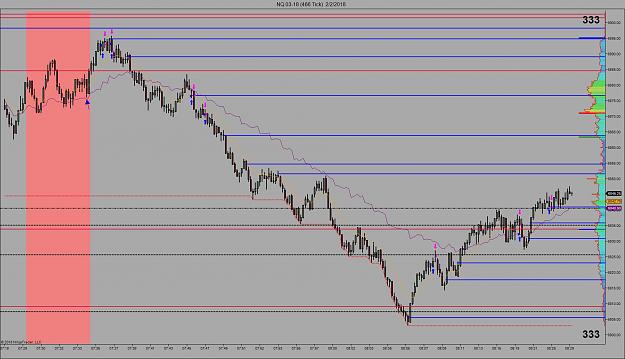
like we say everyday now, very fast. looking back thru the larger chart ( I use a 466 tick ) I see some nice pb trades, but I am trying things a bit different off the 233 chart, using a 6 range to find supply and demand. I managed +13 ticks for the day. 1 loser, 2 winners and a couple of +1's. +10 after commissions. Not great by any means, but positive. The idea behind the range chart is that I thought it would be easier to see and plot supply and demand areas off a range chart. I don't know if that is the case, but it keeps me really focused. I will post my 466 tick chart. Trades don't make a lot of sense on that chart, and in reviewing it, I would say that I am entering trades in all the wrong spots, but still managed a positive day. I am not overly concerned about taking big winners. A plus 12 or 13 more that covers a -10 loss. And I agree 100% with what Harold says about 20 ticks per day. For me consistency is what is most important. Just 2 +12's gets me to 20 ticks per day if I can manage that without a loss. It does seem that on a day like today over 100 ticks is more that possible, but again for me that is not important.
Attached Image (click to enlarge)
2