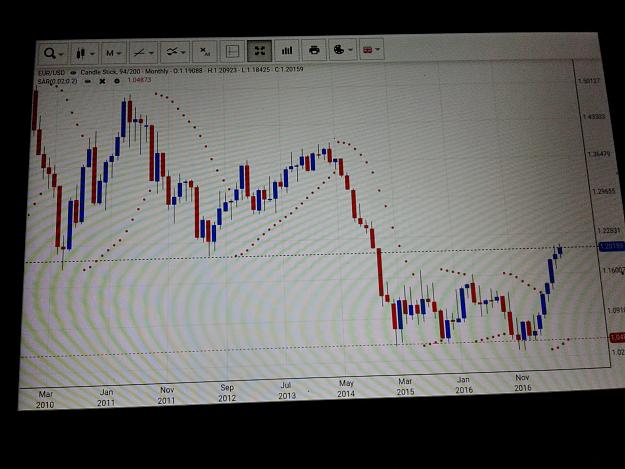
The chart below is a monthly Parabolic SAR chart for EUR/USD pair. All you do is follow the positioning of PSAR. If down you buy, if up you sell. The daily chart is for short term trades, weekly chart for swing trades, while monthly is for long-term trades. You try all three periods and see which one gives you the most returns in a given year. You buy into a better market price before closing a losing trade, to maintain long-term ownership of any given Forex pair. Your feedbacks are welcome.
Attached Image (click to enlarge)
Mecrandie