Blending the Waves to Create the Tsunami

Do you remember in that boring physics class at school where you may have played around with wave tanks to observe wave diffraction patterns at work? They say that you really don't learn anything at school that has to do with entering the real world.... Well think again as we really have to be careful in our assumptions. The principles of dampening and amplification of wave functions which you learn in the physics class really has everything to do with trading a portfolio.
We hear about the benefits of the 'free lunch' offered by diversification, but the majority of us don't ask the question why? That's a shame for if you can grasp the concepts of wave interference, you will find that this very general principle can be found in a complex system almost everywhere you look as this is the way at a very deep level that energy transference in a complex system manifests itself. For example the picture above represents interaction events between what we regard with our classical glasses on as fundamental particles. You actually don't need to go to school to learn this principle. Anyone with a bathtub can experience this principle at work by splashing around a bit.
......anyway without getting to sciencey, the general principle is this. If two 'coherent' waves (perfectly in phase) and of the same amplitude interact together you get a new 'emergent' wave that is twice the amplitude. If two incoherent (180 degree out of phase) waves of the same amplitude waves interact together, the wave disturbance is cancelled. This general principle can be applied to any wave function no matter what their amplitude resulting in an emergent wave form that is representative of the individual waves contributions in terms of phase (frequency) and amplitude.
This general principle gives the free lunch in a diversified portfolio as in terms of diversification the individual waves become individual return distributions. When you combine individual returns distributions of your portfolio, the principles of 'dampening and amplification' apply to the resultant emergent return distribution of the entire portfolio.
Armed with this principle of bath time experimentation, you can then confidently apply this principle to any interaction of return distributions and immediately recognise that provided two return distributions are not perfectly correlated, you will *always* achieve a better risk-adjusted return under a portfolio that is diversified against what can be achieved by the simple summation of the return distributions of each individual contributor. This is where the 'free lunch' arises.
Now armed with this knowledge, you can apply principles of correlation to create a tsunami from the composite parts that delivers stunning risk-weighted returns and a great equity curve with little volatility.
Blending the Discretionary Portfolio's
Now up until this point in this thread we have been discussing the application of discretionary systems such as the DTT, EDTT, EDTT1 and DTTR in isolation. Given our penchant for a diversified approach to trend trading, what we need to do now, given that we have a bit of historical data from our walk forward testing, is to see how we can blend these individual discretionary systems under a broader portfolio.
We now have walk forward data from the EDDT1 that commences from 1 Jan 2015 and walk forward data from the DTTR that commences from 27 April 2016. Unfortunately these don't have the same commencement dates....but don't worry, portfolio blending does not need this requirement as we continuously adapt our portfolio to 'evolve' with emerging market conditions by adding individual contributors on a progressive basis as we find worthy candidates. This is how we ensure that we keep up with emerging market conditions and never rest on our laurels that a particular portfolio configuration will stand the test of time.
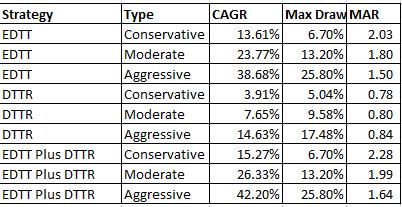
In going forward on this thread, I will therefore be regularly posting the results of the EDTT in isolation, the DTTR in isolation and a composite blend of both the EDTT plus the DTTR and comparing the results. If our assumptions are right regarding the bold claim regarding a free lunch, we should find that over time according to the Law of Large Numbers that the blend using the same initial capital of $200K will always outperform the composite parts in terms of delivering superior risk-adjusted returns.
So let's get into it.......

EDTT in Isolation
Base Model ("The once bitten twice shy version")
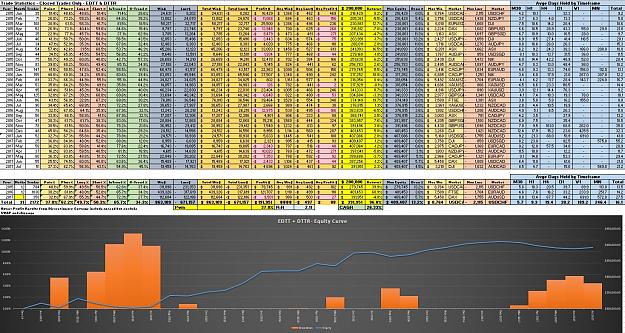
Summary result for the testing period of closed trades: 13.61% CAGR with 6.7% Max Draw = MAR (CAGR/Draw) of 2.03
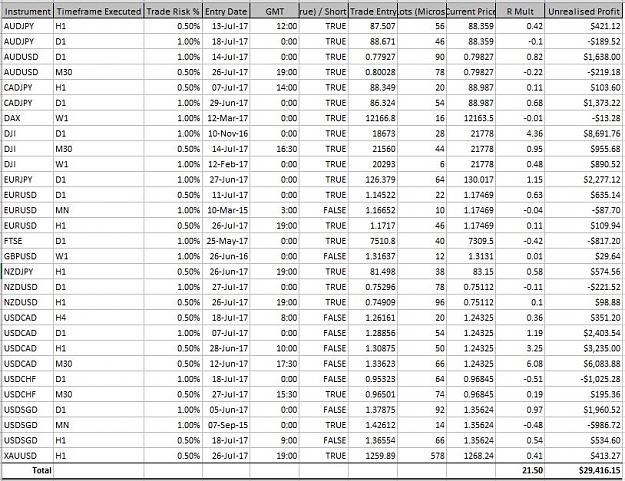
Results of Closed Trades

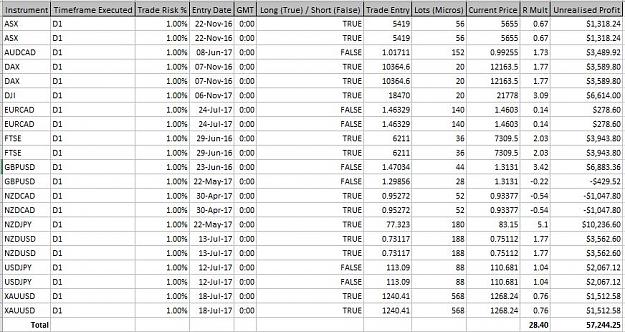
Unrealised Trades

Modest Scaling of Base Model ("I am a confident bastard version") - 2 x position sizing
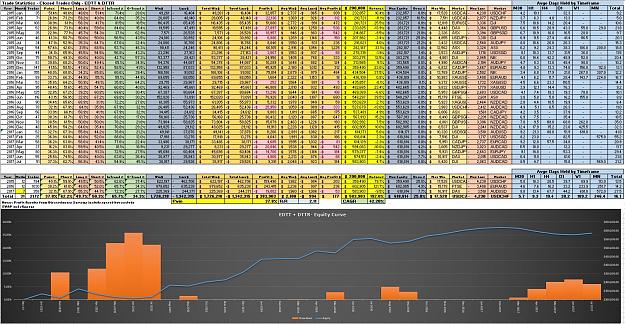
Summary result for the testing period of closed trades: 23.77% CAGR with 13.2% Max Draw = MAR (CAGR/Draw) of 1.80
Results of Closed Trades

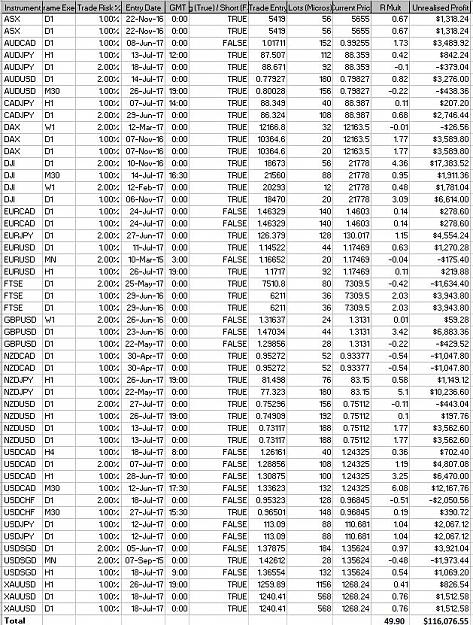
Unrealised Trades
Aggressive Scaling of Base Model ("I am a confident bastard with a death wish version") - 4 x position sizing
Summary result for the testing period of closed trades: 38.68% CAGR with 25.8% Max Draw = MAR (CAGR/Draw) of 1.50
Results of Closed Trades

Unrealised Trades

To be continued.........
C
Attached Image (click to enlarge)
Do you remember in that boring physics class at school where you may have played around with wave tanks to observe wave diffraction patterns at work? They say that you really don't learn anything at school that has to do with entering the real world.... Well think again as we really have to be careful in our assumptions. The principles of dampening and amplification of wave functions which you learn in the physics class really has everything to do with trading a portfolio.
We hear about the benefits of the 'free lunch' offered by diversification, but the majority of us don't ask the question why? That's a shame for if you can grasp the concepts of wave interference, you will find that this very general principle can be found in a complex system almost everywhere you look as this is the way at a very deep level that energy transference in a complex system manifests itself. For example the picture above represents interaction events between what we regard with our classical glasses on as fundamental particles. You actually don't need to go to school to learn this principle. Anyone with a bathtub can experience this principle at work by splashing around a bit.
......anyway without getting to sciencey, the general principle is this. If two 'coherent' waves (perfectly in phase) and of the same amplitude interact together you get a new 'emergent' wave that is twice the amplitude. If two incoherent (180 degree out of phase) waves of the same amplitude waves interact together, the wave disturbance is cancelled. This general principle can be applied to any wave function no matter what their amplitude resulting in an emergent wave form that is representative of the individual waves contributions in terms of phase (frequency) and amplitude.
This general principle gives the free lunch in a diversified portfolio as in terms of diversification the individual waves become individual return distributions. When you combine individual returns distributions of your portfolio, the principles of 'dampening and amplification' apply to the resultant emergent return distribution of the entire portfolio.
Armed with this principle of bath time experimentation, you can then confidently apply this principle to any interaction of return distributions and immediately recognise that provided two return distributions are not perfectly correlated, you will *always* achieve a better risk-adjusted return under a portfolio that is diversified against what can be achieved by the simple summation of the return distributions of each individual contributor. This is where the 'free lunch' arises.
Now armed with this knowledge, you can apply principles of correlation to create a tsunami from the composite parts that delivers stunning risk-weighted returns and a great equity curve with little volatility.
Blending the Discretionary Portfolio's
Now up until this point in this thread we have been discussing the application of discretionary systems such as the DTT, EDTT, EDTT1 and DTTR in isolation. Given our penchant for a diversified approach to trend trading, what we need to do now, given that we have a bit of historical data from our walk forward testing, is to see how we can blend these individual discretionary systems under a broader portfolio.
We now have walk forward data from the EDDT1 that commences from 1 Jan 2015 and walk forward data from the DTTR that commences from 27 April 2016. Unfortunately these don't have the same commencement dates....but don't worry, portfolio blending does not need this requirement as we continuously adapt our portfolio to 'evolve' with emerging market conditions by adding individual contributors on a progressive basis as we find worthy candidates. This is how we ensure that we keep up with emerging market conditions and never rest on our laurels that a particular portfolio configuration will stand the test of time.
In going forward on this thread, I will therefore be regularly posting the results of the EDTT in isolation, the DTTR in isolation and a composite blend of both the EDTT plus the DTTR and comparing the results. If our assumptions are right regarding the bold claim regarding a free lunch, we should find that over time according to the Law of Large Numbers that the blend using the same initial capital of $200K will always outperform the composite parts in terms of delivering superior risk-adjusted returns.
So let's get into it.......
Attached Image (click to enlarge)
Inserted Video
EDTT in Isolation
Base Model ("The once bitten twice shy version")
Summary result for the testing period of closed trades: 13.61% CAGR with 6.7% Max Draw = MAR (CAGR/Draw) of 2.03
Results of Closed Trades
Attached Image (click to enlarge)
Unrealised Trades
Attached Image (click to enlarge)
Modest Scaling of Base Model ("I am a confident bastard version") - 2 x position sizing
Summary result for the testing period of closed trades: 23.77% CAGR with 13.2% Max Draw = MAR (CAGR/Draw) of 1.80
Results of Closed Trades
Attached Image (click to enlarge)
Unrealised Trades
Attached Image (click to enlarge)
Aggressive Scaling of Base Model ("I am a confident bastard with a death wish version") - 4 x position sizing
Summary result for the testing period of closed trades: 38.68% CAGR with 25.8% Max Draw = MAR (CAGR/Draw) of 1.50
Results of Closed Trades
Attached Image (click to enlarge)
Unrealised Trades
Attached Image (click to enlarge)
To be continued.........
C
1