- Search Forex Factory
- 103 Results
-
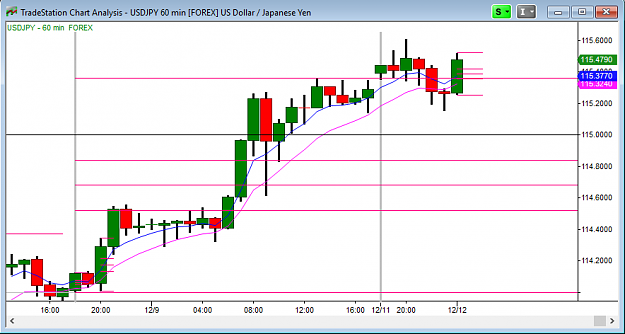
 zusch replied Dec 11, 2016
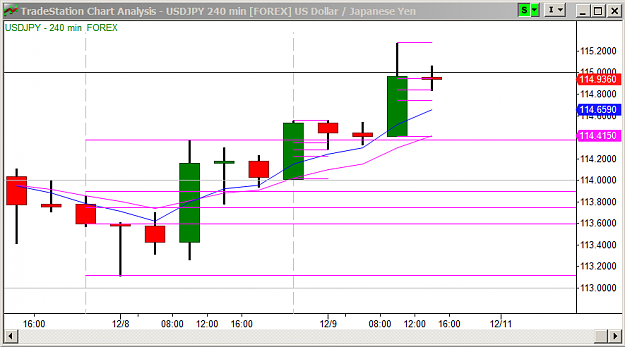
USDJPY 1hr set to close thru Friday's high. Healthy dip below last week's closing price. No test of 115 very possible.
USD/JPY Discussion
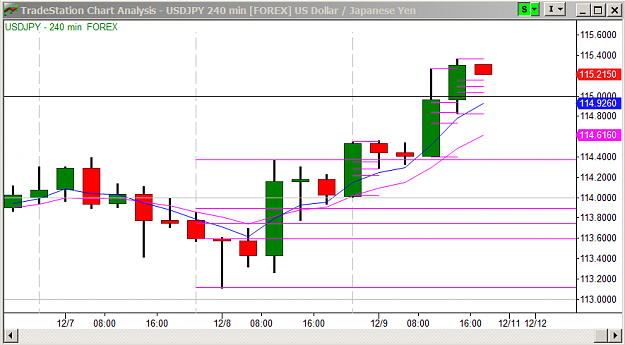
- zusch replied Dec 9, 2016
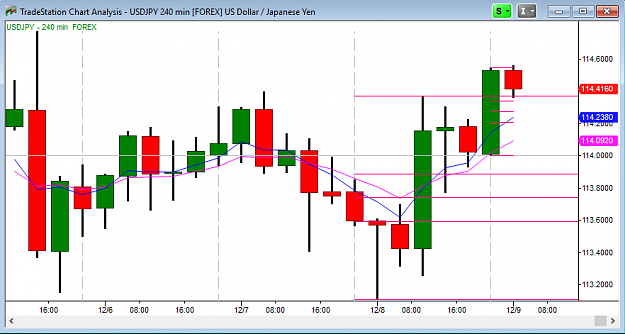
4HR close thru 115, four hours to go in the week. Can add another position, but possible market retraces to 115 next week.
USD/JPY Discussion
- zusch replied Dec 9, 2016
Slow momentum thru London open, but 4HR candles held nicely above yesterday's high before squeezing up to 115. New setup below 115 right at U.S. (equity) open, 3.5 hours left in current candle.
USD/JPY Discussion
- zusch replied Dec 8, 2016
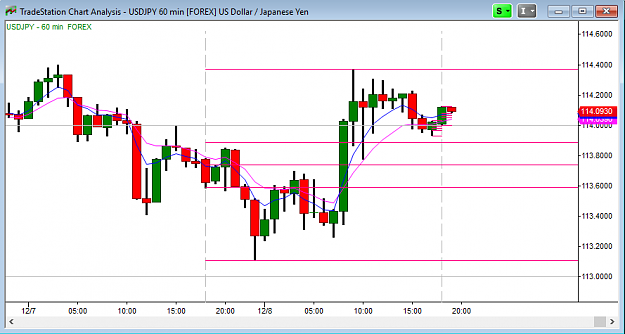
USDJPY 4HR close above previous day high. 2 hours left in current candle.
USD/JPY Discussion
- zusch replied Dec 8, 2016
USDJPY 1HR. Very low risk entry with the bullish uptrend on monthly/weekly/daily candles. I don't set price targets but seems reasonable pair could reach 120 this month based on November's great move.
USD/JPY Discussion
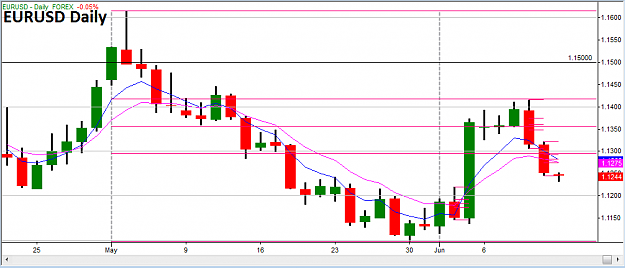
- zusch replied Jun 12, 2016
Last month's engulfing candle in EURUSD offered a near exact 61.8% retrace of May's range. Sellers now in control on Monthly/weekly/daily charts. As Graeme always said, "look inside the inside of the inside." (post 766)
Building an equity millipede
- zusch replied May 26, 2016
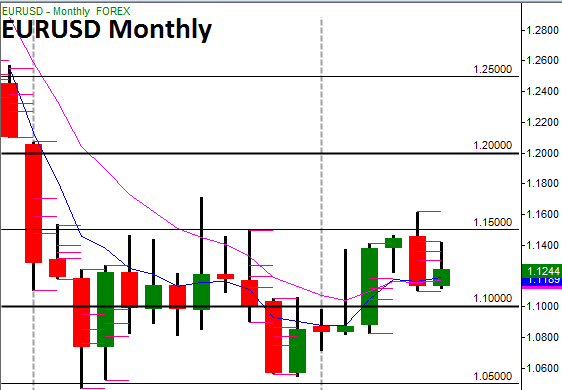
Sad to see not much activity in this thread, but I wanted to bring to everyone's attention a monthly bearish engulfing candle in $EURUSD about to close after a year of choppy movement. Could be the start of another major leg down.
Building an equity millipede

- zusch replied Dec 5, 2013
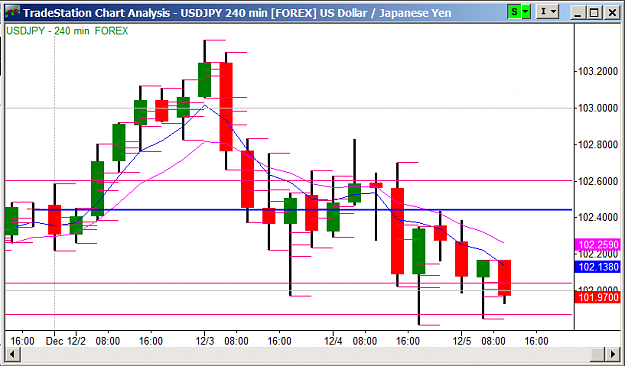
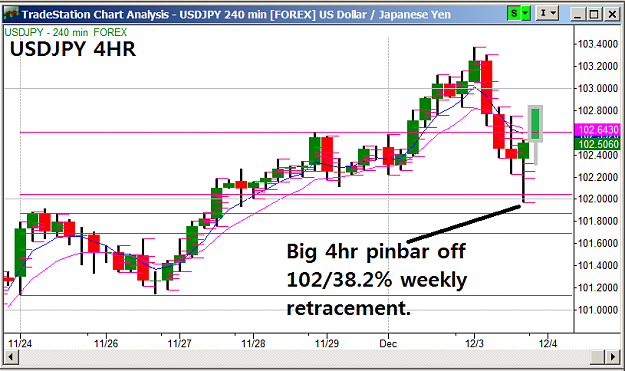
2 hours 'till USD prelim GDP and unemployment claims. Last 4hr candle looks good and shows me traders are positioning longer under/at 102. When the data hits I think you could see brief spike down, but by 9:00 New York time when current 4hr candle ...
USD/JPY Discussion
- zusch replied Dec 3, 2013
This is why I always wait for daily close if I'm still in profit and my position hasn't been hit at breakeven. Daily candle was looking pretty bad, but having patience usually pays off. Massive 4hr pinbar that some traders here are talking about. I ...
USD/JPY Discussion
- zusch replied Nov 26, 2013
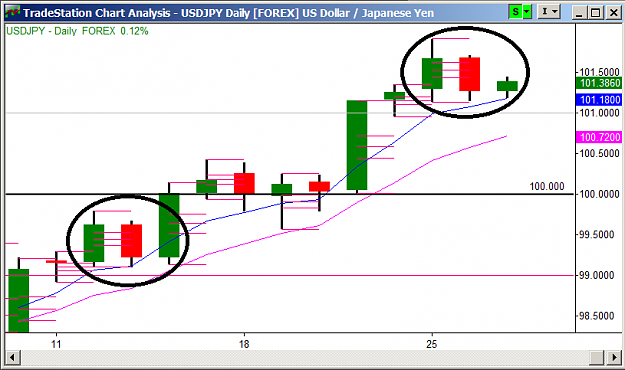
They just look similar that is all. Here is the daily chart from the 5min time periods in previous post.
USD/JPY Discussion
- zusch replied Nov 26, 2013
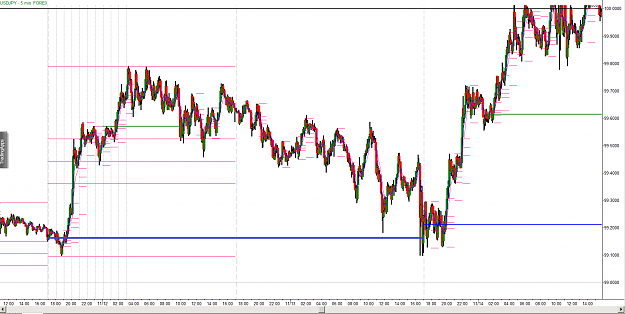
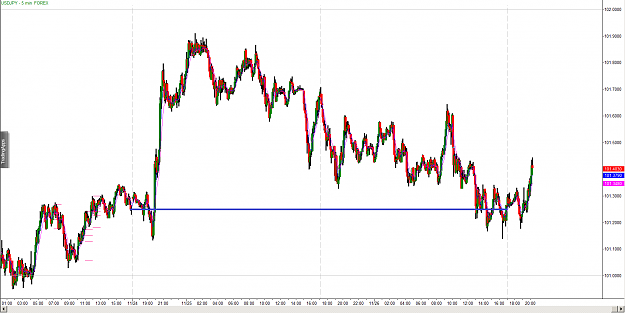
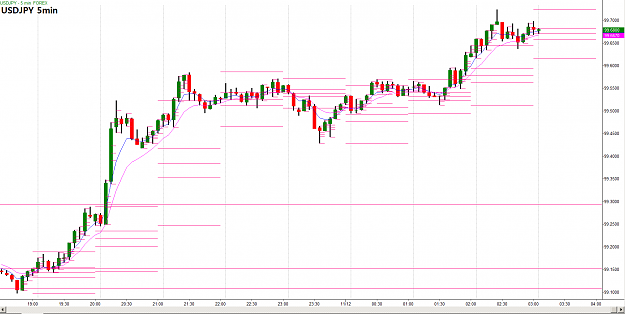
First chart is 5min price action Nov. 12-14. 2nd chart is price action for this week.
USD/JPY Discussion
- zusch replied Nov 21, 2013
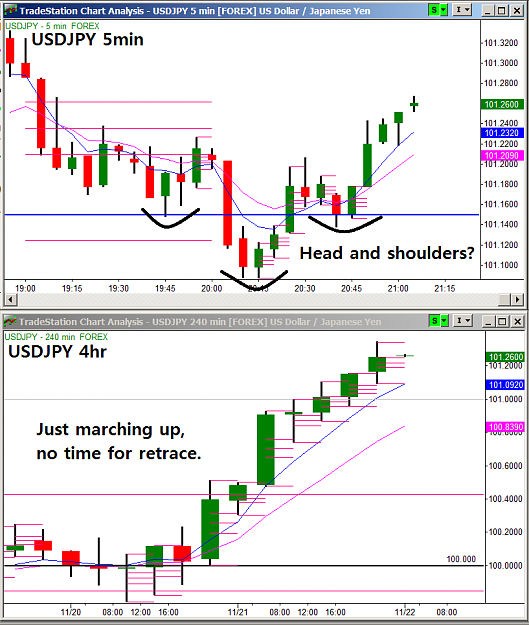
Not much resistance on my charts. Here is what my 4hr and 5min charts look like. I don't trade price targets, but if I had to guess, we top out at 101.89 this week.
USD/JPY Discussion
- zusch replied Nov 17, 2013
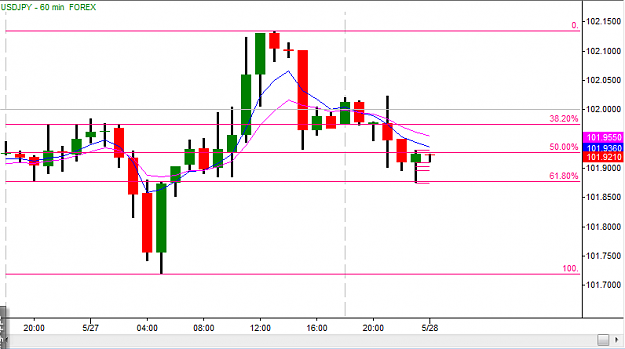
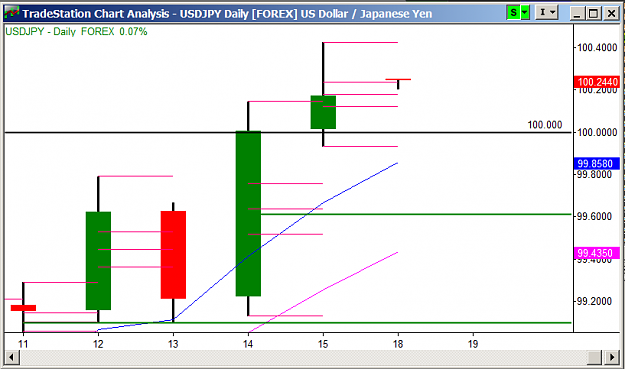
So far the 5min price action has been good, but this entry was more of a daily entry. I see this kind of set up all the time in the stock market where you get gaps every day. Price gapped above the 38.2% daily retrace, dipped just a bit, and will ...
USD/JPY Discussion
- zusch replied Nov 12, 2013
Very clean 5min action. Some sellers showing up, but I'm still holding longs. ES looking a bit weak too.
USD/JPY Discussion

- zusch replied Nov 10, 2013
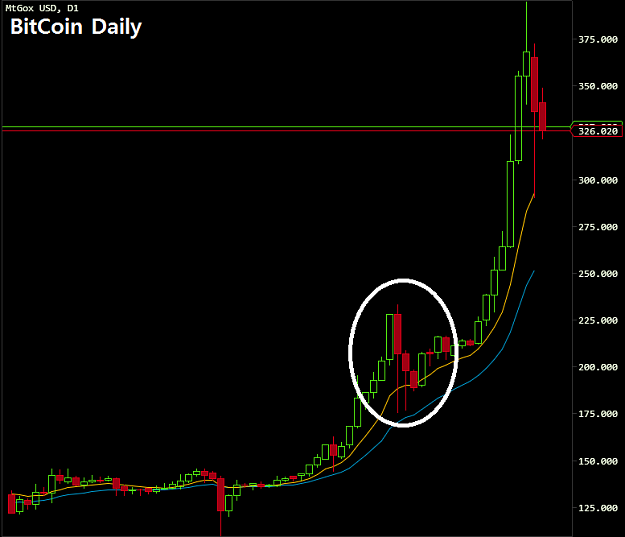
I'll try and update when I think the low risk opportunity presents itself, but I'm generally looking for a pattern similar to what is circled in white.
Bitcoin technical analysis
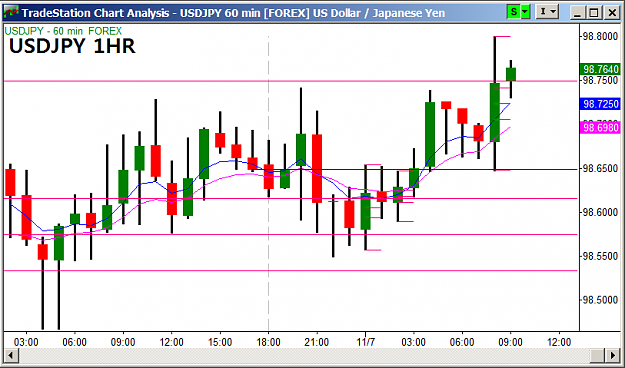
- zusch replied Nov 7, 2013
Not trying to be a dick, but I'm not feeling your pain lol. I jumped out a breakeven when we dropped. Price just doesn't reverse like that for no reason unless something big is happening. Shoot first, ask questions later. The most concerning part ...
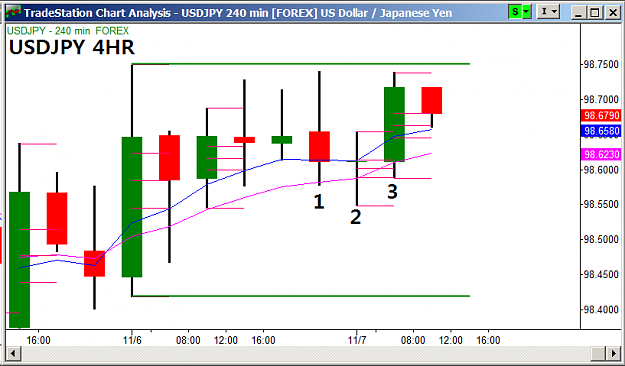
USD/JPY Discussion

- zusch replied Nov 7, 2013
Monthly, weekly, daily, 4hr, 1hr ALL SAY BUY. Does anyone really want to be short right now?
USD/JPY Discussion