- Search Forex Factory


- My thoughts on various marketsStarted Jun 1, 2008|Trading Journals|6 replies

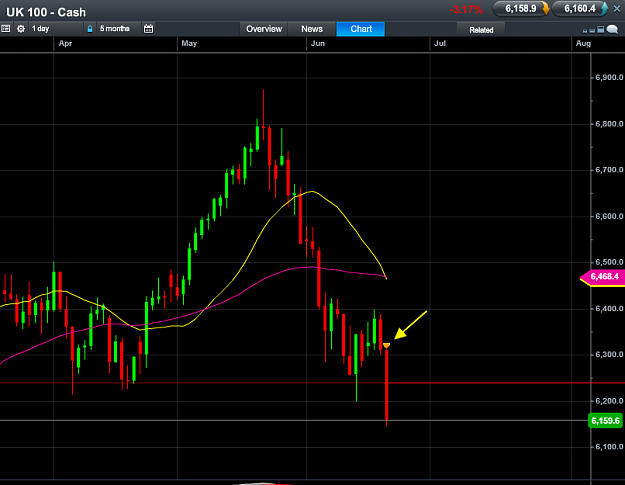
Putting these charts in for my reference first and foremost. I find that if I make the effort to ...


Putting these charts in for my reference first and foremost. I find that if I make the effort to ...