- Search Forex Factory
- 46 Results
-
 uidro replied Nov 20, 2021
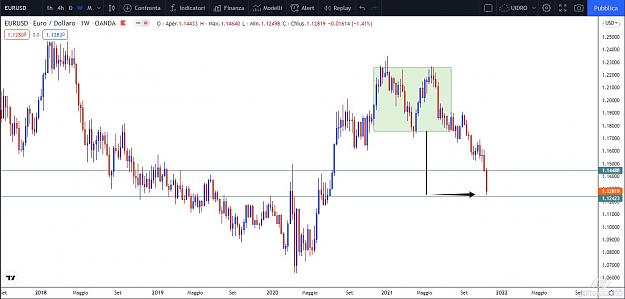
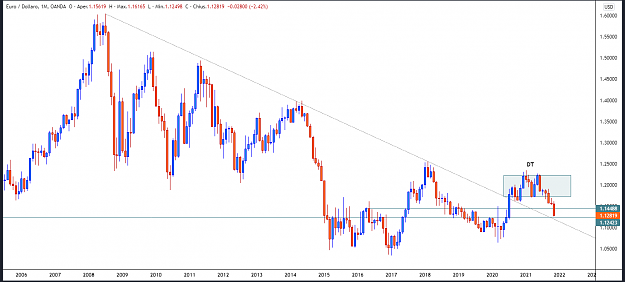
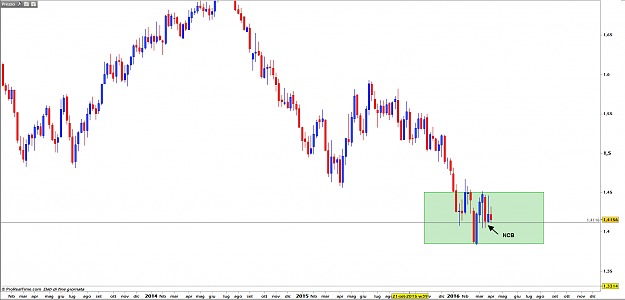
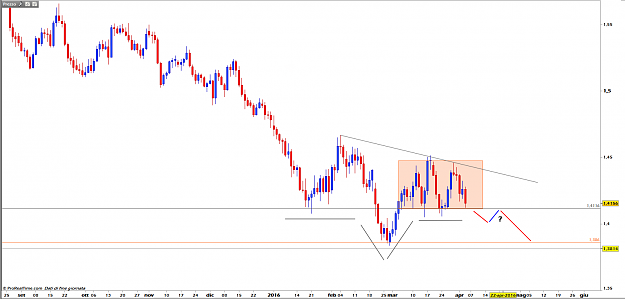
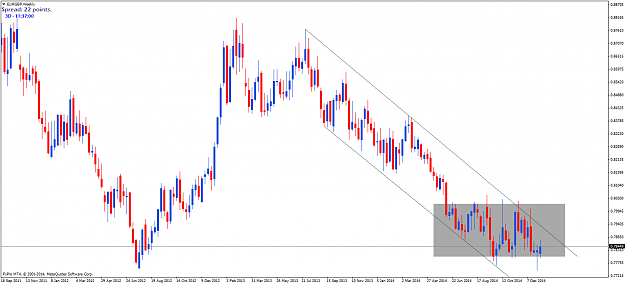
EUR-USD. I think the price is on target of the double top M in convergence with S 1,1242 and the trend line, dynimic S. In the chart W i think is not a H&S cause the right shoulder is ti the same level of the head, this is the simple double top. The ...
james16 Chart Thread
- uidro replied Nov 20, 2021
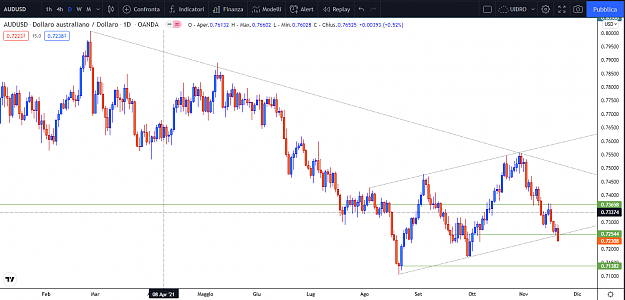
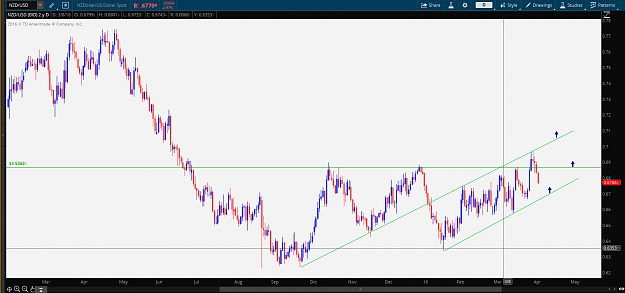
My opinion on AUD-USD. The situation is bearish in this moment but i wait some more confirm for entry short: -D candle closed down the channell and down the support W ( green color ). -H4 can see the reaction of S with the PB bulliish and the last ...
james16 Chart Thread
- uidro replied Aug 8, 2017
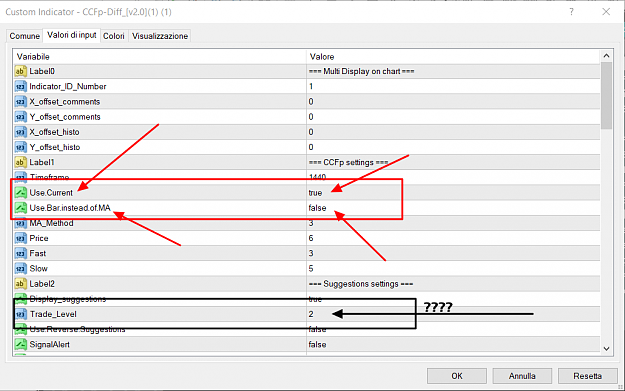
Hello guys,Someone can explain the difference between these two parameters. True or false? Also, what changes with a different number in the "trade level"? Thanks
CCFp weekly signals (set and forget basket trading)
- uidro replied Apr 5, 2016
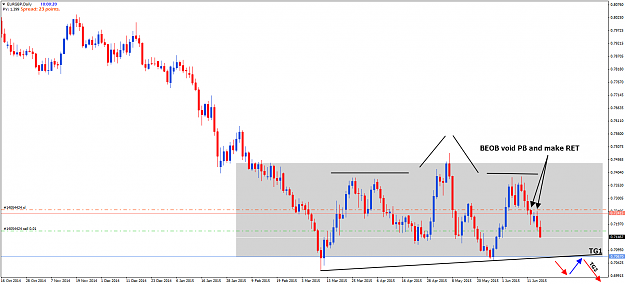
Yes Nbr, this scenario it's ok , the P is in a strong downtrend. But WPD?? In M chart??W and D? This downtrend loosing power. This is not mean the P can't go to your TG but only that you have to be careful. The RM in W chart, watching in D chart ...
Beyond the Candles

- uidro replied Apr 5, 2016
Thank you Bill , we think the same. Only in the W1 have a breakout of the trendline to give a strength of a view long......but ,same you say, have a solid downtrend and not easy to reverse. image
james16 Chart Thread
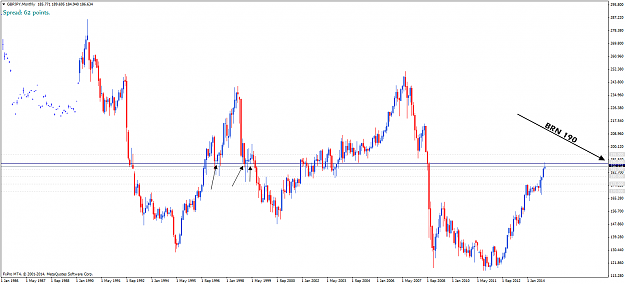
- uidro replied Jan 10, 2015
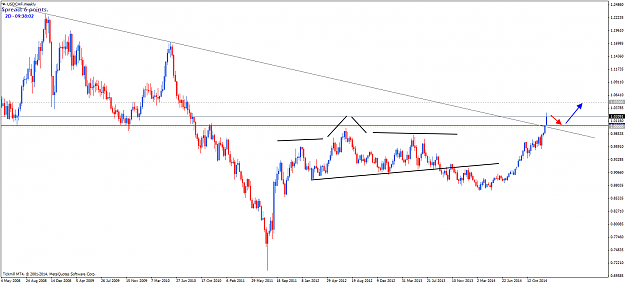
Look the level M. In this moment can't look for a short in this cross!!! Not have only 1 information bearish in the high TF. BRN 1 are really import level. H&S W invalidated
Beyond the Candles
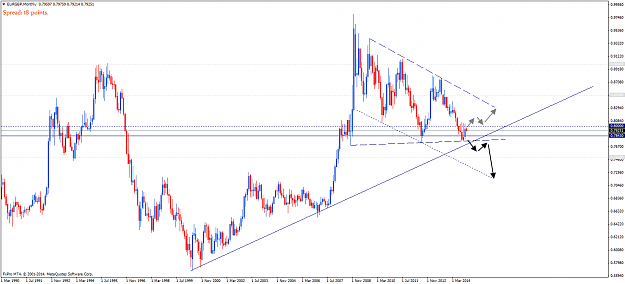
- uidro replied Jan 7, 2015
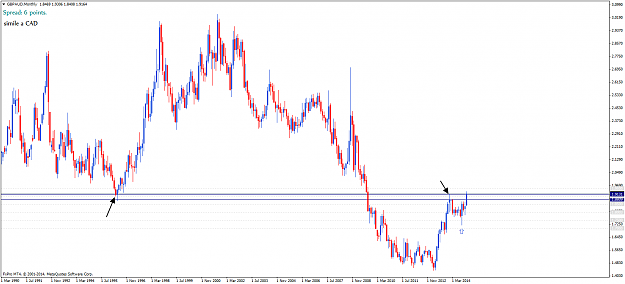
I don't look to this cross cause it's a twin of EUR-GBP reversal but the spread are so different. Look the chart it's really the same but backward. Attention only about this trade is CT, P stay inside a big channel PS: How you can set a double TP??
Beyond the Candles
- uidro replied Dec 18, 2014
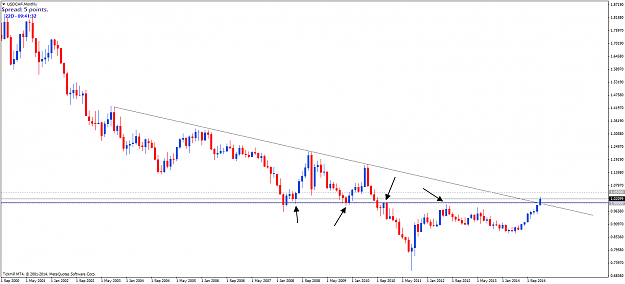
I think is so late now for a long trade. Need to wait a confirm M at the level 1.9131, a strong R. I think sellers now try to defend this level same do a few mounth ago.
Beyond the Candles
- uidro replied Dec 17, 2014
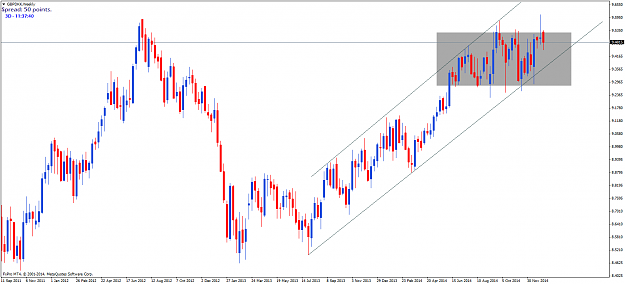
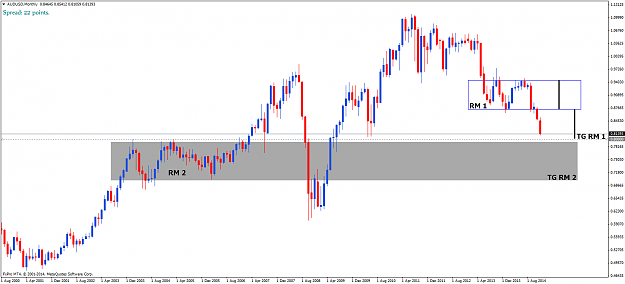
AUD-USD I look more simple. BO of RM and P going to his TG. Next we don't know. If P come back in the past RM (grey) we have a new TG
Beyond the Candles
- uidro replied Dec 13, 2014
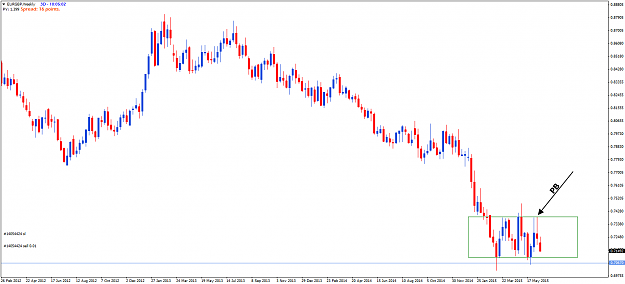
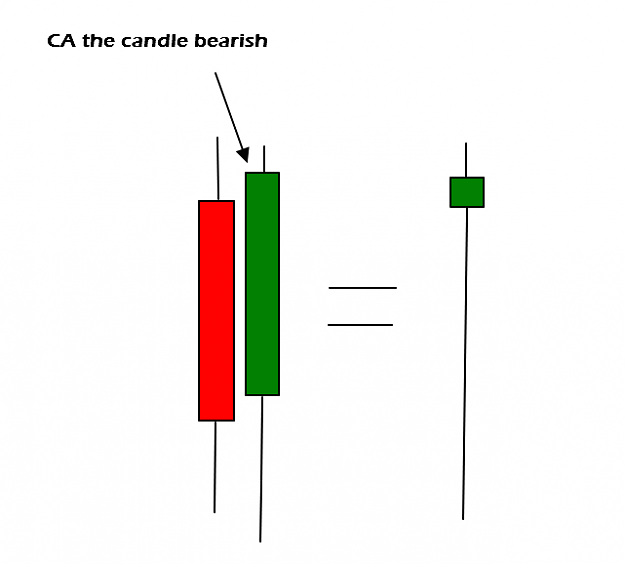
-Hi Ttf, your rectangle blu are not a RM, so are not possible a breakout. -The weekly formation can't be a 2D inverted PB, maibe a 2W but i'm not sure exist a 2(TF) IPB.......so busy but if exist the candle bearish nedd to close below the candle ...
Beyond the Candles
- uidro replied Dec 13, 2014
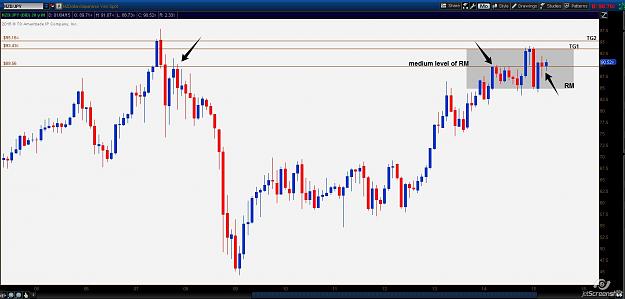
is what happened !! P is arrived at TG and CA the RM but not to R 1.4435 . Now i wait to understand WPG. Come back in RM or go on bullish? In M just have a LH but the T is bearish for many mounth and w and D too.
Beyond the Candles
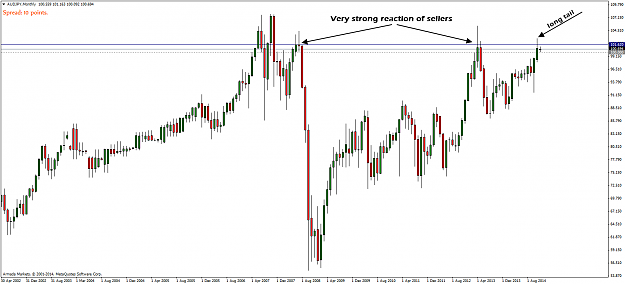
- uidro replied Dec 2, 2014
AUD-JPY montly levels are always important!!! T up but look the reaction of sellers at the R 101.62. From BRN 100 to 101.62 for me are a no trade zone. I'm waiting the P up with a great confirm.
Beyond the Candles
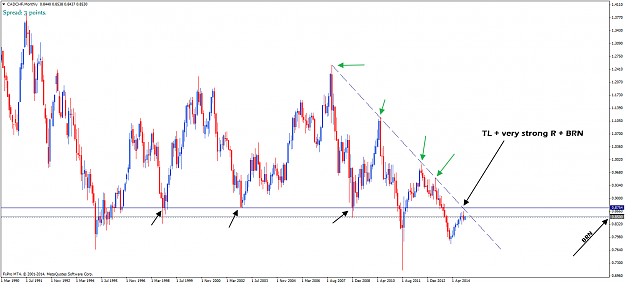
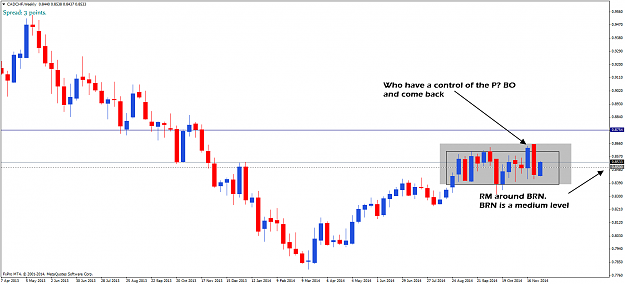
- uidro replied Dec 2, 2014
CAD-CHF are in a sensitive moment. WPD and WPG?? Not easy to understand . When you can not answer this question better stay out to the market. Check EUR-CAD too. Is the same thing but in reverse. If your analysis with this 2 cross are different is ...
Beyond the Candles
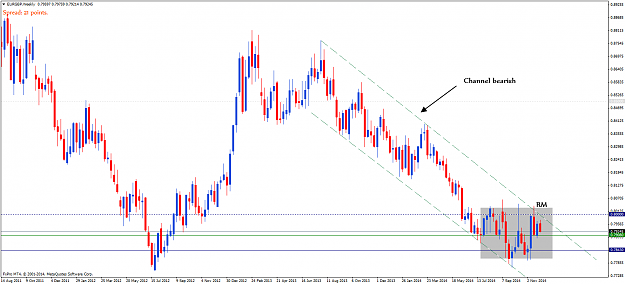
- uidro replied Dec 1, 2014
EUR-GBP : WPD? I don't know . Break the triangle or come back to the R? I wait to understand that
Beyond the Candles
- uidro replied Oct 12, 2014
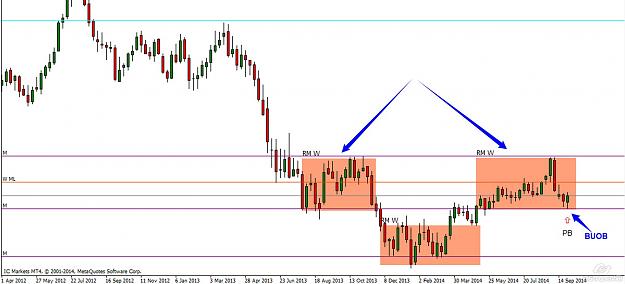
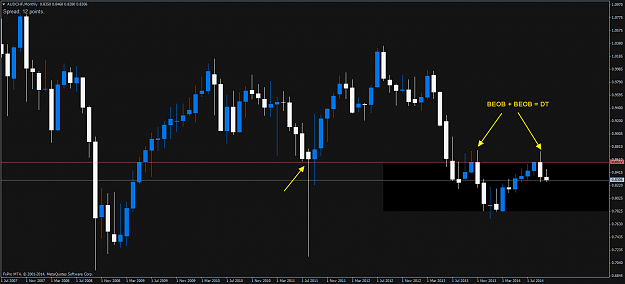
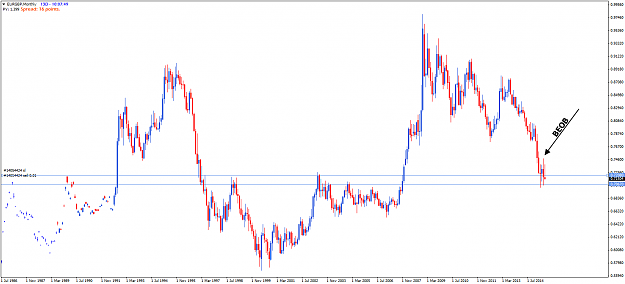
I Ponchofx, i think 2 of the 3 RM in your chart are incorrect cause are not static but dynamic. The PB technically is a BUOB. That is more important are the informations that the chart M give us. The price make a DT with 2 BEOB at a very important R
Beyond the Candles