- Search Forex Factory
- 7 Results
-
 trader.joe replied Feb 21, 2016
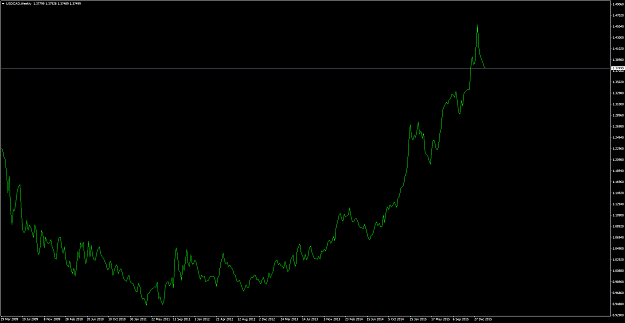
Let's look at USD/CAD. Oil is bottoming. USD/CAD has gone too far too fast. Let's look for shorts.
trader joes image
image
- trader.joe replied Feb 21, 2016
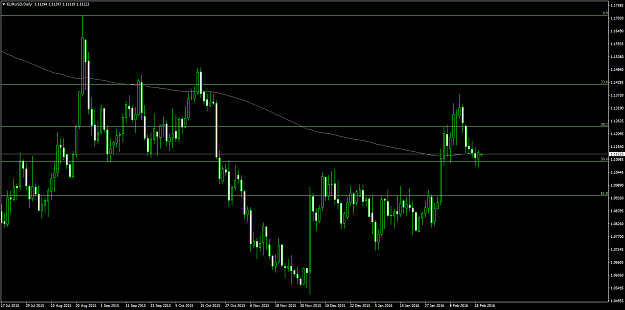
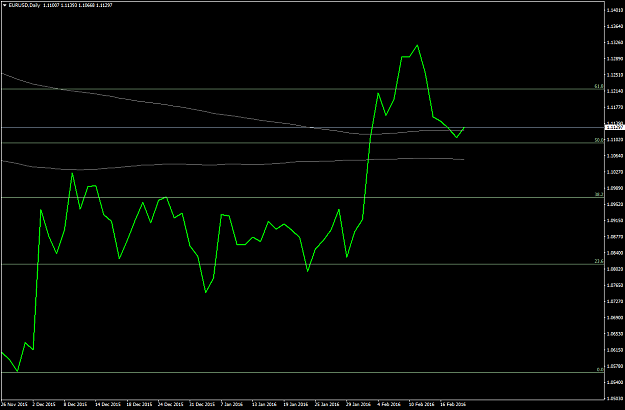
Enough line charts. Let's dig down even further. Price is bouncing off the .50 fib at 1.1098. Again, big boys are watching and using these same levels to trade and so will we. image Next we'll discuss some entry points.
trader joes
- trader.joe replied Feb 21, 2016
Let's dig down a bit more, but just a bit.
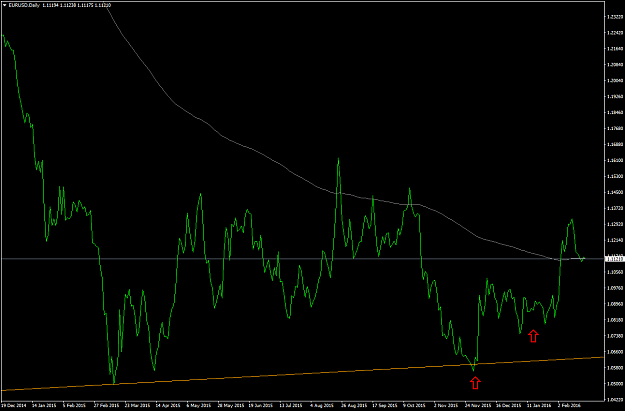
trader joes Sometimes your eyes deceive you and keep from seeing the simple things... Let's get focused. Price has pushed itself up through the 200 Day Moving average which the big boys use to determine the main ...
- trader.joe replied Feb 21, 2016
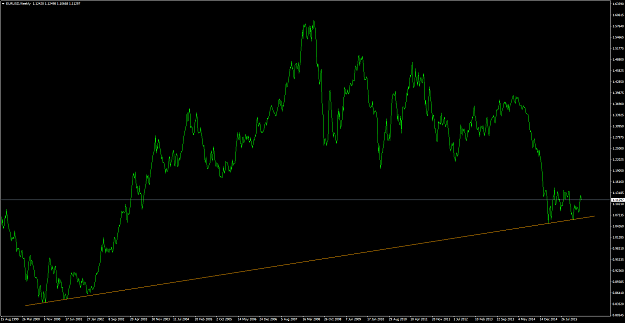
As I said, we are at a major turning point in the EUR/USD. The only other range larger than the only on the right is the left of the trade. Our bias is long! image
trader joes
- trader.joe replied Feb 21, 2016
Looking at EUR/USD. Let's get back to basics. Nothing says basics like a clear, long-term line chart. It's so easy to get caught up in the candles, short-term news and action, talking head analysts etc. Let them talk.... I trust what I see on my ...
trader joes
- trader.joe replied Feb 21, 2016
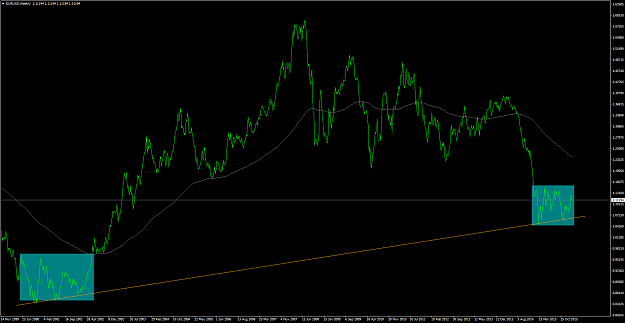
A weekly line chart for some top down viewing of what’s going on. Folks, the main trend from the beginning of the inception of the EUR is still intact. You have to go back to 2000-2001 to find price going sideways as long as it has been going now ...
EURUSD

- trader.joe replied Feb 19, 2016
Hello fellow EUR/USD traders, Boy, looks like it's time to go long no matter if you're are a scalper, swinger, singer...
EURUSD Price is finally giving some respect to that 200 MA and the 50 fib. level support. Times about the get interesting next week ...
- Posts by Member Search: 'trader.joe'