- Search Forex Factory
- 13 Results
-
 taxgeek replied Sep 23, 2010
Pretty much the same chart here using Absolute Fibonnaci. No monthly signals required. I suspect somewhere along the way those will cost. The red lines indicating confluence between multiple fractals (there are six of those) seems to be the biggest ...
Aboonacci System - for EUR/USD prediction
- taxgeek replied Jun 24, 2010
It's you. You've got to learn to "want what the market wants". When you do the losing will stop. Just quit and watch the charts a while until you understand what the above phrase means. Look at the chart for the last two months and ask yourself "why ...
Chaos Trading System
- taxgeek replied Jun 28, 2009
USDCAD — Hopefully some of you caught the nice up move on this pair. Started out with a wiseman (at the appropriate fibonacci fractal area, good angulation too, if you don't mind that kind of subjectivity). SAO came along about the right time ...
Chaos Trading System

- taxgeek replied Jan 15, 2009
Best thing on this is Robert Miner. His methodology is what I use. Basically you run a projection fib (for long grab the top of the wave and pull to the bottom) from wave say wave 4. Then look at the internal structure of wave 5 and find the minor ...
Chaos Trading System
- taxgeek replied Jan 10, 2009
I found the indi in my pile of largely useless stuff. Here's a chart with the averages unshifted. Left that way price rises above the alligator (cross the zero line) at the same time that AO crosses the zero line. After you put in the moving average ...
Chaos Trading System
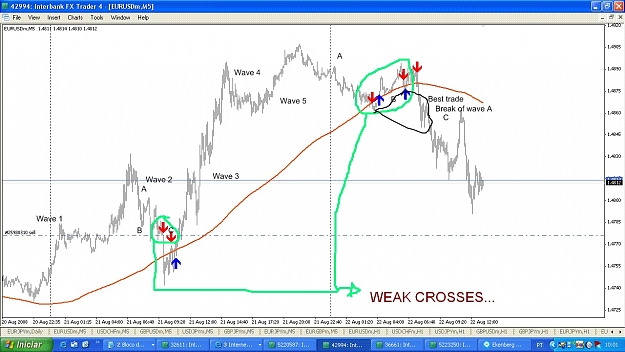
- taxgeek replied Aug 22, 2008
Simplest way is to be cognizant of market structure. Look at the classic Elliott wave structure laid out here. In both cases your bad trades are caused by trying to trade corrective waves. The appropriate place to trade is at the beginning of ...
Need help with my simple system
- taxgeek replied May 20, 2007
As Jacko says the way to find it is to look in the mirror. Trading is a matter of looking at the chart and internalizing it till it tells you its story, and then you trade with your gut. You really don't need a bunch of indicators for that, although ...
ideas on best indicator for daily chart
- taxgeek replied Apr 22, 2007
I would say that it's going down. Of course the best time to trade would have been many days ago, when the price first closed below the white line (50,.7 bollinger) on my chart. In recent days the price recoiled to the 25 ema (heavy light blue line) ...
BB on Steroids
- taxgeek replied Apr 13, 2007
I use the Cyrox, but just for reference. I look for the moving averages to be headed in the direction of the trade and fairly evenly spaced to demonstrate a strong long term trend. I then look for the price to come out a compression area and cross ...
CryoxMMA
- taxgeek replied Apr 3, 2007
I have jumped in occasionally for a few pips just using my regular method (mostly used longer term). Two bollingers (62,2 and 62,.7) and a few moving averages for reference. Just enter when price closes above or below the 62,.7 bollinger. If price ...
is it feasible to scalp gbpjpy?? how??

- taxgeek replied Jan 22, 2007
Filtered candles — For a really simple system that use the daily chart but doesn't necessarily trade daily, you might try filtering candlesticks with an indicator. This is an original idea. It comes from Greg Morris's book on candlesticks. He ...
who knows profitable daily system

- taxgeek replied Dec 15, 2006
If you have to work during prime trading hours, you can either settle for less action during quieter sessions or go to longer time frames 4hr or daily. Using the dailies only requires maybe thirty minutes per day of looking through your charts. A ...
New system needed
- taxgeek replied Sep 14, 2006
Thanks for sharing — I have been working on a daily system too. I find that, when I try to trade the intraday charts, I rush too much and make bad trades. I much prefer to check the charts at the end of the day and make a trade then. I've been ...
The Daily Fozzy Method

- Posts by Member Search: 'taxgeek'