- Search Forex Factory
- 38 Results
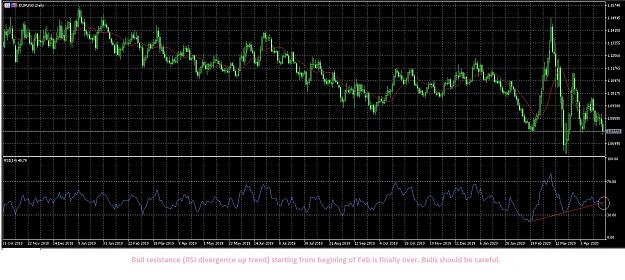
- shebalik replied Apr 23, 2020
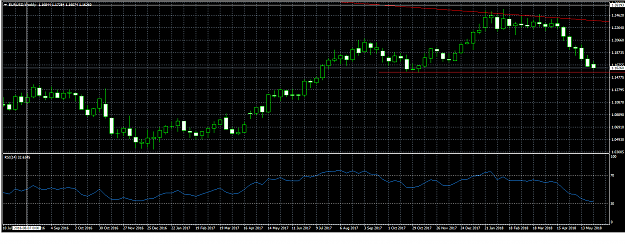
Bull resistance (RSI divergence up trend on daily chart) starting from beginning of Feb is finally over. Bulls should be careful.
EURUSD only
- shebalik replied Aug 14, 2018
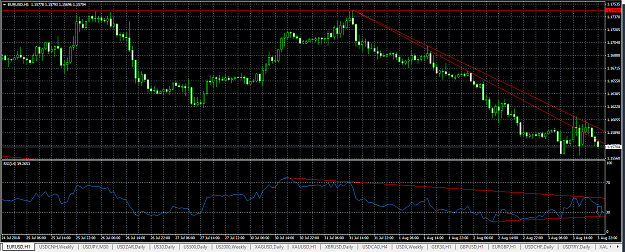
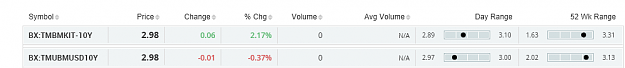
Hi All, Just wanted to point put that if daily RSI makes new low and goes below 21.30 (current value 22.15) as per the end of today or tomorrow then it won't be surprising to see 1.21x soon. Note that we have to see a day close below 21.30. Intraday ...
Cable Update (GBPUSD)
- shebalik replied Aug 8, 2018
Thanks Ata for the warning. Tough I didn't see it on time, just arrived home. That was an intraday attempt with target 1.1565. In attached chart yellow one is the channel. I was expecting to close it from bottom of yellow channel. But looks like it ...
EURUSD only
- shebalik replied Aug 6, 2018
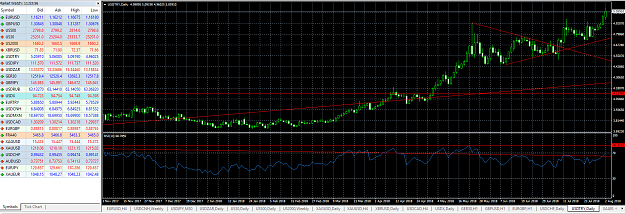
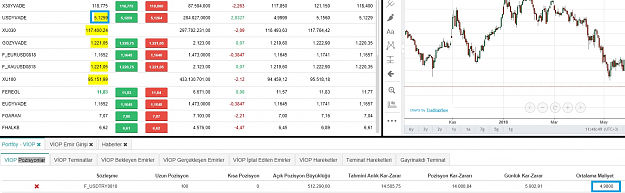
Hi All, Above plan was mentioned with below graphic when the pair was 5.05. 2000 pips from there so far. 5.25 target achieved but RSI is still 76, few points below my 80 target. It can go more, but I don't wanna risk anymore. Since USDTRY futures ...
USD/TRY
- shebalik replied Aug 3, 2018
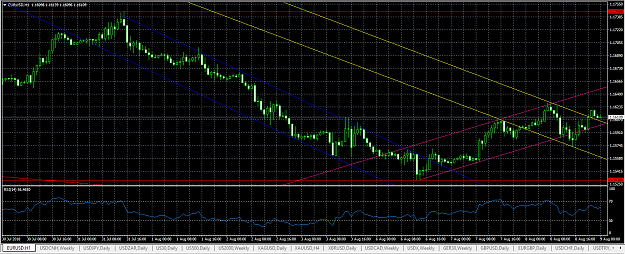
Hourly graph that I mentioned before. We were stuck between two TLs. Finally we are below the bottom TL line. Bears are happy. If we check RSI, upper TL nicely resisted. We are targeting the bottom TL, roughly around 1.1530.
EURUSD only
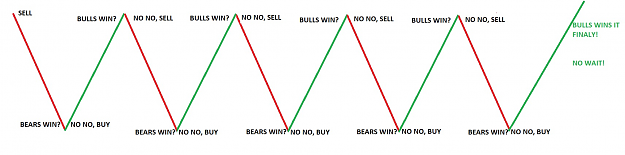
- shebalik replied Aug 3, 2018
Game of Traders! Winter is coming. That bull looks like he survives. But white walkers (dead polar bears) are on the way.
EURUSD only

- shebalik replied Aug 3, 2018
I wouldn't say "folded". USD is doing strongest weekly close since a year. Still not far from 95.000
EURUSD only
- shebalik replied Aug 3, 2018
There is an extra weakness in Euro. It may be related with Italian bonds rising again.
EURUSD only
- shebalik replied Aug 2, 2018
As you see in the chart, previous RSI top was 81.3. We are now close to 70. I am expecting at least to hit RSI 80. That is approximately equal to 5.25. Edit: I won't wait for 5.25. When Daily RSI hit 80 I will take profit.
USD/TRY

- shebalik replied Aug 2, 2018
I opened two days back 500 lots in USDTRY futures. Cost 4.9800. Closed 400 lots from 5.1100. Holding still 100 lots for possible 5.3200 (equal to 5.2500 spot)
USD/TRY
- shebalik replied Jul 26, 2018
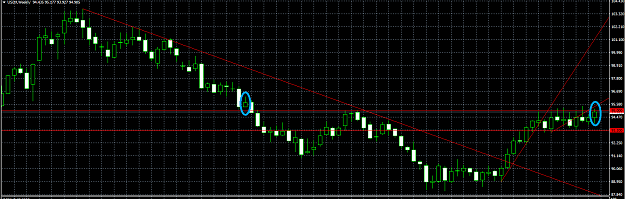
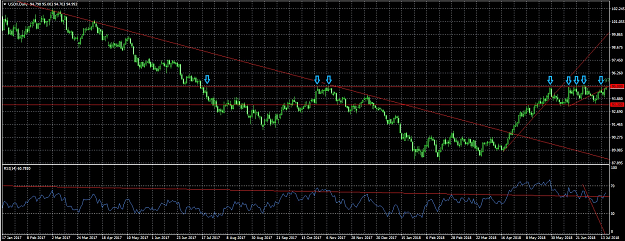
Attaching Daily US Dollar Index graph. It's been 50 market days now. No closing candle below 93.300 or above 95.000. We are stuck in between the two red lines.
EURUSD only
- shebalik replied Jul 18, 2018
Hi All. Attached is the Dollar Index graphic. I don't say that it will brake today. But we are talking about a resistance (95) that is not broken 8 times. This is 9th times we try. If it gets broken it's not gonna be like previous moves. It will be ...
EURUSD only
- shebalik replied May 28, 2018
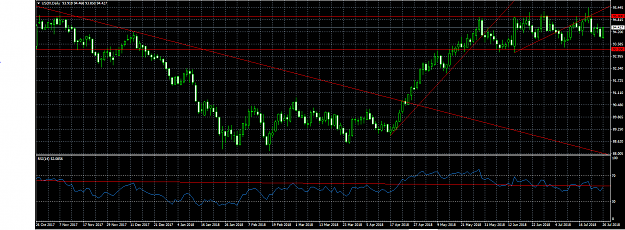
As you see in weekly graphic, the last bar is too short comparing with the harmony of other bars. 1.1550 is inevitable for this week. We may bounce from this level but definitely we will touch it till Friday.
EURUSD only
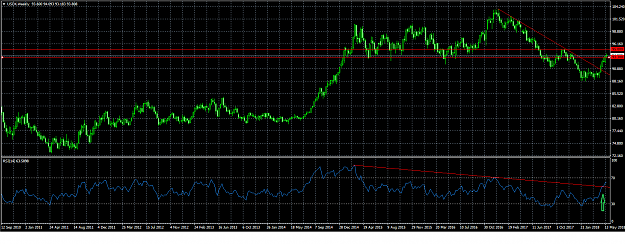
- shebalik replied May 23, 2018
No sign of weakness in weekly dollar index graphic. We shall try to hit 95.000 this week or next week..
EURUSD only
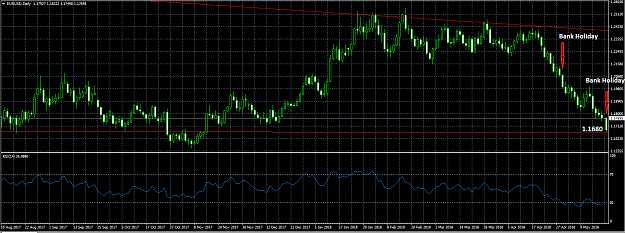
- shebalik replied May 20, 2018
My expectation for tomorrow: Dow trend continues. Another Europe Bank Holiday as in May 1st. A drop with low volume to 1.1680. Happy Sunday all!
EURUSD only
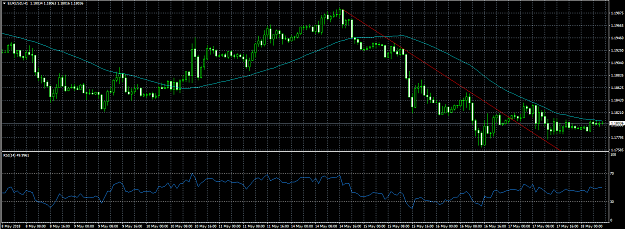
- shebalik replied May 18, 2018
As long as we are below 50 MA in hourly graphic (blue line) I am still bearish on this one.
EURUSD only
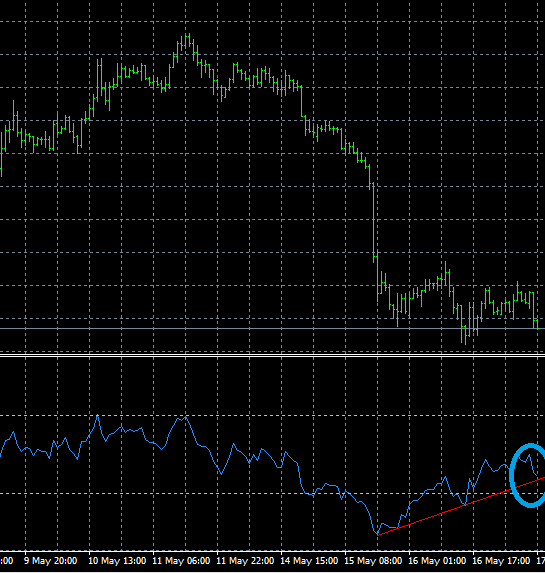
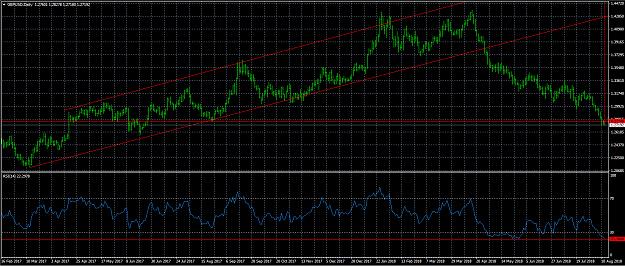
- shebalik replied May 17, 2018
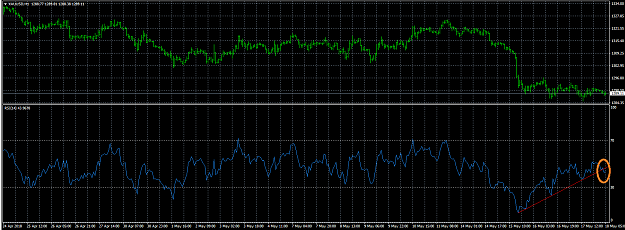
RSI trend line is finally broken. I would expect a fall till 1275 at least.
XAU/USD & XAG/USD - Gold & Silver Traders Thread
- shebalik replied May 17, 2018
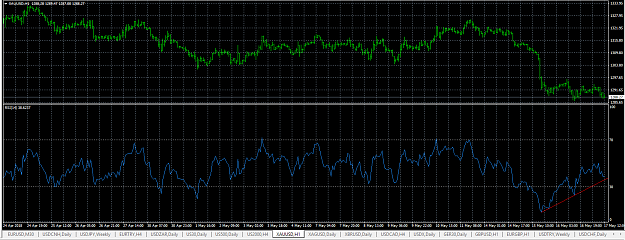
Last update: Still no break out!
XAU/USD & XAG/USD - Gold & Silver Traders Thread
- shebalik replied May 17, 2018
My new study about sharp divergence trend braking. If the RSI goes below that line we will see a very sharp drop. This is hourly graphic. So the fall will be sharp but not too dramatic. If it happens in weekly graphic (which is not the case here) ...
XAU/USD & XAG/USD - Gold & Silver Traders Thread