- Search Forex Factory
- 14 Results
- shawn3245 replied Oct 16, 2012
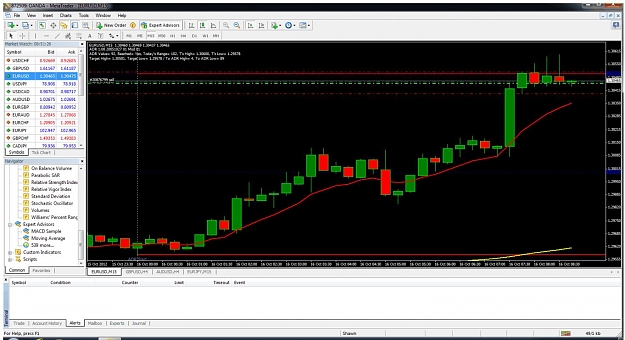
Good morning all, I have a question for the masters of the board. I just turned on my computer and noticed that the ADR in the EU on the 15 min chart has been reached. After watching the video posted here last night it seems that the ADR acts like a ...
Another simple system - Time-Frame 15
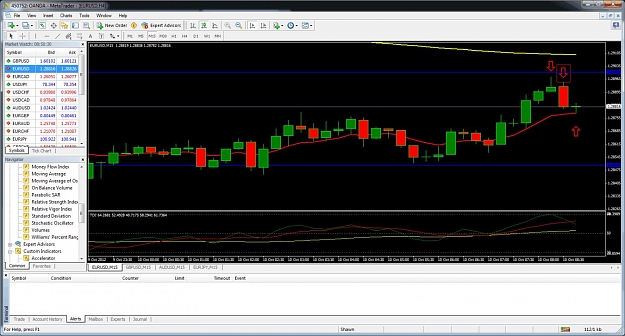
- shawn3245 replied Oct 15, 2012
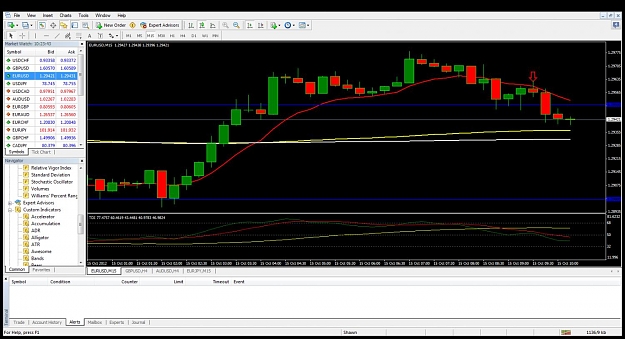
Good morning all, I short three lots this morning for a total of 13 pips. I took the trades using only the 15 min chart today. I took the shorts at the red arrow after seeing the green candle before this one couldnt close about the 10 EMA and that ...
Another simple system - Time-Frame 15
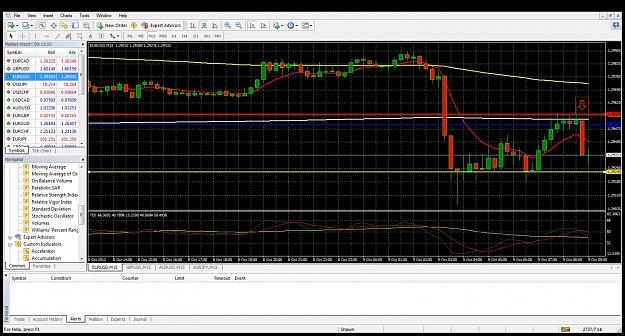
- shawn3245 replied Oct 10, 2012
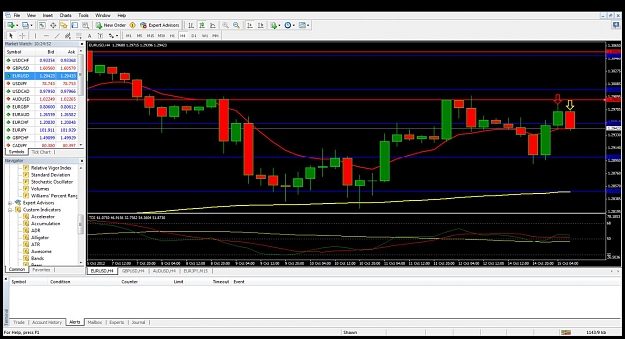
quick trtade before the NYO — Good morning everyone. Here is my quick trade before the NYO with charts attached. Here are the reasons for the trades. Looked at the 4h EU chart and saw that the PA went up and touched the 10 EMA but didnt get ...
Another simple system - Time-Frame 15
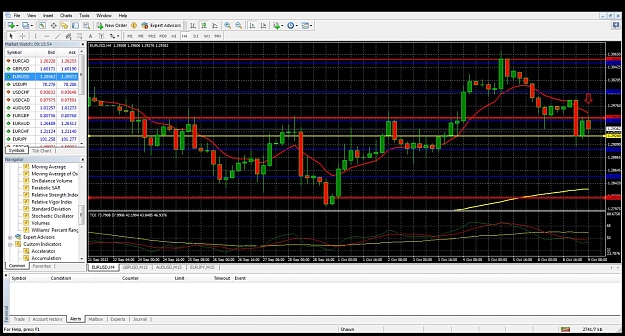
- shawn3245 replied Oct 9, 2012
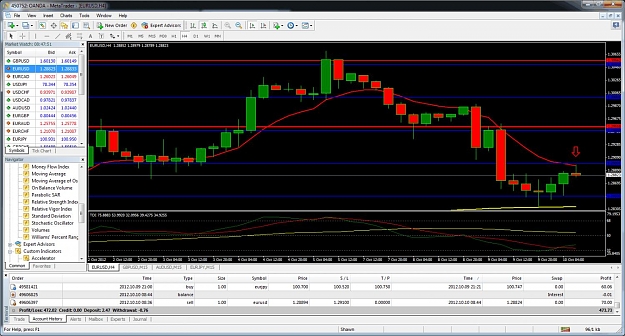
As I said once I was back to looking at charts and trading I would be posting my charts. Posting charts does two different things. First it helps others and secondly it keeps us honest with our tradings. I took think trade about 15 mins ago before ...
Another simple system - Time-Frame 15
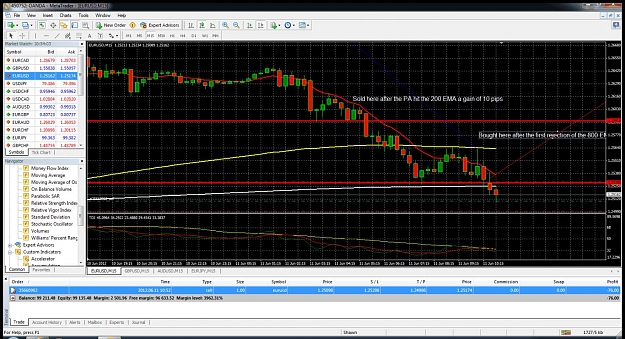
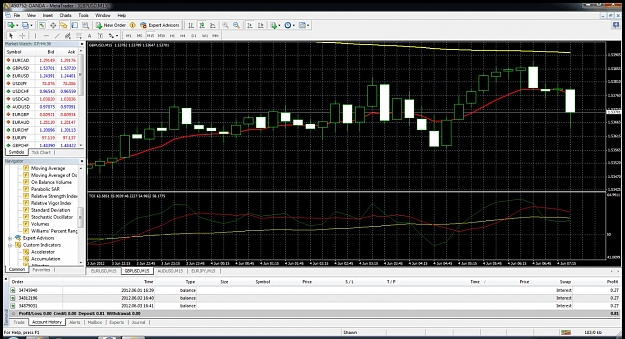
- shawn3245 replied Jun 11, 2012
here is a chart of my trades. Currently short after a candle close below the 800 EMA. We will see how that trade works out because the SL is just above the 800 EMA and a resistance line. So far Ive had a pretty good day except for the two trades ...
Another simple system - Time-Frame 15
- shawn3245 replied Jun 7, 2012
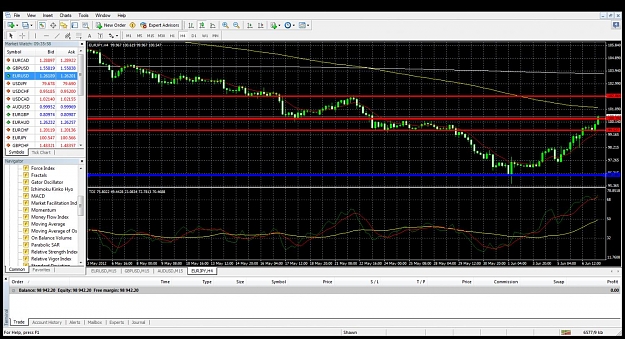
Ok Here is why the EJ is going lower soon. As per the 4 hour chart the TDI is over 68 which is screeming sell. Another sign is that the PA is sitting right at the resistance level which isnt a good sign to continue higher. Another signal that is ...
Another simple system - Time-Frame 15
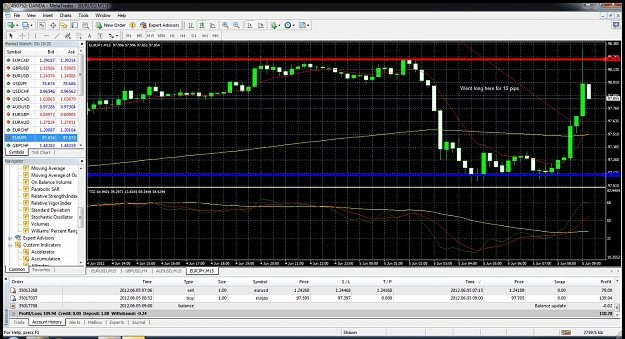
- shawn3245 replied Jun 7, 2012
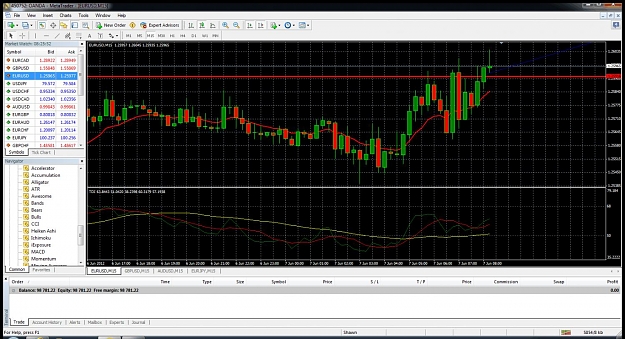
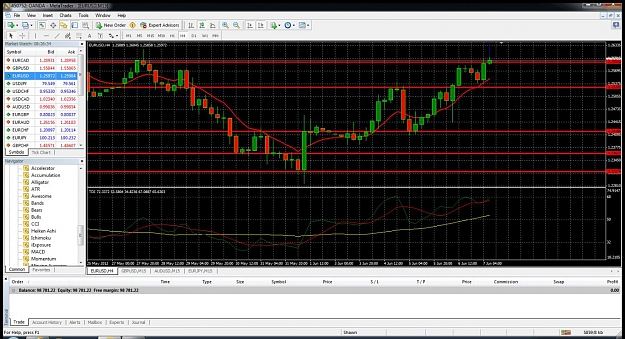
Good morning people, As per your request Pat I have uploaded two charts. I went long EU for a quick 10 pips this morning. The reason for this was that the price broke through one of the resistance levels and the TDI was giving a buy signal. I bought ...
Another simple system - Time-Frame 15
- shawn3245 replied Jun 6, 2012
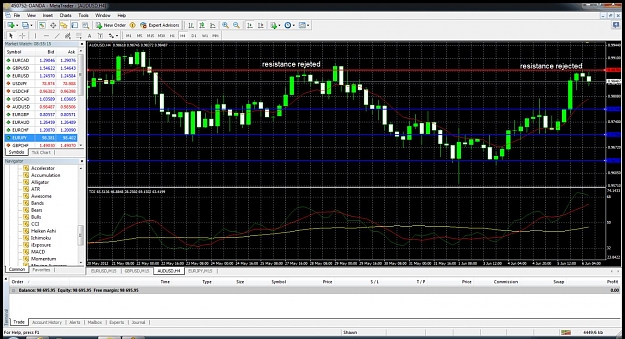
I was looking at a 4h AU chart which I have attached. Looked like the resistance level has been rejected which would be a sign to short after the TDI gives the signal. I hope that Im looking at this right Shawn
Another simple system - Time-Frame 15
- shawn3245 replied Jun 5, 2012
Took a long on the EJ for a quick 10 pips. Still learning the system and with all the news floating around I didnt want to stick around a long time in the trade. Two trades this morning for a total of 20 pips. Still trading with a practice account. ...
Another simple system - Time-Frame 15
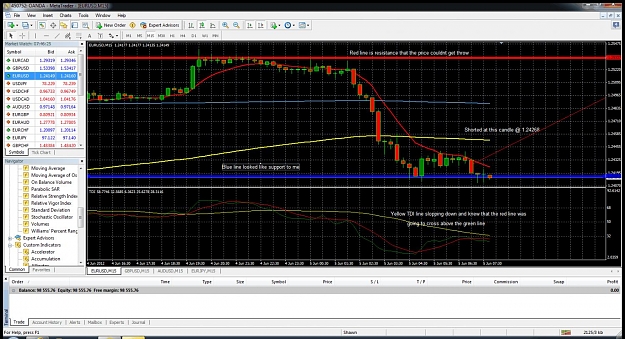
- shawn3245 replied Jun 5, 2012
This was a trade that I took this morning for a quick 10 pips. The reason for the short was because the price was below the 10EMA and the yellow TDI line was slopping down. The red TDI line looked like it was going to cross above the green TDI ...
Another simple system - Time-Frame 15
- shawn3245 replied Jun 4, 2012
Here is a pic of the chart that I was looking at. The reasoning for the short was because the price dropped below the 10 movinge average and the yellow TDI line was slopping down. Shawn
Another simple system - Time-Frame 15
- shawn3245 replied May 15, 2012
OK I was using the daily chart and this is what I came up with for support and resistance areas. Please advise if Im looking at this correctly. I think this is correct. I remembered from reading some place that a line chart is the best ways to pick ...
EurCad Analysis and Trading Ideas
- shawn3245 replied May 15, 2012
Here is a chart with all the resistance/support line that HDA was talking about if I have them correct. I got all the levels from the following website. url I hope that helps everyone. I will be studying this to see how to make this work! Shawn
EurCad Analysis and Trading Ideas
- shawn3245 replied May 14, 2012
I tried to attach the chart that Im talking about Im not sure if it worked or not. I dont have a clue how to post the charts in the replies like you have been doing. The yellow line that Im referring to is the yellow line of the TDI. Thanks Shawn
Another simple system - Time-Frame 15
- Posts by Member Search: 'shawn3245'