- Search Forex Factory
- 256 Results (1 Thread , 255 Replies )
-
 rudy5 replied Jan 25, 2024
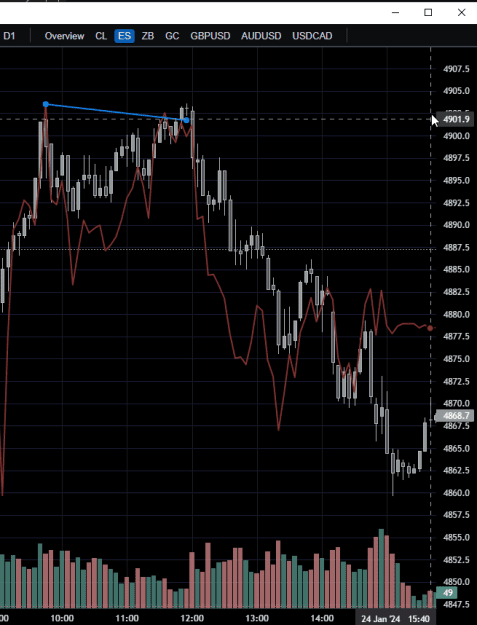
yesterday ES at top edge with everything else weak or already falling. image divergence showing up at the same time on ES value. 177 tick drop. image Been seeing an average of one of these setups a day this week.
dolla dolla bills ya'll
- rudy5 replied Jan 25, 2024
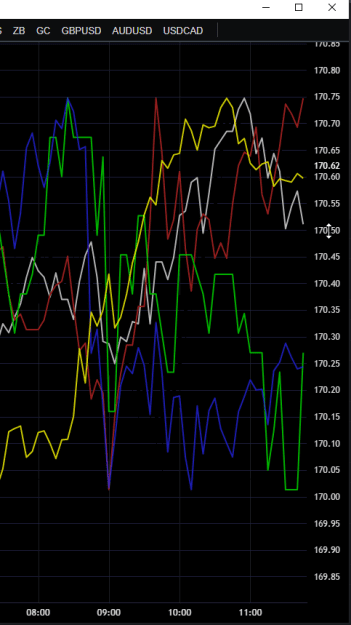
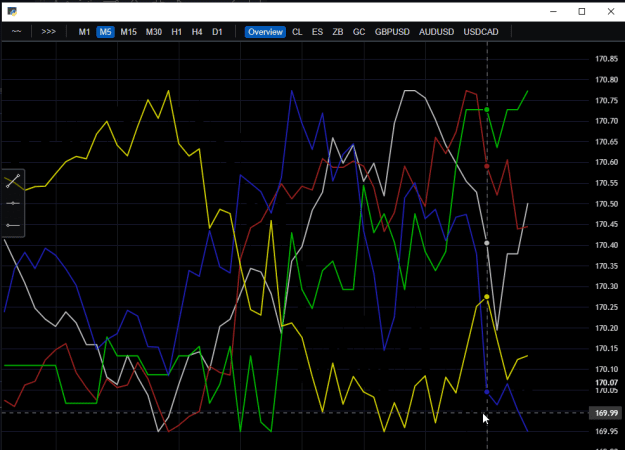
Have my own custom charting solution now leveraging TradingViews open source lib. I can do basically whatever I want now ie plot SR levels automatically and display custom data. image market overview with es, cl, ABCs, 2s10s, commodity risk. ...
dolla dolla bills ya'll
- rudy5 replied Oct 29, 2021
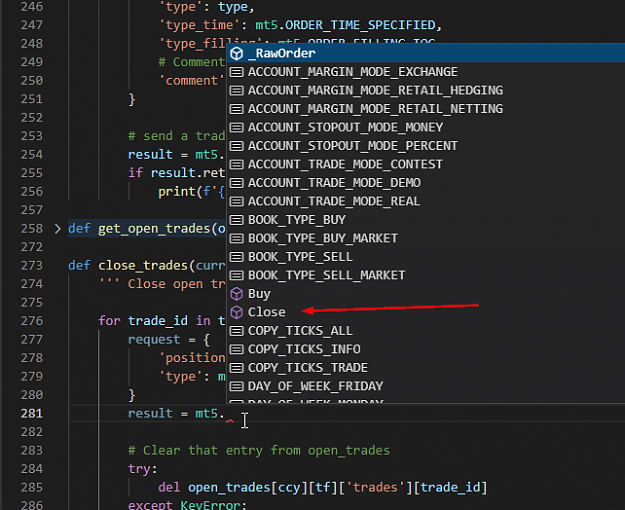
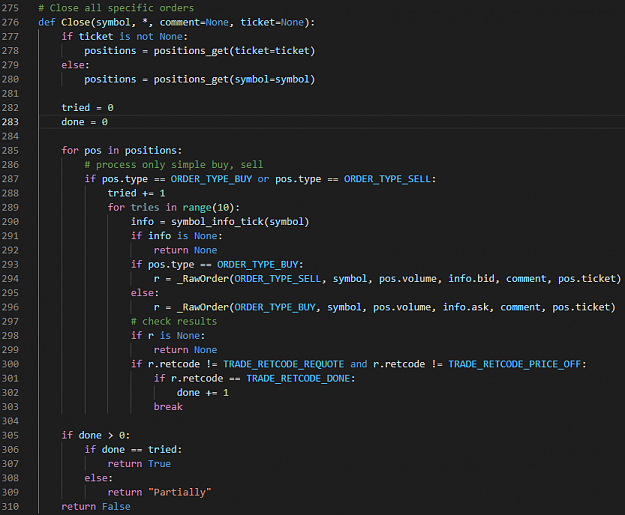
I was scrolling thru the options that pop up if you type "mt5." and it looks like maybe I can just call "mt5.Close" image I can't test it now that its the weekend but it looks like if I just pass the symbol and ticket everything else will be ...
Metatrader5 and Python
- rudy5 replied Oct 6, 2021
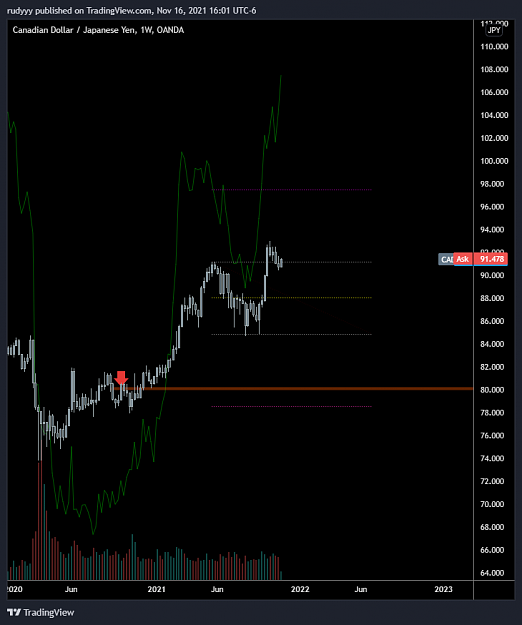
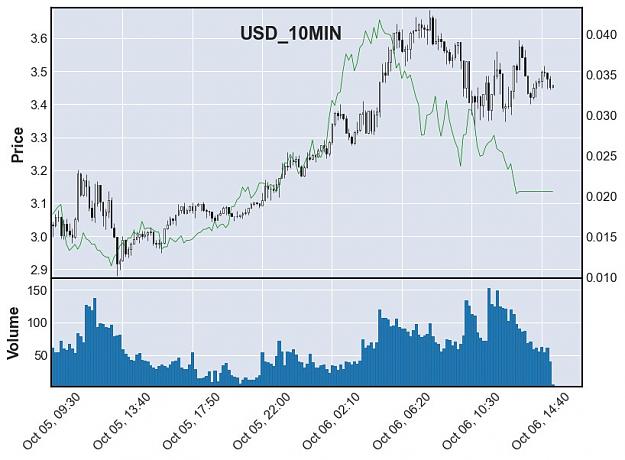
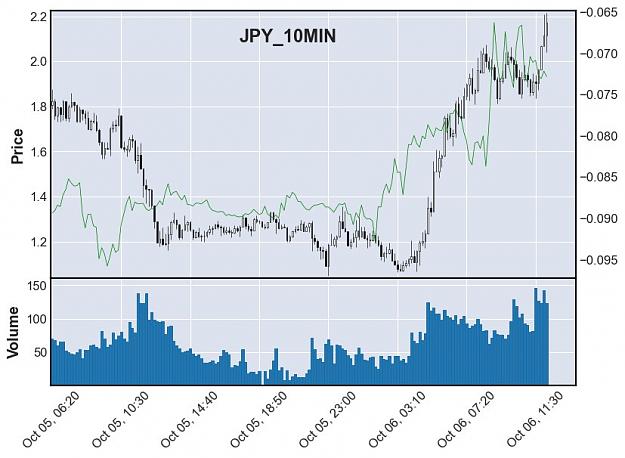
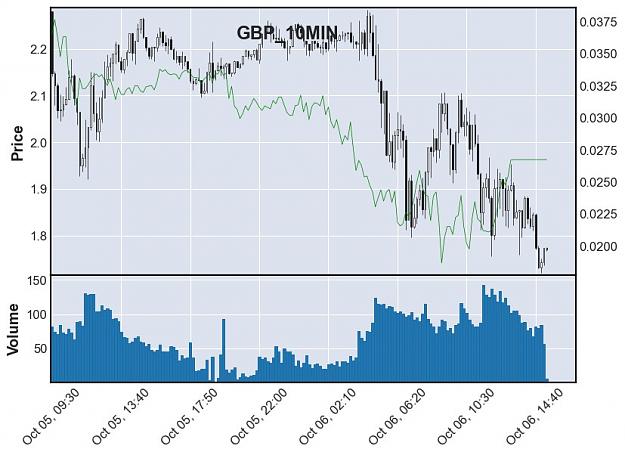
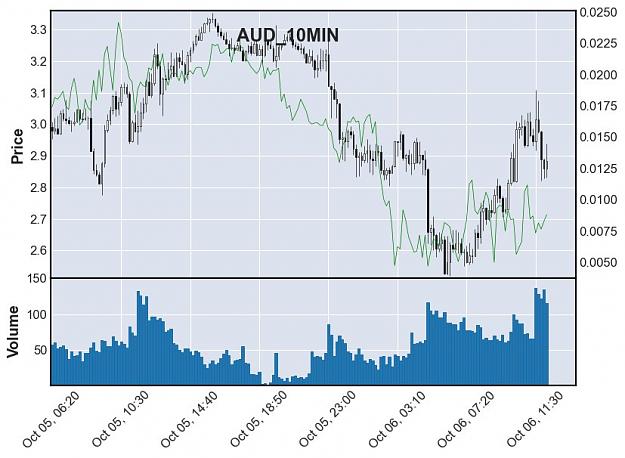
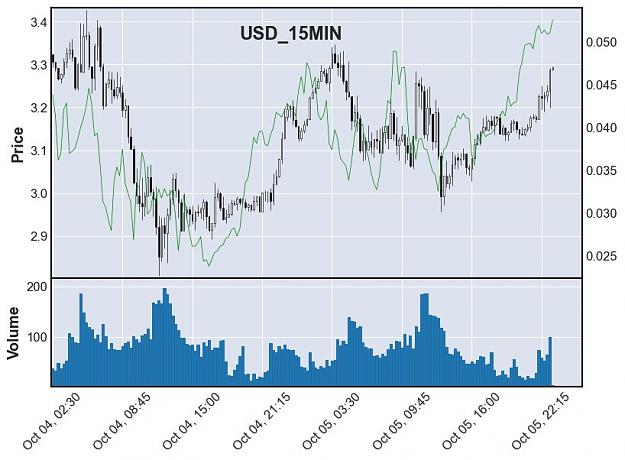
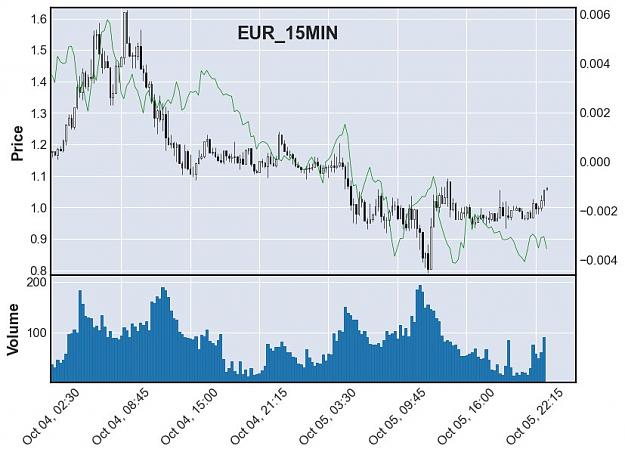
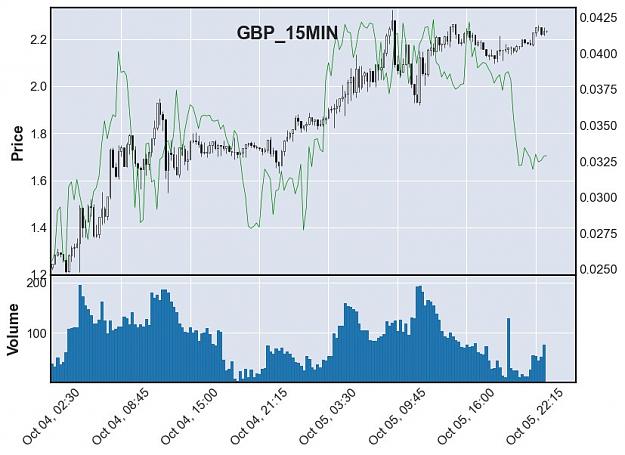
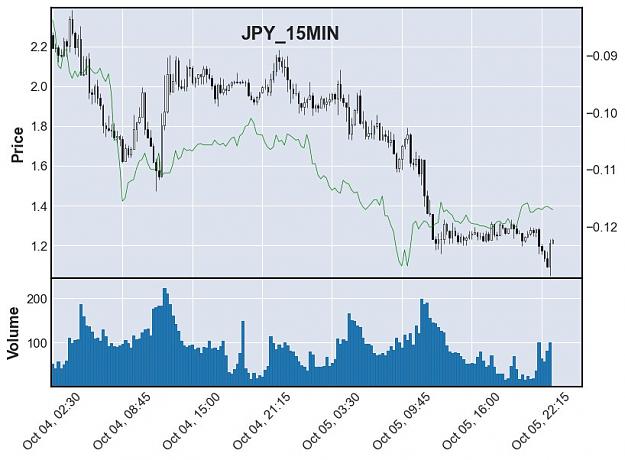
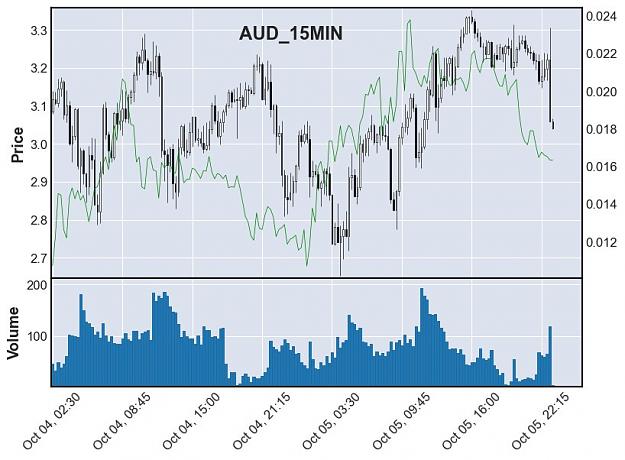
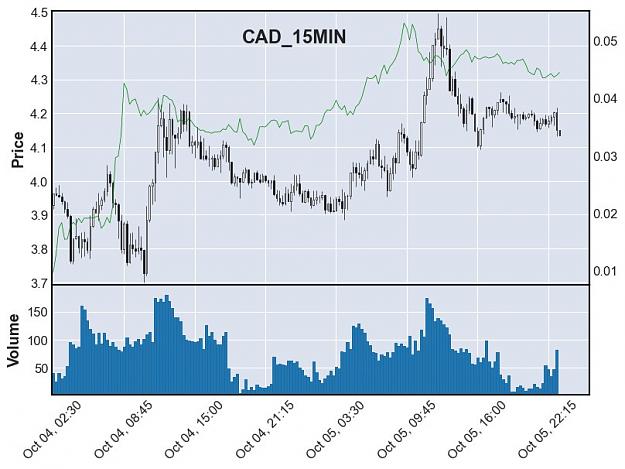
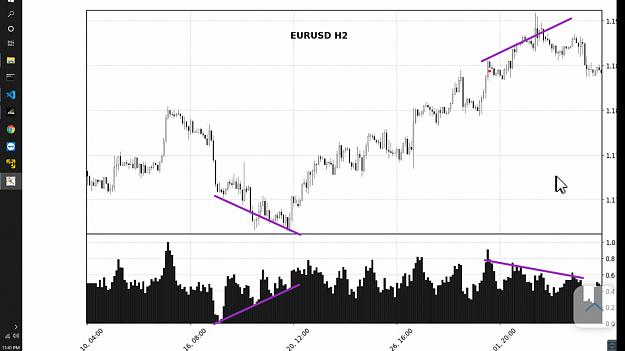
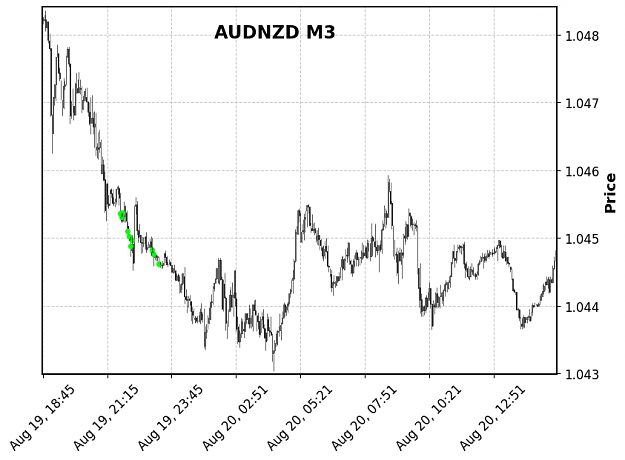
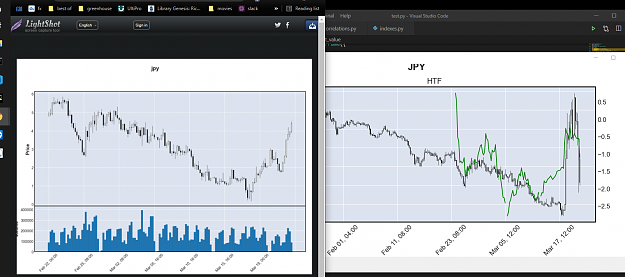
The green line from the correlation scanner is designed to lead price and its really been doing an amazing job overall image image image image image image
dolla dolla bills ya'll
- rudy5 replied Oct 3, 2021
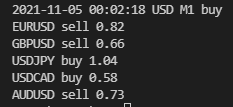
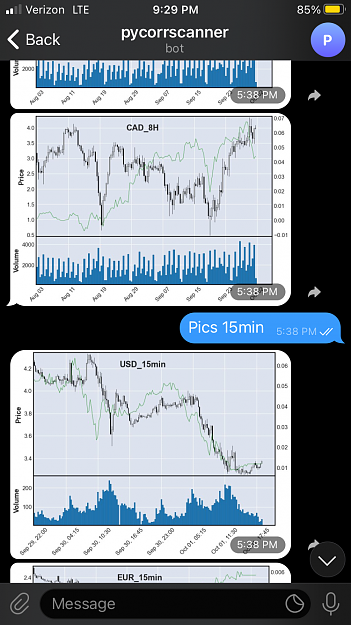
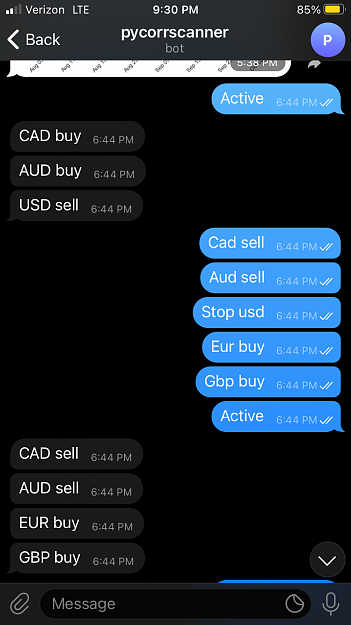
I’ve reached a new milestone. I now have some automation through telegram commands, such as sending pictures of custom charts image controlling which currencies to trade, in which direction, and for how long (defaults 24hrs). image My bot reads ...
dolla dolla bills ya'll
- rudy5 replied Sep 14, 2021
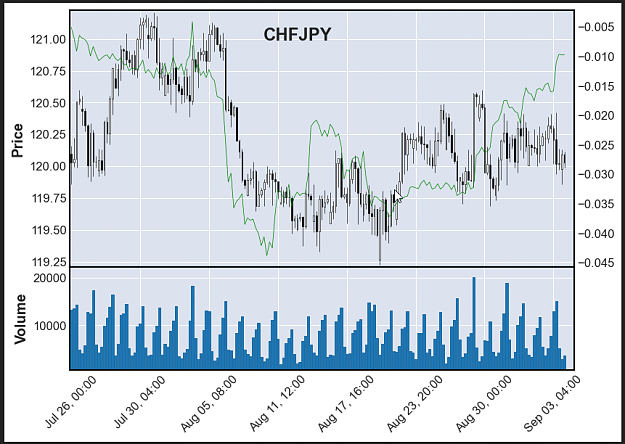
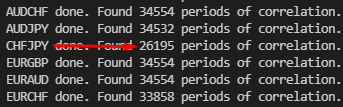
Went back to look at my correlation scanner recently because it just seemed like something was off. Sure enough, I was missing this tiny logic piece (literally 2 lines of code). Adding it made a serious improvement. chfjpy used to be one of my worse ...
dolla dolla bills ya'll
- rudy5 replied Sep 8, 2021
I want an even more general approach. Just a simple directional scoring mechanism that can be applied to all timeframes, where the score of each time frame becomes part of a spectrum of scores, and the continuity of similar scores across that ...
dolla dolla bills ya'll
- rudy5 replied Aug 21, 2021
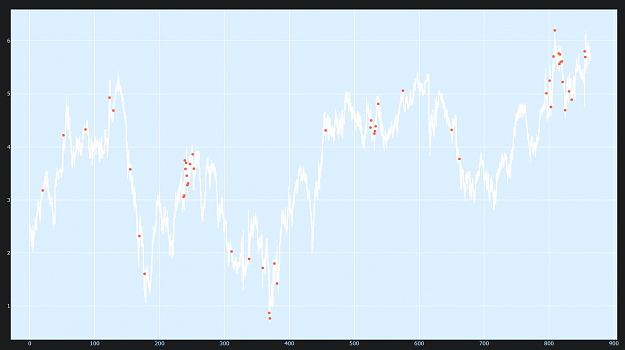
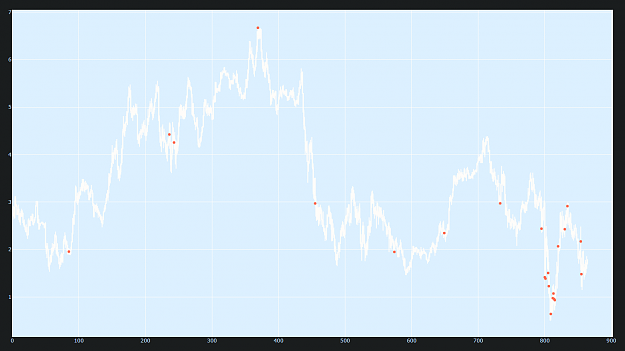
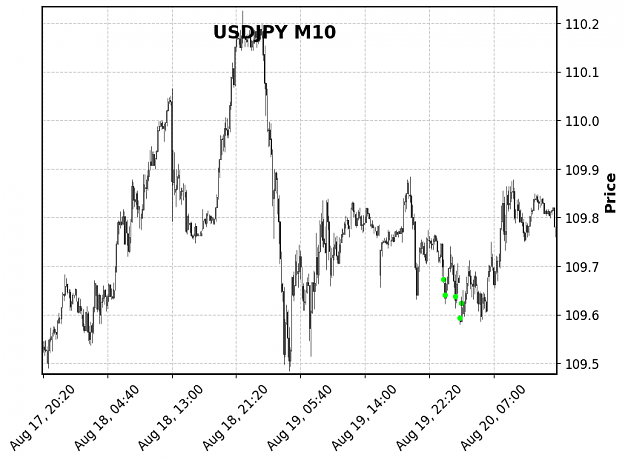
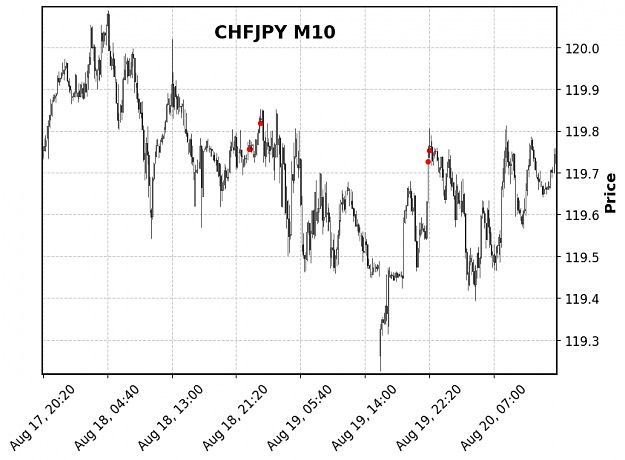
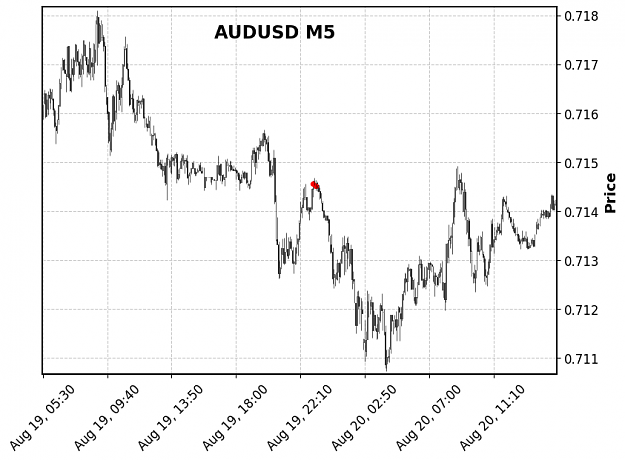
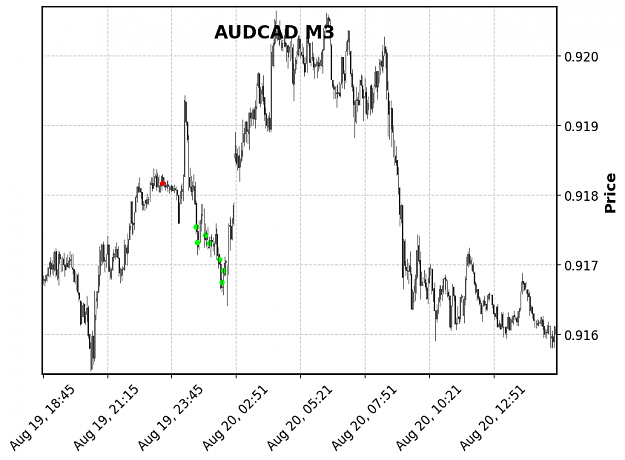
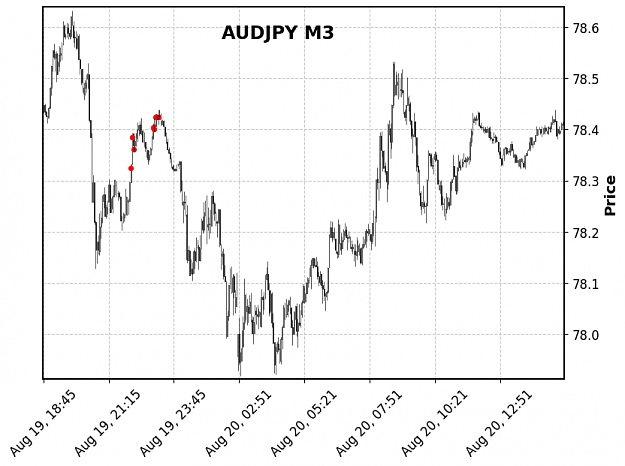
Some recent entry signals image image image image image image
dolla dolla bills ya'll
- rudy5 replied Aug 9, 2021
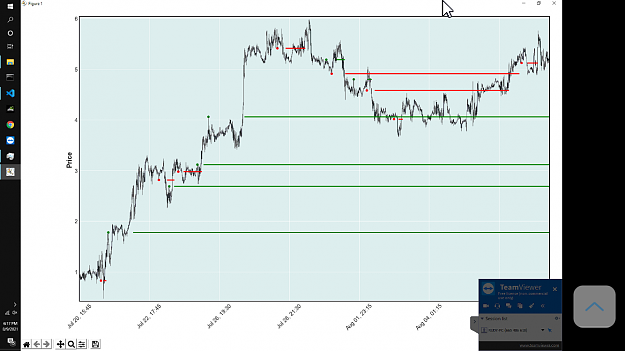
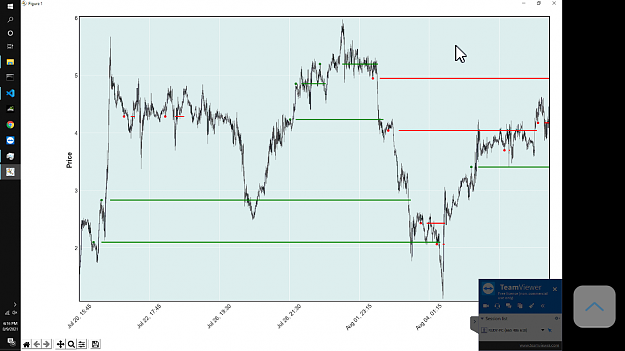
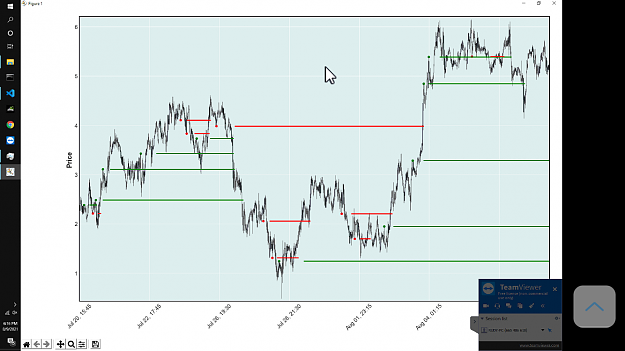
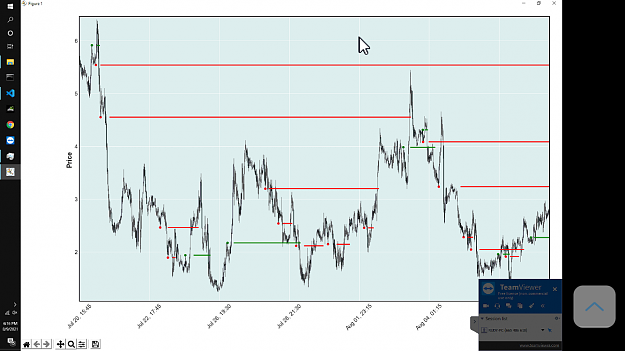
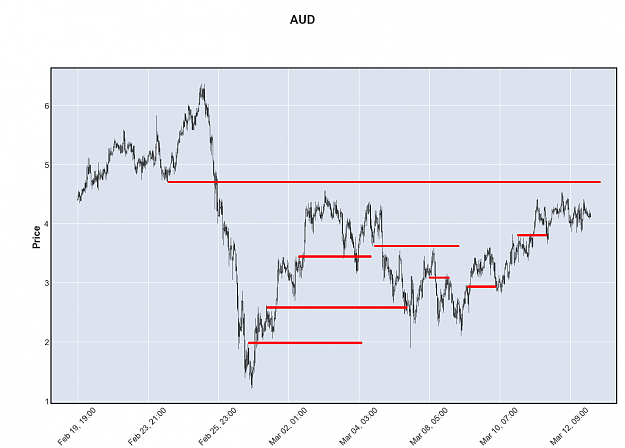
Coded this type of SR level finally. I think it turned out pretty well. im using it on the index charts to activate trade scanning on actual pairs. So like if the JPY index gets within range of a sell level on the H1 chart, all JPY pairs will start ...
dolla dolla bills ya'll

- rudy5 replied May 2, 2021
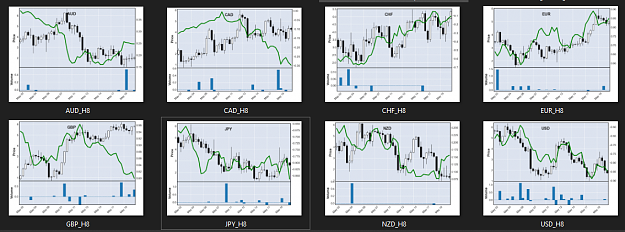
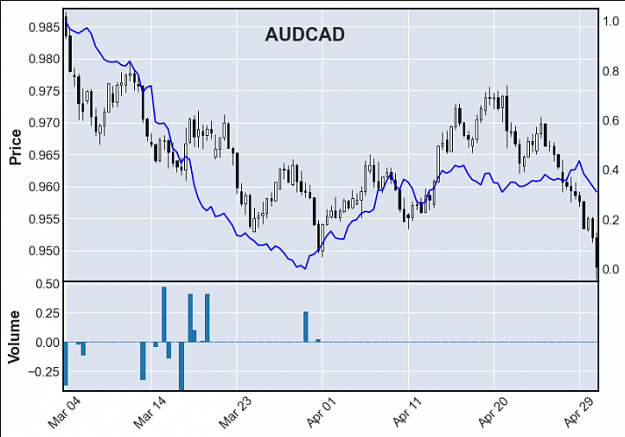
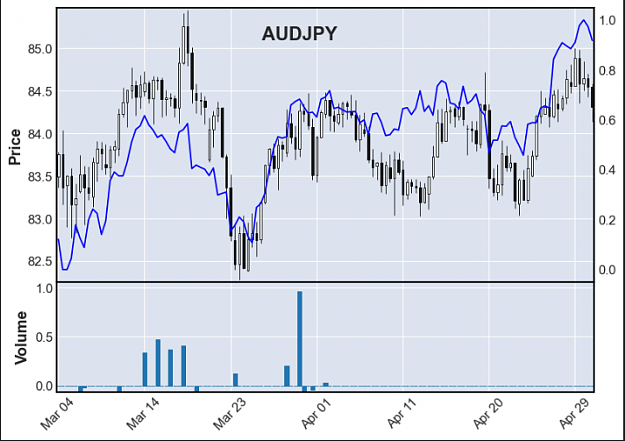
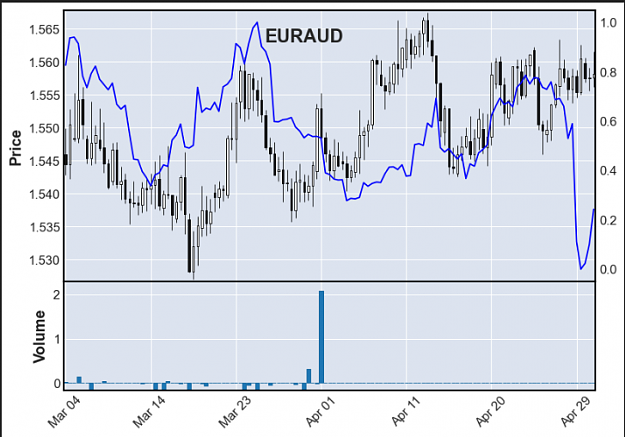
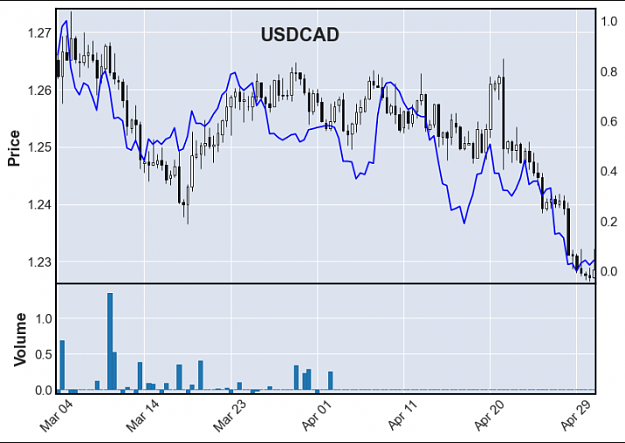
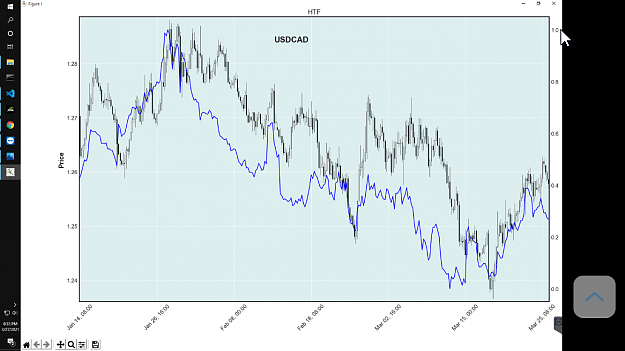
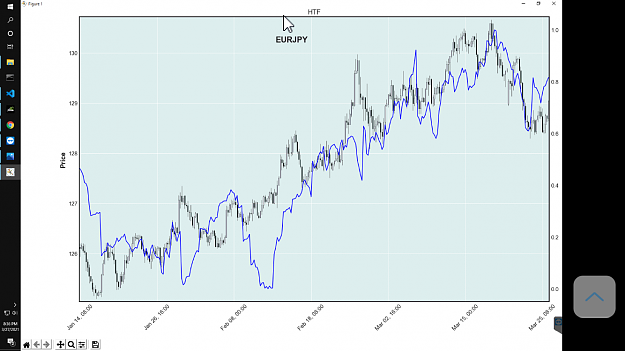
I never posted charts showing the result of my correlation scanner which, out of everything I've done so far, is probably the most usable tool. the blue line is the average close of other markets which are currently correlated to the shown ...
dolla dolla bills ya'll
- rudy5 replied Mar 28, 2021
Sending the raw tick data to mt4 sounds nice. I was normalizing before combining in order to get equal weighted baskets (ATR normalized). However I suppose an ATR based weight could be applied within mt4. I opened one of your old GitHub links to see ...
Index Charts
- rudy5 replied Mar 24, 2021
it seems the main issue with the index charts is the normalization period. I figured I could build a database of 1min candles by querying a few days worth of tick data each time and appending the new row(s) to the database. I knew it would be a bit ...
Index Charts
- rudy5 replied Mar 10, 2021
Scanning for abnormal volume. I’m thinking there’s a better way to filter for these that I’ll get to later. This was ok for a first view
dolla dolla bills ya'll