- Search Forex Factory
- 15 Results
- ragnakore replied Jan 24, 2012
AUDx turned red for the week. Laguerre is turning over. MACD is red as well. USDx has bounced from its monthly support. wonder if AUDUSD is a good sell from here on in? AUDUSD @ 1.0465 is kinda very near strong support 1.0450
Long Term CICR (Cross index currency referance) trading
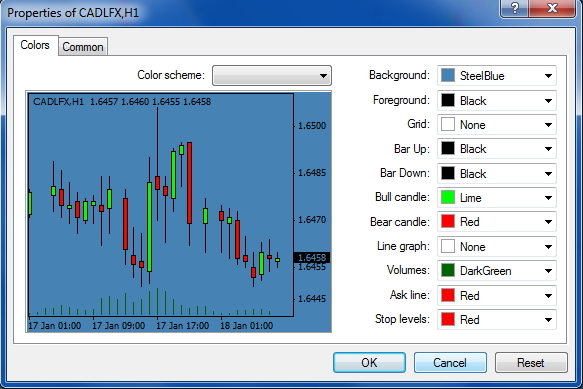
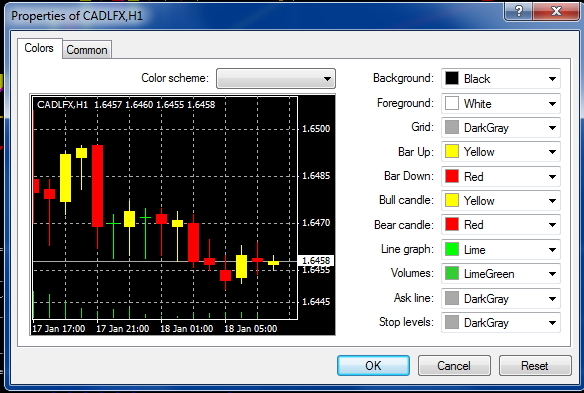
- ragnakore replied Jan 18, 2012
I just changed the color preference as shown.
Long Term CICR (Cross index currency referance) trading
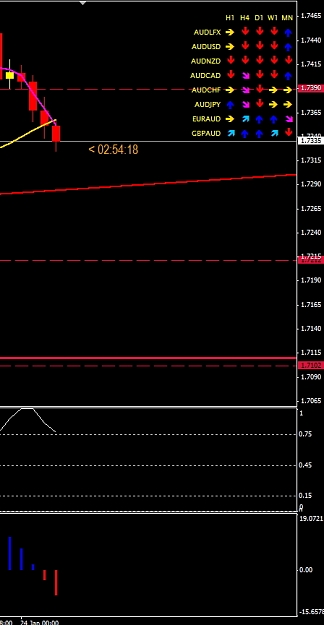
- ragnakore replied Jan 17, 2012
Now you see it, now you dont — Something is wrong with LiteForex's Currency Index. The last candle disappears periodically! This is disturbing; it ruins the study. Take a look, there was a bullish last candle and then the next second, it is ...
Long Term CICR (Cross index currency referance) trading
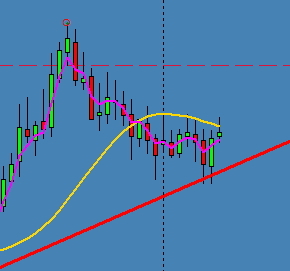
- ragnakore replied Jan 16, 2012
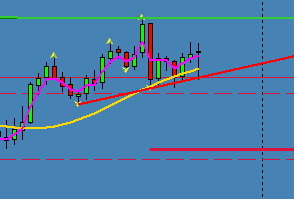
I used to use a Mouteki/Demark Trendline Indicator on H1 candles to get out of the H4 candle pattern formation problem. (PS. I use Mouteki/Demark with 8 candles on H1 instead of 2 candles for H4) And as shown, AUDx is 2 bullish candles since 10AM ...
Long Term CICR (Cross index currency referance) trading

- ragnakore replied Jan 13, 2012
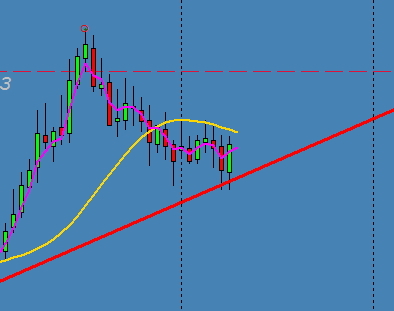
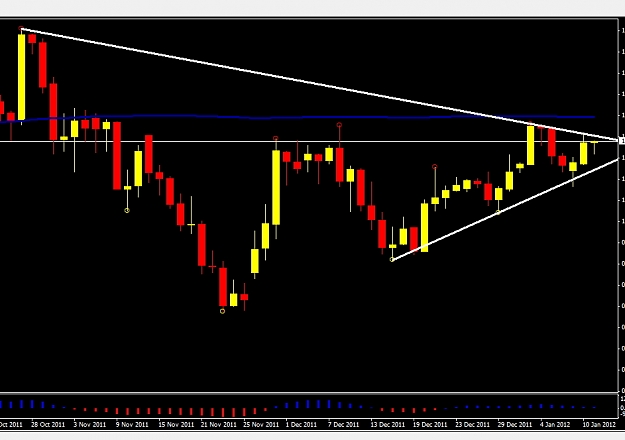
Reviewing CICR and AUDX (H4 chart below), I am not comfortable/confident that I should be shorting AUD just yet. AUDX is showing bounce off support lines (Yellow and Red lines) suggesting AUD is very supported. The drop we saw just a few hours ago ...
AUD/USD
- ragnakore replied Jan 13, 2012
DK. In this AUDX, do you agree with me that it failed to break down as shown by the bounce off the yellow Filterline and bounce off the red trend line? What do you call that Green and Red trendlines? Looks very much the Mouteki Trend lines... Supply ...
Long Term CICR (Cross index currency referance) trading

- ragnakore replied Jan 13, 2012
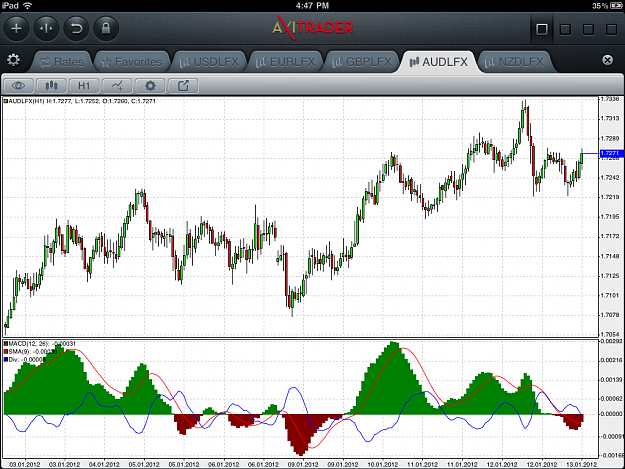
AxiTrader iPad platform is the latest among xogee iPad MT4 broker apps. this version can can put indicators and have multiple panels/windows making organization of charts easy. I managed to hack that platform to connect to LiteForex instead and I ...
Long Term CICR (Cross index currency referance) trading
- ragnakore replied Jan 12, 2012
Dyekid, Looking at this AUDindex, it is suggesting AUD is about to fall?
Long Term CICR (Cross index currency referance) trading

- ragnakore replied Jan 11, 2012
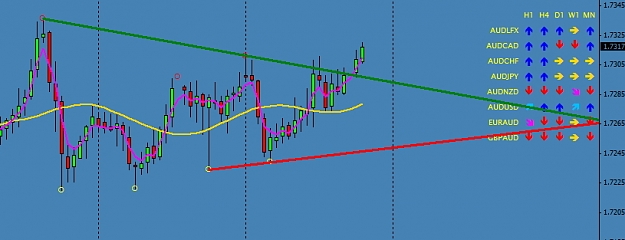
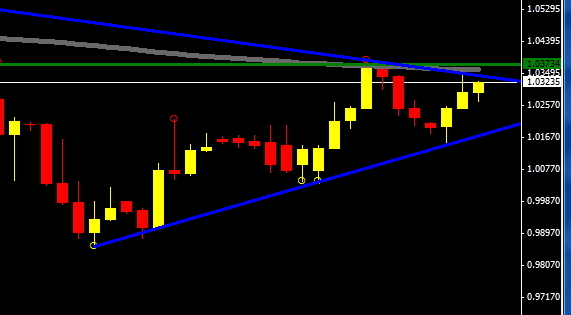
aye! Depending on the broker I use, I indeed see the 200SMA (gray line) around 1.0360. Another study is this wedge. Higher Lows on the Daily Candles. Tempting to break the 1.0360~1.0380 level (green line). Arg.. From this chart, SHORT may not be a ...
AUD/USD
- ragnakore replied Jan 11, 2012
From this chart, it appears that there is a channel resistance somewhere around 1.0340~1.0360. The bottom of the channel is around 1.0210~1.0180 area. correction: I would therefore, wait to short if it fails to break the upper trendline preferably ...
AUD/USD
- ragnakore replied Dec 19, 2011
Declining Wedge forming on 5M with 0.9920s as baseline suggestive of imminent drop (good only for scalping).
AUD/USD

- ragnakore replied Nov 24, 2011
either temptation or sleepiness will win over me... havent had decent sleep in days. was wanting to get good sleep today then all these.. not that im complaining... stupid thing happened earlier too.. I was testing an EA when all of a sudden it ...
AUD/USD
- ragnakore replied Nov 23, 2011
The past 2 weeks is really ballistic!
AUD/USD
 I re-entered at 0.9725... not really too patient about it though as 0.9725~0.9700 is a support.
- ragnakore replied Apr 15, 2009
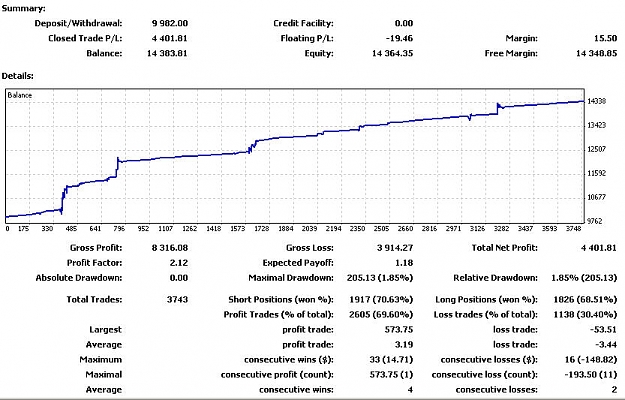
All positions are squared within a day or 2 (if unlucky) unlike some EA that do not close losses that waits indefinitely for the magic tp to come.. win 68% loss 32% tons of micro trades = 0.5~2.0% daily PS. This is Live US$10K account
Show your best EA
- ragnakore replied Feb 17, 2009
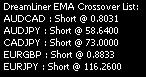
For today Feb 28, I got these list: AUDCAD Short @ 0.8031 AUDJPY Short @ 58.64 CADJPY Short @ 73.00 EURGBP Short @ 0.8833 EURJPY Short @ 116.26
Simplest Daily EMA Cross System
- Posts by Member Search: 'ragnakore'