- Search Forex Factory
- 633 Results
- quecee5 replied May 18, 2010
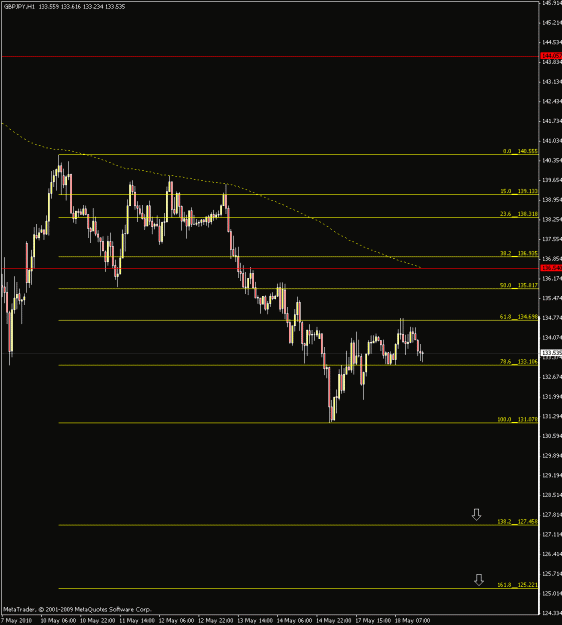
Here is an observation one must consider IMO. . . Looking at the swing hi/lo from the last wave 140.55 - 131.07 if yu plot a 200 SMA on the chart price has not traded above it on the 1hr chart since May 5th 2010 and has respected it every since. . . ...
Auslanco - GBP/JPY and GBP/USD (newstrade)
- quecee5 replied May 18, 2010
Here is the set-up with the same chart as yesterday. . . Notice we didn't trade below 133.03/06 as stated and we pretty much just ranged between 133.60 - 134.30 with spike above and below. . . The set-up will be confirmed if we get a daily close ...
Auslanco - GBP/JPY and GBP/USD (newstrade)
- quecee5 replied May 17, 2010
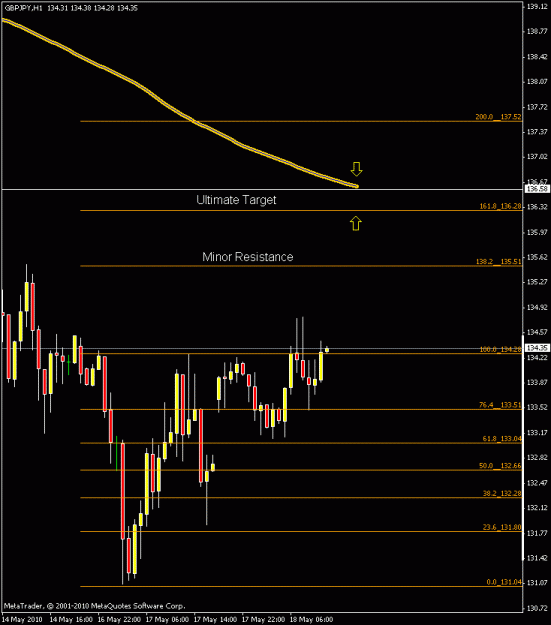
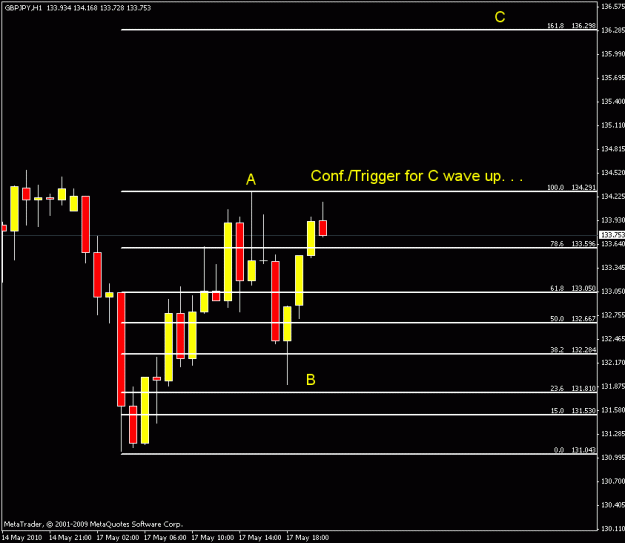
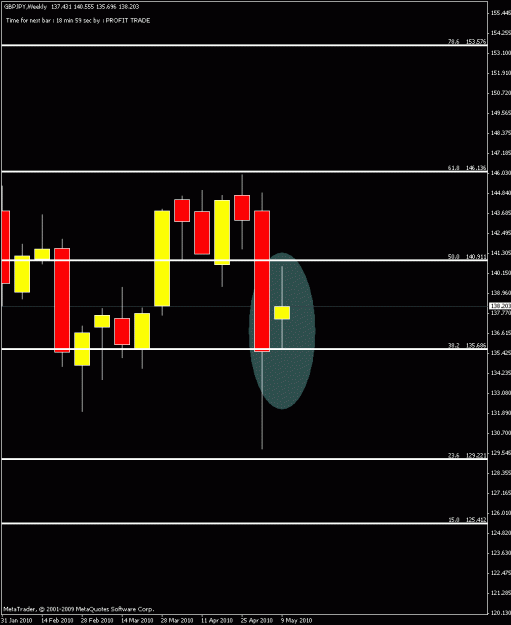
Now if you look at the entire wave structre from the move lower from 140.60 we seem to be in a correction up to test the top of the broken rang at 135.88 with a push up to 136.30/60 tops. . . Also fit right in line with ABC on my chart and weekly 5 ...
Auslanco - GBP/JPY and GBP/USD (newstrade)
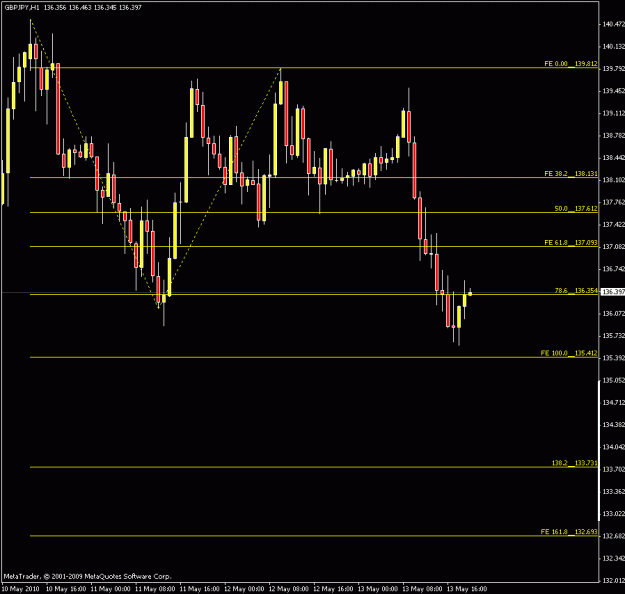
- quecee5 replied May 13, 2010
Fib ext or expansion is only used when you have 3 swing points ABC to project D so typically you would expect AB = CD in this scenario. . . Typically people using this method are looking for FE 100 and FE 1.618 on ext. thus the name ext or ...
Auslanco - GBP/JPY and GBP/USD (newstrade)
- quecee5 replied May 13, 2010
Bro weekly is working out just as we discuss in the weekly range now at the bottom of it. I posted that here yesterday up target at 139-139.50 tops. . . Then down from there and I expected the lower range of the weekly range to get hit and here we ...
Auslanco - GBP/JPY and GBP/USD (newstrade)

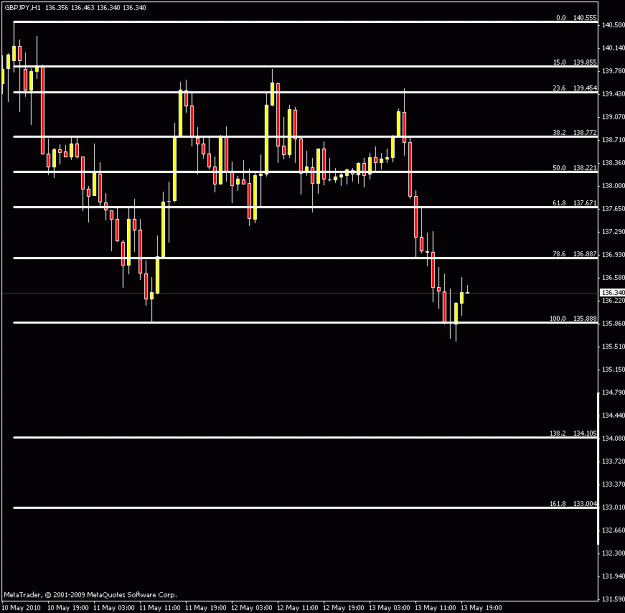
- quecee5 replied May 12, 2010
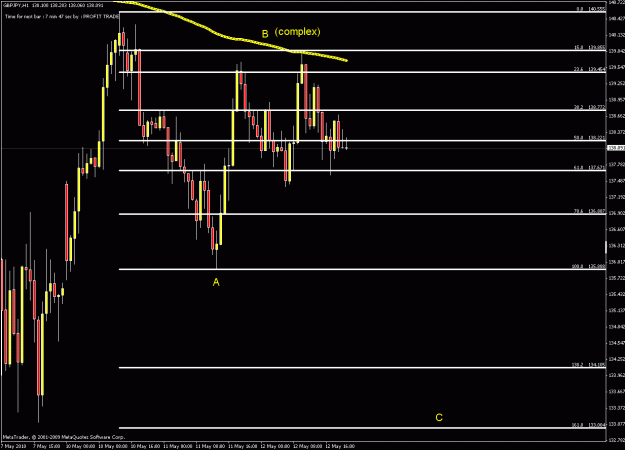
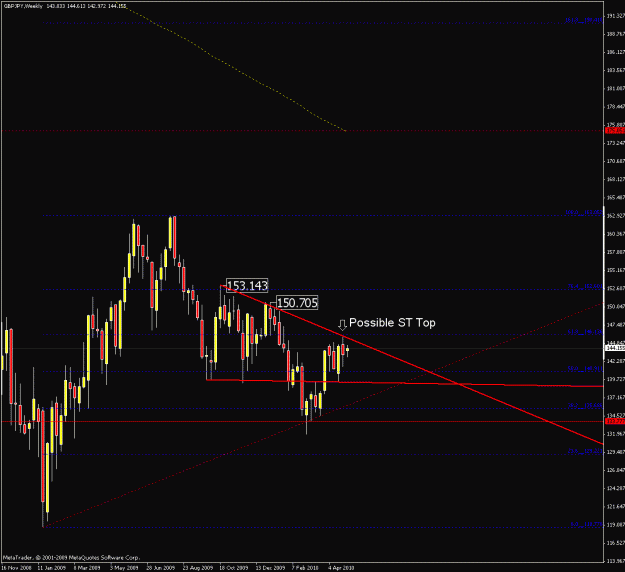
Again I ask the question to this thread and enclosed is my chart to discuss. . . After the bounce off the 78.6% fib based on the weekly chart price then moved up to get back in the 38%-50% fib range which can be clearly seen on this chart. . . The ...
Auslanco - GBP/JPY and GBP/USD (newstrade)
- quecee5 replied May 12, 2010
Lets consider the alternative that we will go up. . . So lets look at the daily chart! Even if price does go up based on the daily chart I would think it would go up in 3 waves and possibly 5 waves if the trend up should continue. . . Would you ...
Auslanco - GBP/JPY and GBP/USD (newstrade)
- quecee5 replied May 12, 2010
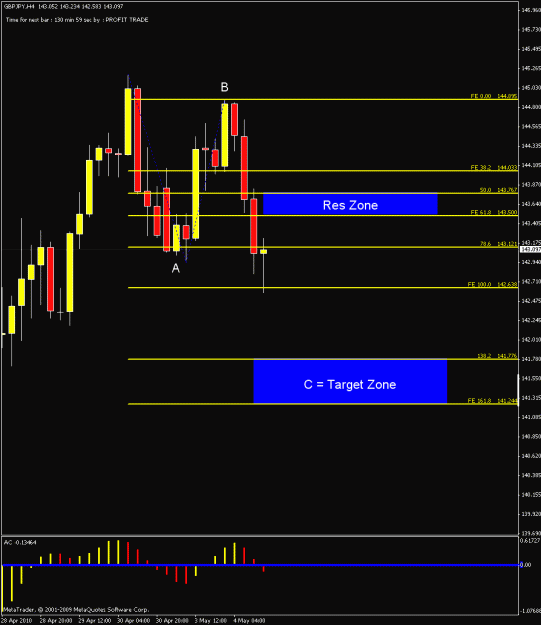
Here is a typical set-up based on the 1hr chart. . . 1st yellow = 200 MA I have drawn the fib based off what looks to be another ABC correction headed lower with a resting place at 133 area. . . Look how after the initial wave to 135.88 it went ...
Auslanco - GBP/JPY and GBP/USD (newstrade)
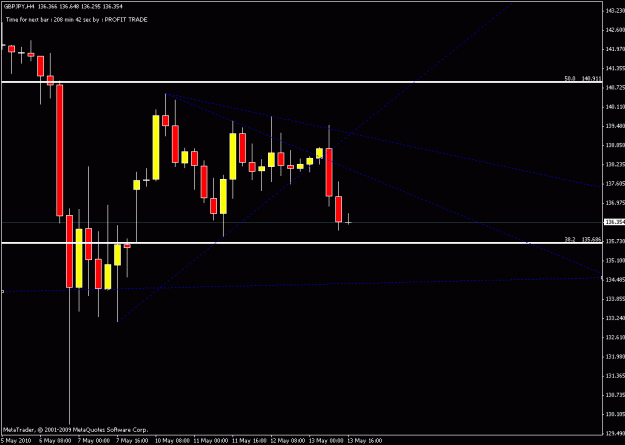
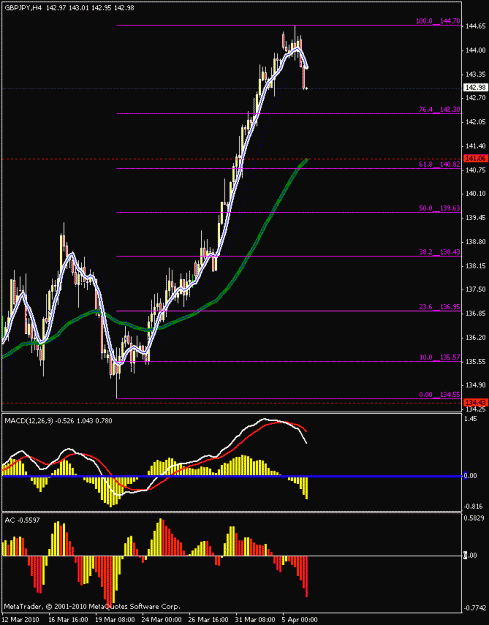
- quecee5 replied May 12, 2010
Now lets take a look at that same chart I presented to you keeping all else the same but drilling down to the lower TF - lets say 4hr chart. . . Once can clearly see we are in a nice range 140.91 and 135.68. . . Once can also see that we are making ...
Auslanco - GBP/JPY and GBP/USD (newstrade)
- quecee5 replied May 12, 2010
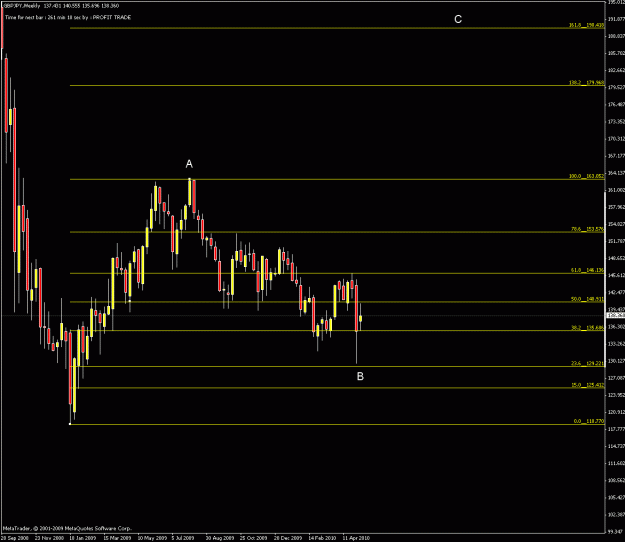
Here is a chart for you - now I've just mentioned if we are headed further up in ABC this is what the fib structure would look like on a larger scale. Also, ask yourself why did price stop almost exactly on the 23.6 fib to the pip? Is it by chance? ...
Auslanco - GBP/JPY and GBP/USD (newstrade)
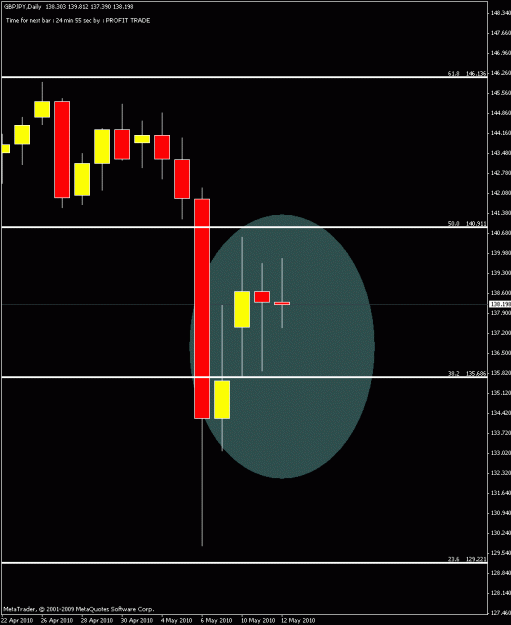
- quecee5 replied May 10, 2010
Not sure on that - Hasn't closed above the 21 SMA since Feb of this year. . . Would be looking for a solid weekly close above that area with a solid test of support after it breaks-out otherwise it can reach 1.36 area - has not bottomed yet IMO. As ...
Auslanco - GBP/JPY and GBP/USD (newstrade)
- quecee5 replied May 4, 2010
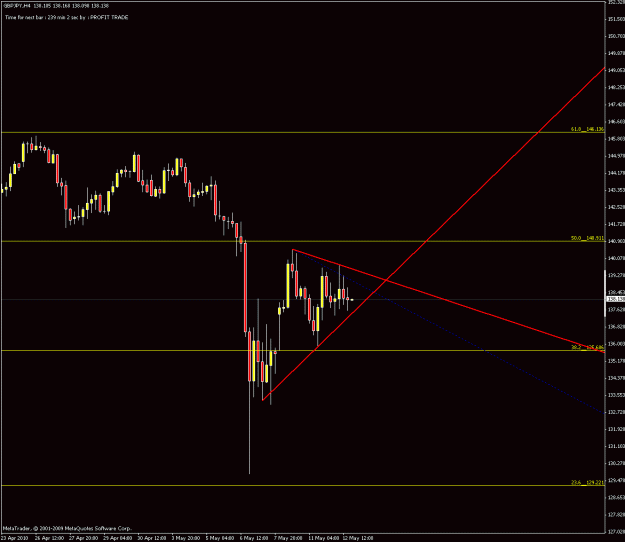
Here is what I'm looking at on a micro level as an initial set-up. . . Let's see how it plays. . .
Auslanco - GBP/JPY and GBP/USD (newstrade)
- quecee5 replied May 3, 2010
Have'nt posted in a while so here is my take on current PA if anyone is interested. . . In my experience when we enter into a consolidation zone it's best to look to the higher TF's to try an make some sense out of what could be going on. . . So if ...
Auslanco - GBP/JPY and GBP/USD (newstrade)
- quecee5 replied Apr 8, 2010
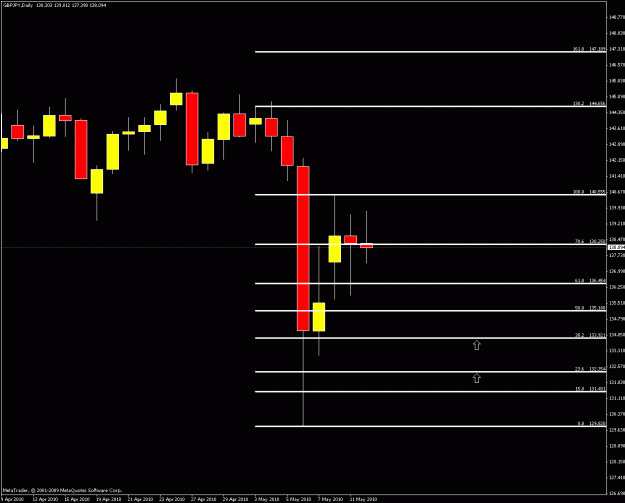
Hope everyone is enjoying shorts if you shorted on the spike on Sunday. . . We're trading the daily chart now and as stated last week and earlier this week the daily divergence will play. . . min target 139.50 max target based on this daily chart is ...
Auslanco - GBP/JPY and GBP/USD (newstrade)
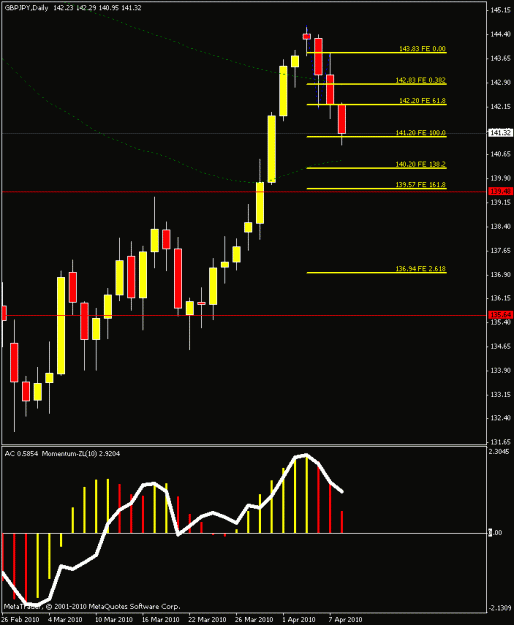
- quecee5 replied Apr 6, 2010
We are speaking the same language. . . The bottom of the wedge off 150.70 to 132 is located at 136.45 which we should test this week. . . If that holds we will bounce and 151 is your initial upside target. . . 139.30 area is insignificant as you ...
Auslanco - GBP/JPY and GBP/USD (newstrade)
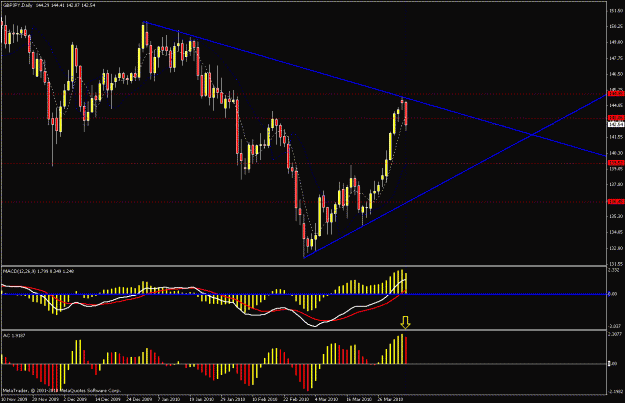
- quecee5 replied Apr 6, 2010
4hr chart. . . But I'm looking for actually lower. . . The retrace is long over due and I wouldn't be surprised if we retrace the entire wave c leg but that's just me. . .
Auslanco - GBP/JPY and GBP/USD (newstrade)
- quecee5 replied Apr 6, 2010
Auslanco - GBP/JPY and GBP/USD (newstrade) url 4hr 55 ema a good target at 140.85 area 1st stop. . .

- quecee5 replied Apr 5, 2010
Auslanco - GBP/JPY and GBP/USD (newstrade) Lets see if history is indicative of the future? So far I would say it's pretty spot on. . . See you in a couple days and lets re-evaluate price again?

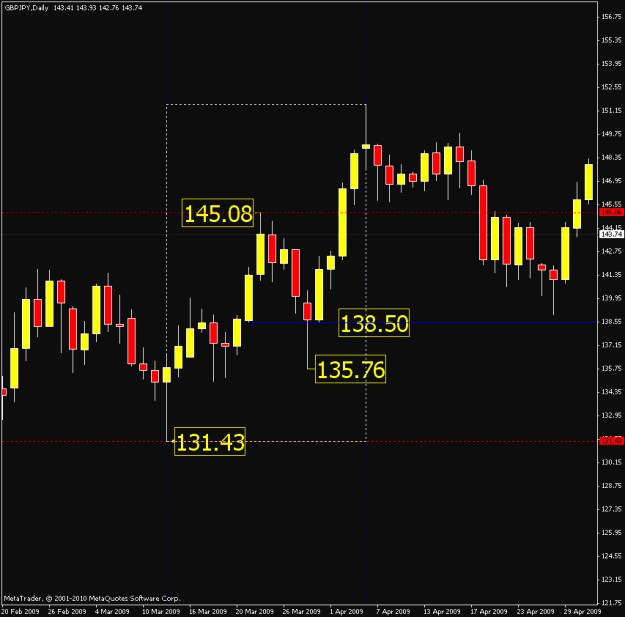
- quecee5 replied Apr 4, 2010
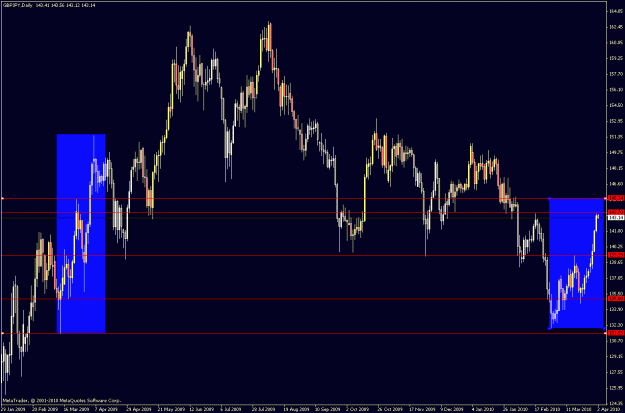
If you don't think it can happen well. . . Does this pattern look familar? This it what happened March 2009 same exact pattern. . . Look what happened after we finished the extension wave to 145 from where>>>>>> You guessed it 134.90 area - sounds ...
Auslanco - GBP/JPY and GBP/USD (newstrade)
- quecee5 replied Apr 2, 2010
Well let me be the 1st to say yields are steady at just below 4% and the NFP was good but wasn't a blow away number. . . In fact little has changed in terms of unemployment but the good news is it's steady but a steady 9.75% which in the overall ...
Auslanco - GBP/JPY and GBP/USD (newstrade)