- Search Forex Factory
- 66 Results (1 Thread , 65 Replies )
-
 pretorian1 replied Jul 30, 2019
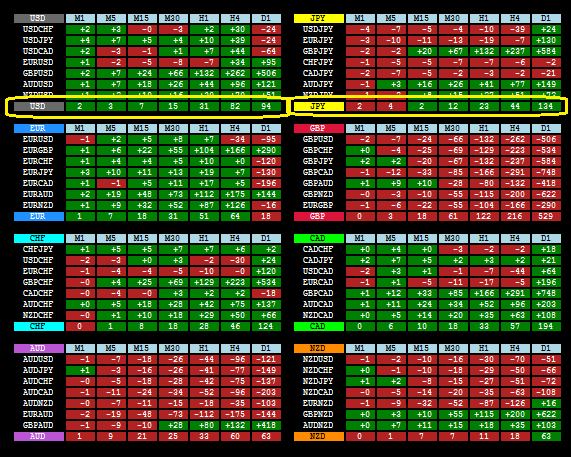
This histogram is a graphical view of these values, pointed by yellow. According to my observations, these bars are filled when the value is 10 or more pips and are not filled when the value is below 10 pips. image
MADdash (Moving Average Distance)
- pretorian1 replied Jul 3, 2019
Hello Thriller
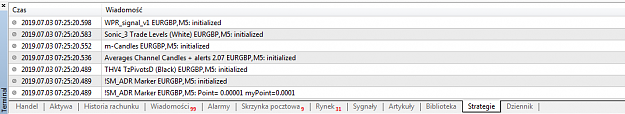
I will code your EAs and Indicators for no charge I need an indicator, that will get these alert notifications: image and convert them them into push notifications, so mt4 can read them as push notifications. Unfortunately i do not have an mql4 version of most of the ...
- pretorian1 replied Jan 12, 2019
Hello everybody, I'm really glad to see you guys are still kicking asses, using currency strenght/weakness filters like Maddash
MADdash (Moving Average Distance) I wish you all further luck, and i can ensure you - basing on my own few years experience - it's really worth to ...
- pretorian1 replied May 30, 2018
Hey George, Thank you, I'm doing well. I hope you're doing great too
MADdash (Moving Average Distance) I think you misunderstood my question a little bit. I'm using maddash and currency strenght from longer perdiod of time. I've mastered my own way to use it and I'm more than ...
- pretorian1 replied May 29, 2018
Hello, You're one of the guys involved in maddash the most Could you please explain how this histogram is calculated ? image Regards, Michael
MADdash (Moving Average Distance)
- pretorian1 replied Dec 21, 2016
Hello Great Coders here
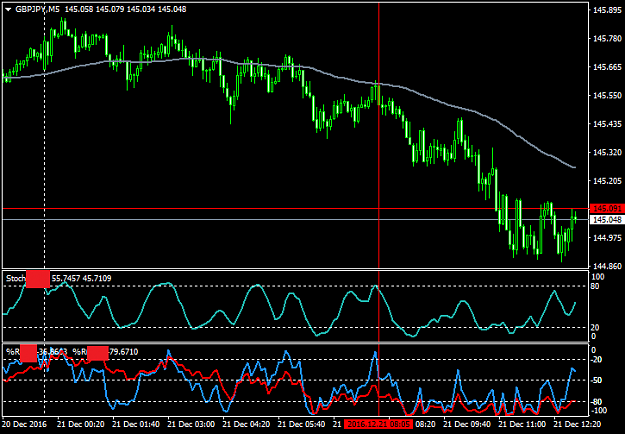
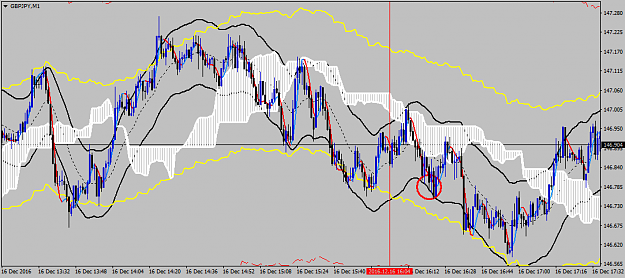
I will code your EAs and Indicators for no charge I really appreciate your great work and I know that you're very busy and sorry for disturbing You with my request, however i found it has a potential. I need and EA to code: I think the idea should be simple. BUY ...
- pretorian1 replied Dec 18, 2016
Hello papamax, Glad you enjoy your Babon trading
Daytrading/scalping with high leverage - my proven strategy I'm also thinking about starting posting my trades here, but this probably will happen in New Year 2017, because I'm a little ill now and even if i got better, there would be Christmas Time, ...
- pretorian1 replied Nov 11, 2016
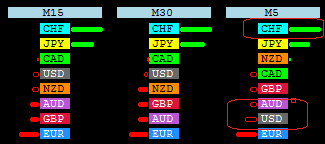
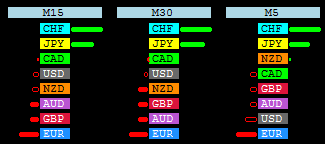
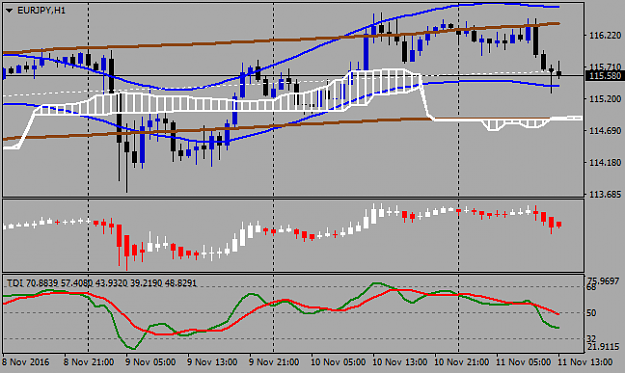
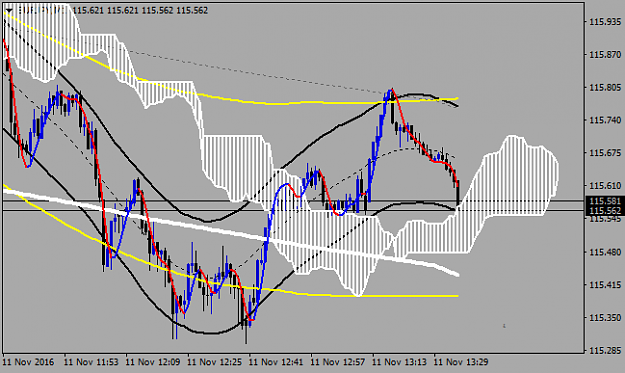
Hello Mike, I'm trading with 2 monitors right now, but Im thinking about buying new one/ones. Right now each chart is about this size: image image I always check BIG PICTURE before i start my trading day to see how BP looks like and by BP i do ...
Daytrading/scalping with high leverage - my proven strategy
- pretorian1 replied Aug 30, 2016
Hello eevviill
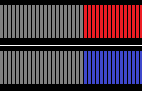
I will code your EAs and Indicators for no charge Sorry for the explanation, i tried to clarify the rules as good as possible. I mean something like this image to draw a histogram, when the signal on 3 TF's appear. Thank you for the indicator, but i think it is not ...
- pretorian1 replied Aug 30, 2016
Hello Great Coders!
I will code your EAs and Indicators for no charge I would like to ask you to help me in developing an indicator, based on DMI. It should be a histogram, based on 3 TF indicator signal For a buy signal: DMI from TF1 TF2 and TF3 are in agreement UP I ...
- pretorian1 replied Aug 24, 2016
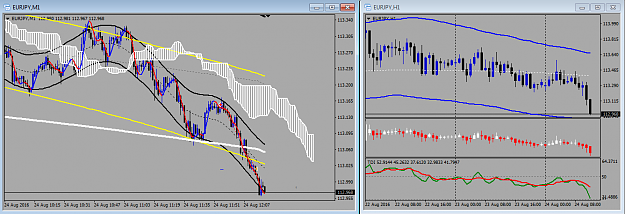
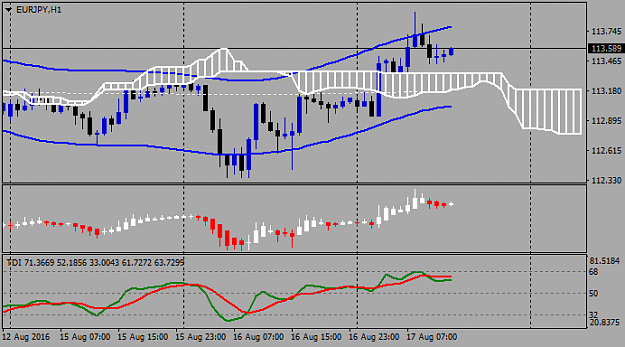
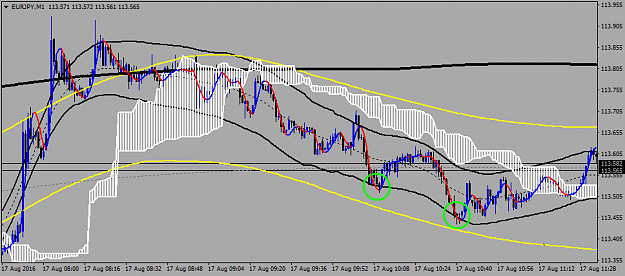
EURJPY +13.9 pips image Missed the "main entry" so i entered on a re-entry signal. Still a little bit ranging market, but i decided that H1 supports my decision to go short. Exit at TMA M5 Regards, Michael
Daytrading/scalping with high leverage - my proven strategy
- pretorian1 replied Aug 21, 2016
Hello Great Coders!
I will code your EAs and Indicators for no charge I would like to ask you to help me in developing an indicator, based on DMI. It should be a histogram, based on 3 TF indicator signal For a buy signal: DMI from TF1 TF2 and TF3 are in agreement UP I ...

- pretorian1 replied Aug 17, 2016
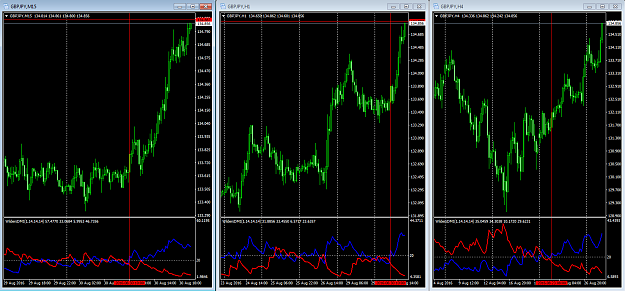
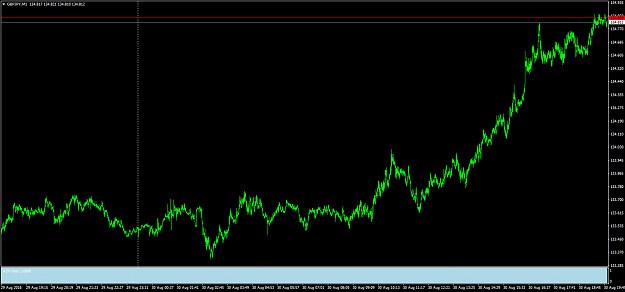
Hello pundit
Daytrading/scalping with high leverage - my proven strategy Let's look at the big picture: image image For me, both these pairs was in consolidation and it means ranging market so it is NOT very good background to trade. What's more, at the moment you took a trade, it was probably still ...

- pretorian1 replied Jul 28, 2016
Hello Babon Folks!
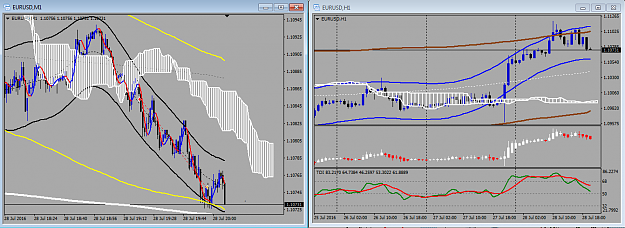
Daytrading/scalping with high leverage - my proven strategy EURUSD +10 pips image TMA H1 is beyond TMA H4 and it started a little pullback on H1 so i decided to enter a trade. It had only 10 pips potential, but i decided to take it and here we are. Closed on TMA M5 Today was a ...
- pretorian1 replied Jul 15, 2016
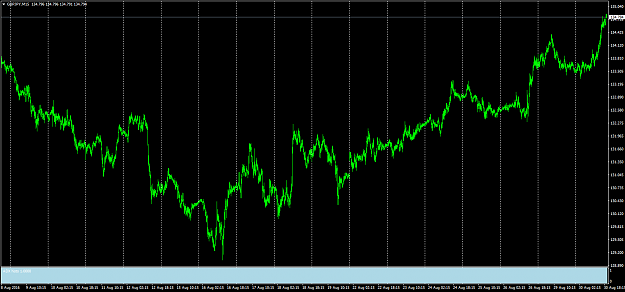
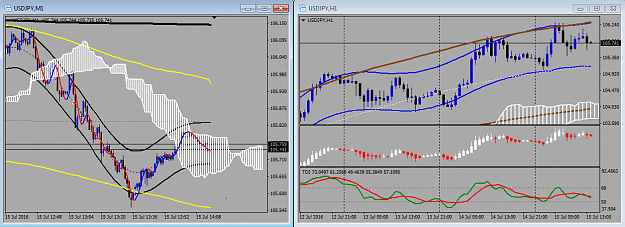
USDJPY +28.6 pips image I know big picture from H1 is not clear, but there is no more strenght to go up and we have something like consolidation at the moment. However there was a naked pattern TMA M1 beyond Ichimoku Cloud, confirmed that price to ...
Daytrading/scalping with high leverage - my proven strategy
- pretorian1 replied Jul 14, 2016
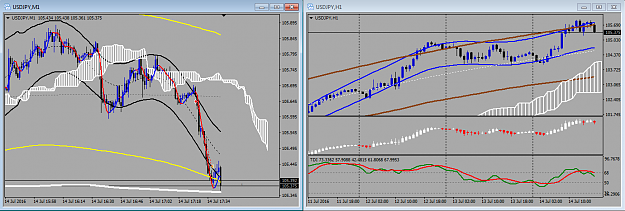
USDJPY +20.6 pips image A little against "classic" big picture, but i decided that up move is over or almost over and it is time for a pullback, as the price was dancing on TMA H1 and TMA H4 upper bands for a little while and has no power to break ...
Daytrading/scalping with high leverage - my proven strategy
- pretorian1 replied May 13, 2016
Hello everybody here!
I will code your EAs and Indicators for no charge Can any kind coder or programmer from here help me to make an indicator? The idea is very simple. I need and indicator, that will show on chart arrows on MTF moving average and price crossover. But i need there multi time ...
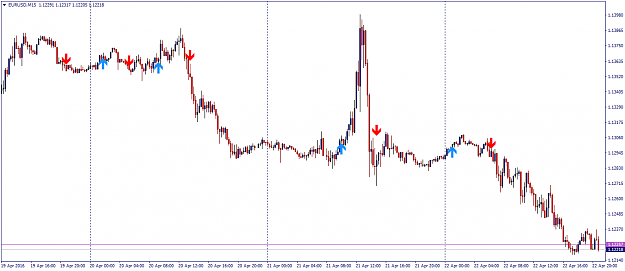
- pretorian1 replied Apr 23, 2016
Hello, Thank you for the suggestion. But i need rather something like this image But i need these arrows when price is above or below specified MA's on specified TF's (from M1 to H1) Regards, Michael
I will code your EAs and Indicators for no charge

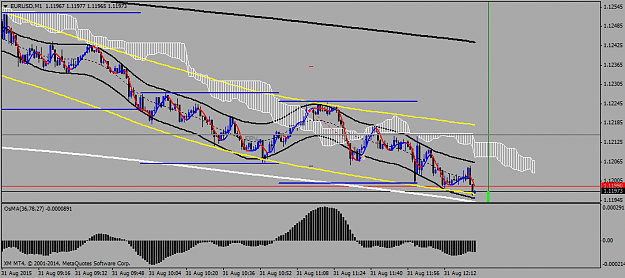
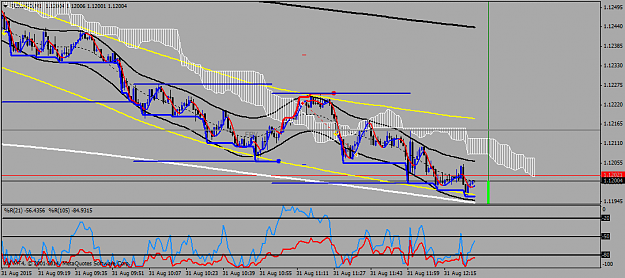
- pretorian1 replied Aug 31, 2015
EURUSD +14 pips image That was a pure Hunter trade
Daytrading/scalping with high leverage - my proven strategy image Regards, Michael
- pretorian1 replied Aug 3, 2015
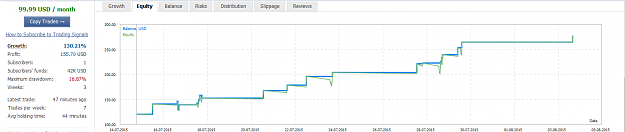
03.08.2015 RESULTS image Growth: 130.21% Drawdown: 16.87% url
Rodian Trading Signals - tight SL (5-20 pips) and good entries