- Search Forex Factory
- 7 Results
- pickers replied Jun 20, 2013
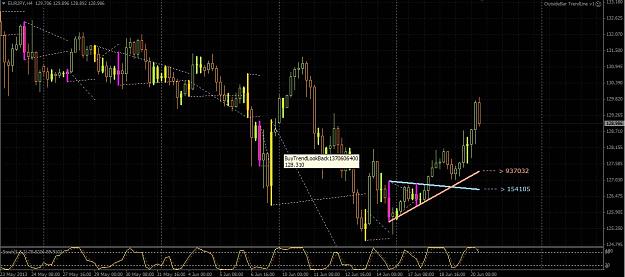
btw for post 154. Have you taken the trades based on what you have drawn? What were the conditions that led to the trades in terms of - entry condition, - conflicting trade entry condition management - stoploss and - profit target? Updated EA with ...
High low bar chart only & how to trade them!
- pickers replied Jun 19, 2013
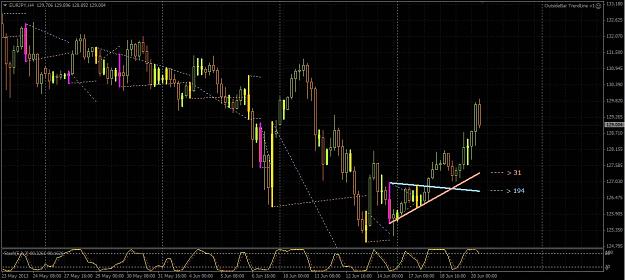
updated the EA - with power of lines request (see post 110). There could be an issue of two numbers merging when the trendlines get too close though i have added additional code to prevent such happenings. - added code to reflect past trendlines ...
High low bar chart only & how to trade them!
- pickers replied Jun 15, 2013
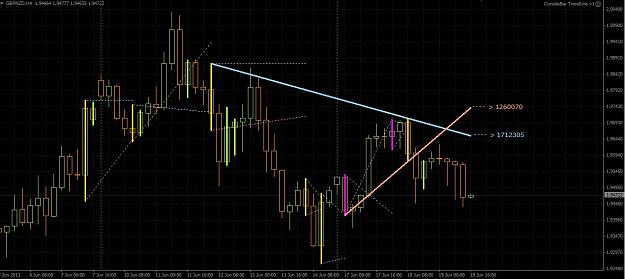
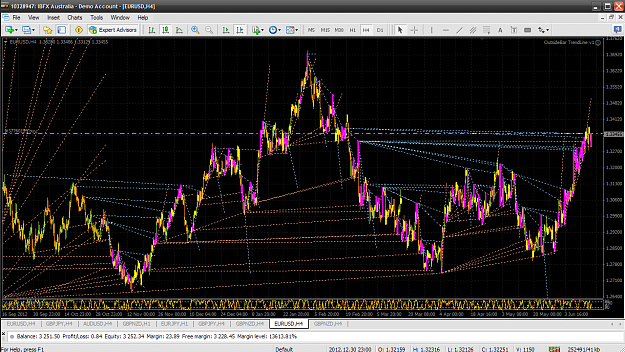
for S<R & S > R The new EA makes it easier to see better for trendline projections. LightSkyBlue means BuyTrendline. LightSalmon means SellTrendline. Inside Bar now GreenYellow. Outside Bar that is High / Low of the day = Gold.
High low bar chart only & how to trade them!
- pickers replied Jun 15, 2013
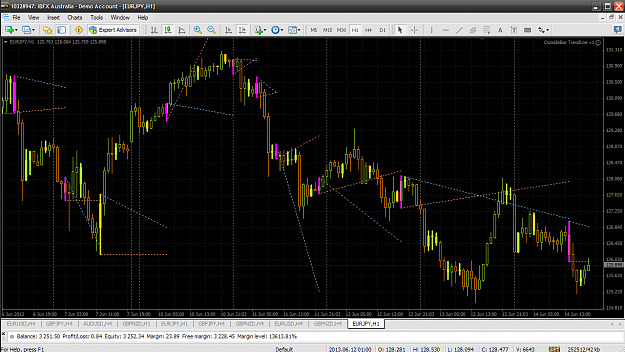
Please pardon me if i misunderstood your post. Doable. I can see the significance of the high low of the day. How can we make use of this information? This would be similar to a higher period HHLL indicator. See the attached pic. How can we make use ...
High low bar chart only & how to trade them!
- pickers replied Jun 14, 2013
I decided to release this newer version of indicator EA (does not trade) after recidiviste pm-ed me. Basically i added some more functionalities to enable users to see slightly more clearly for the past trendlines' projections. As usual, the ...
High low bar chart only & how to trade them!
- pickers replied Jun 12, 2013
Dear Sir, i am fine. Got a qns, need your expert answer!
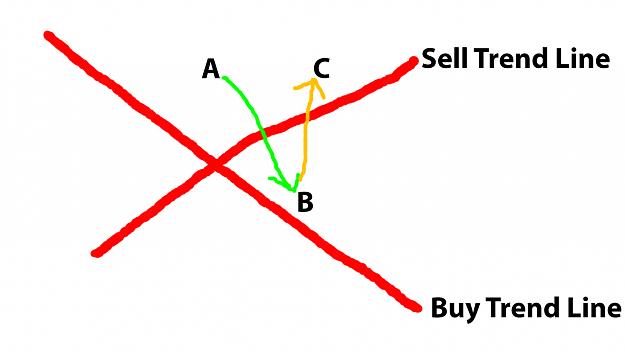
High low bar chart only & how to trade them! if price goes from a to b, a sell will be triggered. if price goes from b to c, how would this be handled? Given that the sell could be taken out by the stoploss but what about a buy since ...
- pickers replied Jun 9, 2013
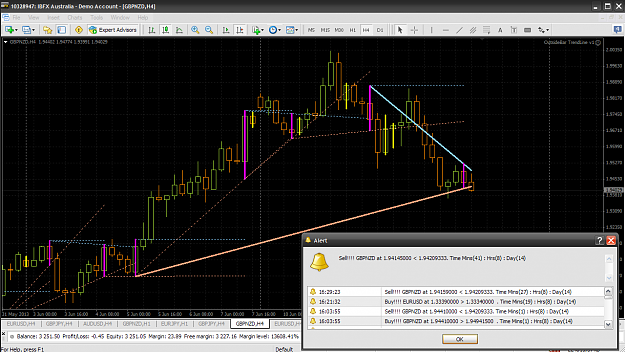
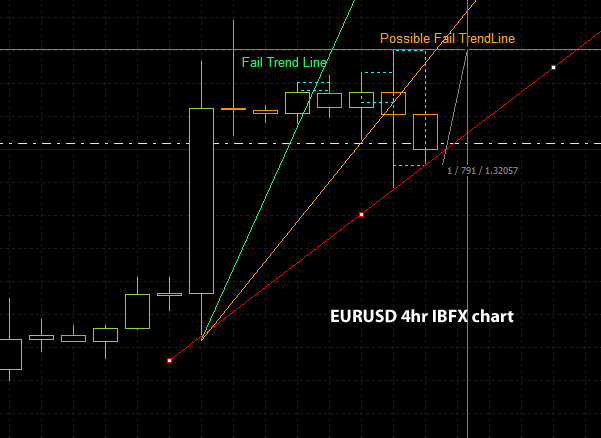
the first green trend line was a failure. the cyan box top indicates the stoploss while the bottom indicates entry. the orange trend line could be a failure, depending on whether the price goes up or triggered the sell entry first. the red trend ...
High low bar chart only & how to trade them!
- Posts by Member Search: 'pickers'