- Search Forex Factory
- 274 Results
-
 pgd replied Feb 24, 2016
hi clive, been reading your thread past few days. i am a fan of mtf approach too. even while trading the m1, while i look at m5, i do also want to look beyond to say h1 for deeper trade context. your cci entry approach is interesting -- different ...
Trading is as simple as ABCD

- pgd replied Aug 10, 2015
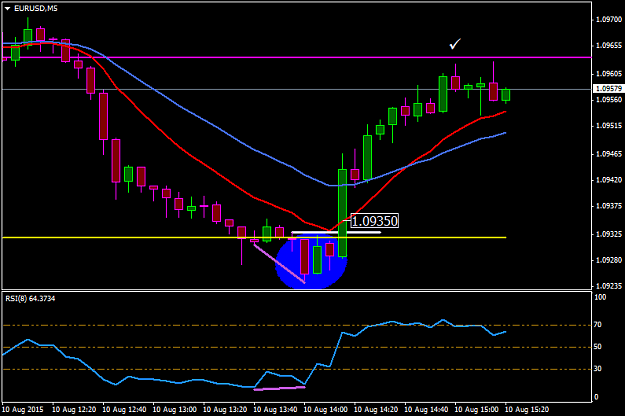
eurusd m5 a nice reversal after the short posted above triggered a long above the pivot: 1] bullish divergence 2] bullish harami and hammer (blue ellipse). 3] rising triangle. entry: on break on rising triangle and pivot. exit : 1.0961 (near day's ...
Psych Levels, Pivots, and Trendlines - Resurrected
- pgd replied Aug 10, 2015
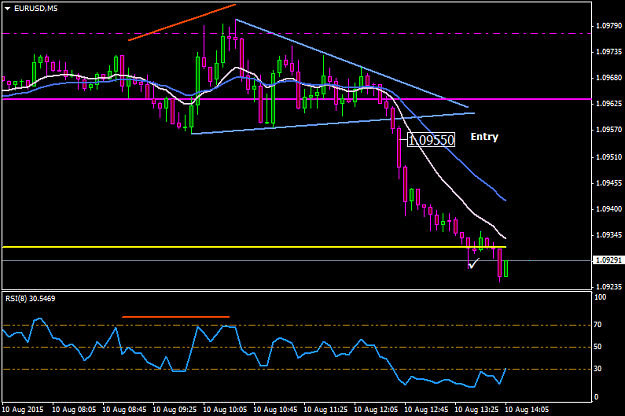
eurusd m5 short 1] paints divergence as price hits prev. day's high (dashed magenta). 2] some long upper wicks and price starts drifting downwards. 3] |> forms along day's open (solid magenta). entry : on |> breakdown as marked. exit : 1.0934 (near ...
Psych Levels, Pivots, and Trendlines - Resurrected
- pgd replied Aug 7, 2015
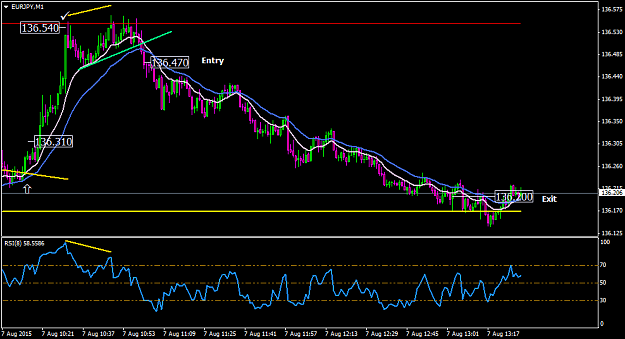
eurjpy M1 short this one came back to back after the long posted above (#10518) several long upper wicks at R1 (see chart at stated post) made it worthwhile to drop down to M1 for an entry. it worked: bearish divergence, followed by mini trend line ...
Psych Levels, Pivots, and Trendlines - Resurrected
- pgd replied Aug 7, 2015
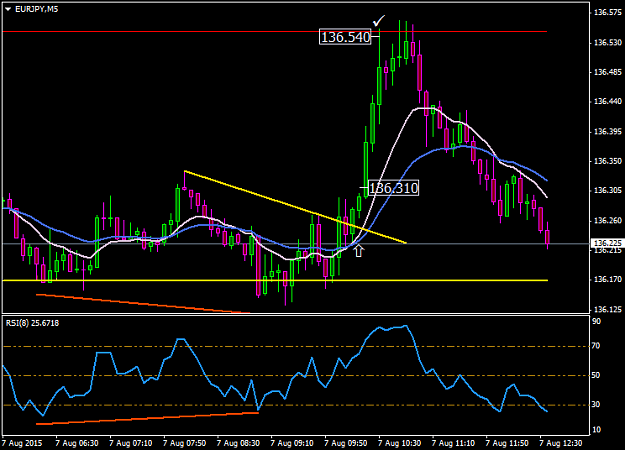
EURJPY M5 LONG this one was pretty straight forward. bullish divergence, bounce off pivot, counter trend line b/o. entry, exit marked. image
Psych Levels, Pivots, and Trendlines - Resurrected
- pgd replied Aug 5, 2015
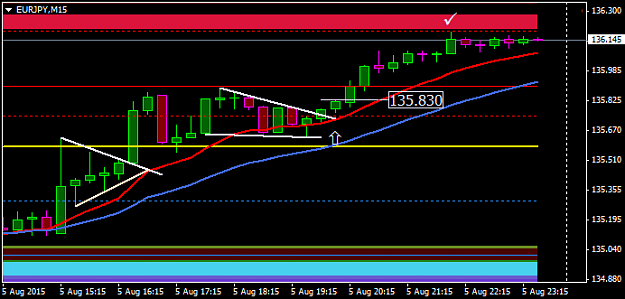
eurjpy m15 long after the |> b/o trade posted earlier, price paints a down-sloped wedge. b/o above the wedge and mR1 provides another long entry at 135.83 exit at 136.18 near confluence of mR2 and res. area (red band above) coming from 3-Aug. a more ...
Psych Levels, Pivots, and Trendlines - Resurrected
- pgd replied Aug 5, 2015
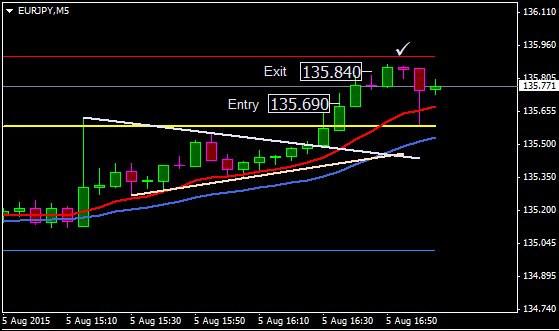
eurjpy m5 long this sym |> b/o didn't seem to have much strength. it still didn't disappoint with 15 pips in about 20 mins. entry and exit as marked. image
Psych Levels, Pivots, and Trendlines - Resurrected
- pgd replied Aug 4, 2015
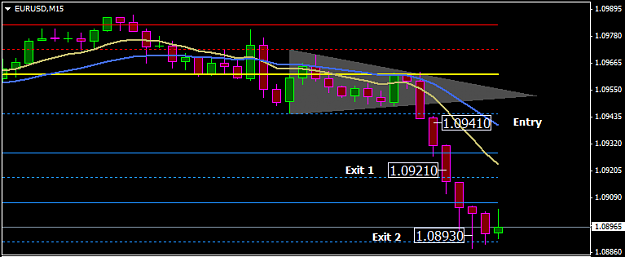
EURUSD M15 SHORT symmetrical |> breakdown below mS1. entry and exits as marked. sweet painless trade. image
Psych Levels, Pivots, and Trendlines - Resurrected
- pgd replied Jul 24, 2015
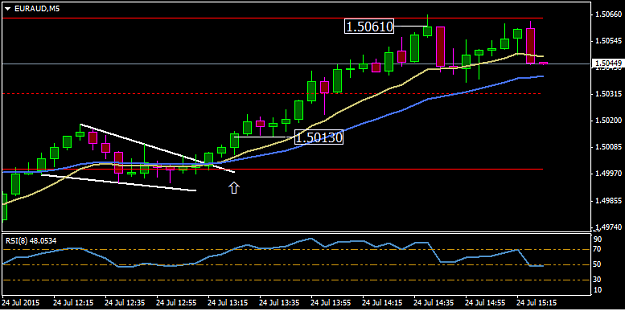
euraud m5 - long the pair has been kind today. attached chart is self-explanatory. image
Psych Levels, Pivots, and Trendlines - Resurrected
- pgd replied Jul 24, 2015
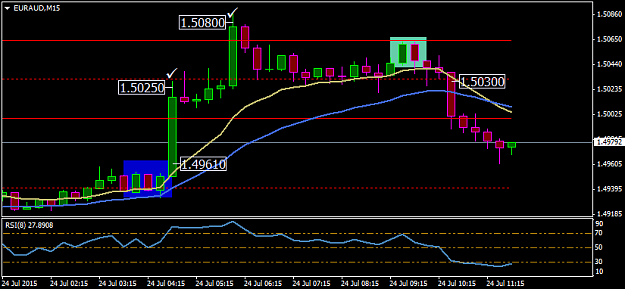
EURAUD - M15 LONG Bullish engulfing followed by piercing line right across mR1. Entry as shown. Exit 1 at RN __25 near mR2 Exit 2 would have been at R2 but good momentum took it beyond for some extra pips. _____________ SHORT DCC between R2 and mR2. ...
Psych Levels, Pivots, and Trendlines - Resurrected
- pgd replied Jul 23, 2015
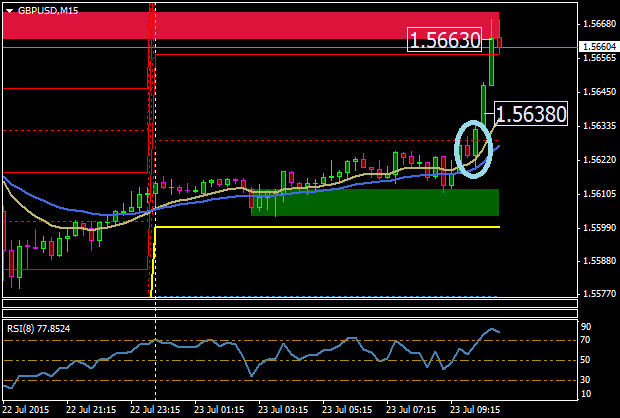
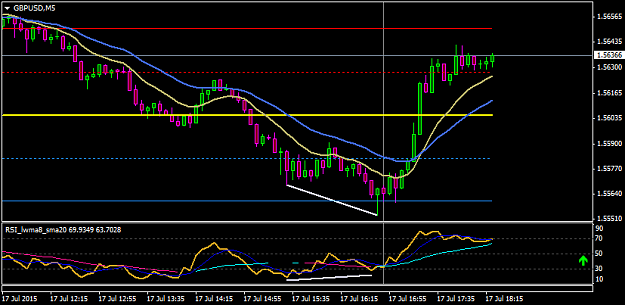
GBPUSD M15 LONG Price rises from support area above pivot. Price stalls at mR1. mR1 is taken out by next candle forming a bullish engulfing pattern. Entry: at 1.5638 (as marked) Exit : 1.5663 near resistance area coming from 17-July. image
Psych Levels, Pivots, and Trendlines - Resurrected
- pgd replied Jul 22, 2015
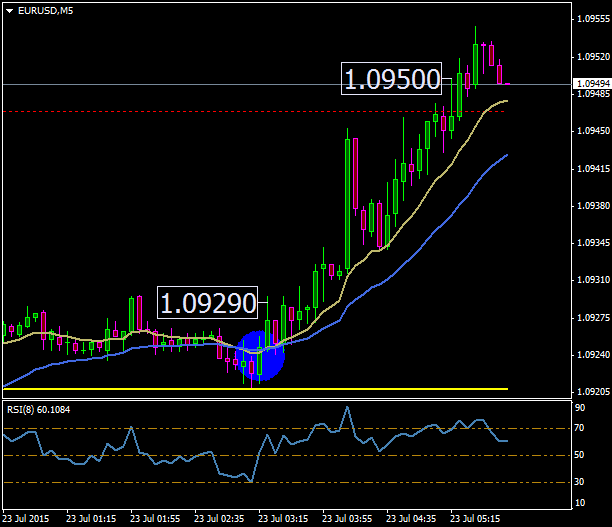
eurusd m5 long 1] price drifts to DP. 2] bullish engulfing pattern formed. 3] entry above pattern. 4] exit at RN __50. image
Psych Levels, Pivots, and Trendlines - Resurrected
- pgd replied Jul 22, 2015
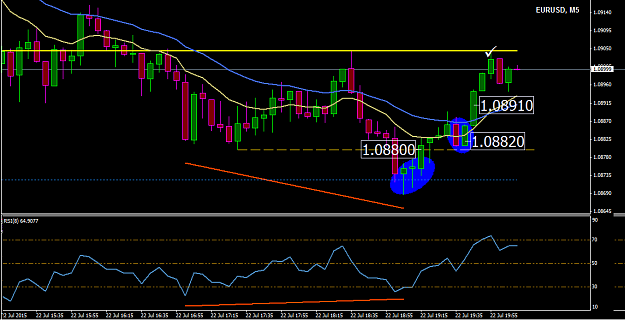
EURUSD_M5_LONG Trade taken. after new bullish divergence at mS1 ending with 2 hammers: entry1 -- when hammers taken out. entry2 -- when retesting level (dashed gold line) entry3 -- when bullish harami forming HL taken out exit -- 2/3 pos. at 1.0899 ...
Psych Levels, Pivots, and Trendlines - Resurrected
- pgd replied Jul 22, 2015
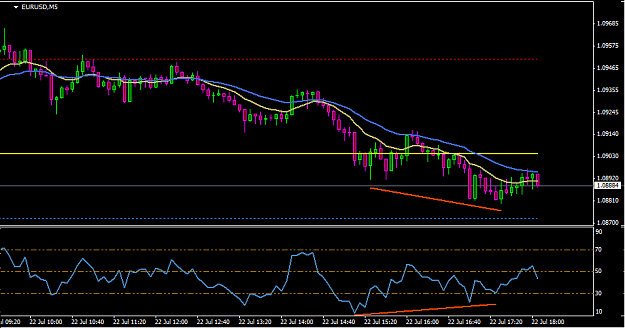
eurusd_m5 watching this for a potential reversal after this nice bullish divergence. perhaps now, a higher low. then, an entry above RN 0900 and 0904 (pivot). any thoughts, anyone? image
Psych Levels, Pivots, and Trendlines - Resurrected
- pgd replied Jul 22, 2015
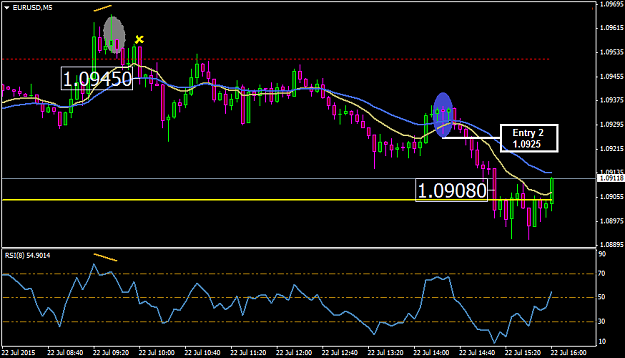
eurusd - M5 - short 1] bearish divergence above mR1 ending with shooting star and bearish engulfing pattern (grey ellipse). 2] mR1 taken out with a longish candle. 3] entry 1 below that area at 1.0945 after a nice LH. 4] entry 2 after re-emerging ...
Psych Levels, Pivots, and Trendlines - Resurrected
- pgd replied Jul 22, 2015
hey ev, at the bottom of page why is your name in orange while others are in blue? image cheers!
Psych Levels, Pivots, and Trendlines - Resurrected

- pgd replied Jul 17, 2015
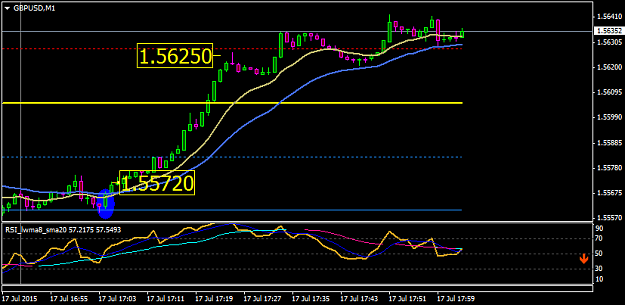
GBPUSD long m5 - bullish divergence near S1 ending with a big hammer. image dropped down to m1 to pick entry. m1 - hammer + bullish engulfing pattern at S1 (blue ellipse). image entry - 1.5572 (as marked). exit - 1.5625 (as marked near mR1 and ...
Psych Levels, Pivots, and Trendlines - Resurrected
- pgd replied Jul 30, 2014
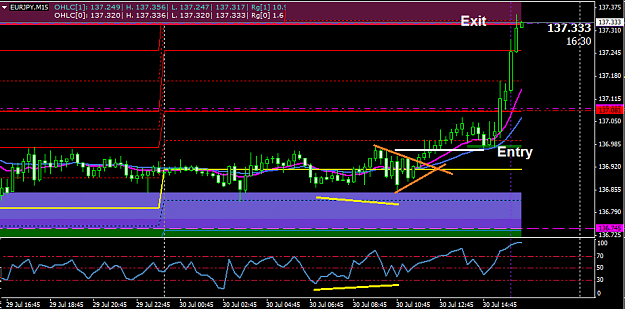
eurjpy m15 long rsi divergenge at confluence of support area (blue band below) yest's low and mS1, followed by sym |> b/o. entry: 137.01 exit : 137.33 (near conf. of res. area at top, last wk's high and mR3).
Psych Levels, Pivots, and Trendlines - Resurrected