- Search Forex Factory
- 17 Results (1 Thread , 16 Replies )
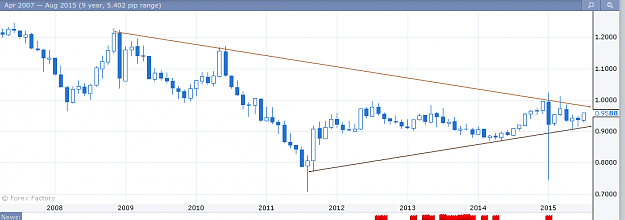
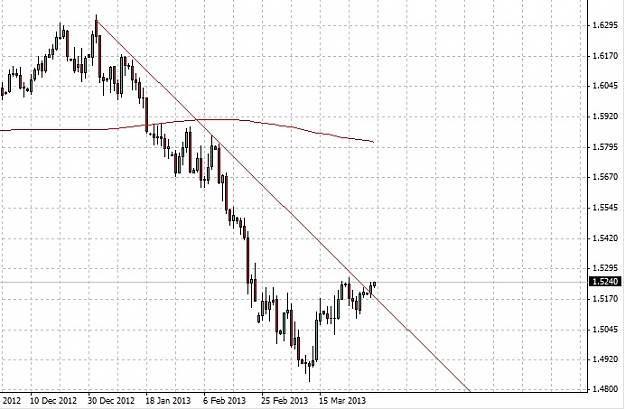
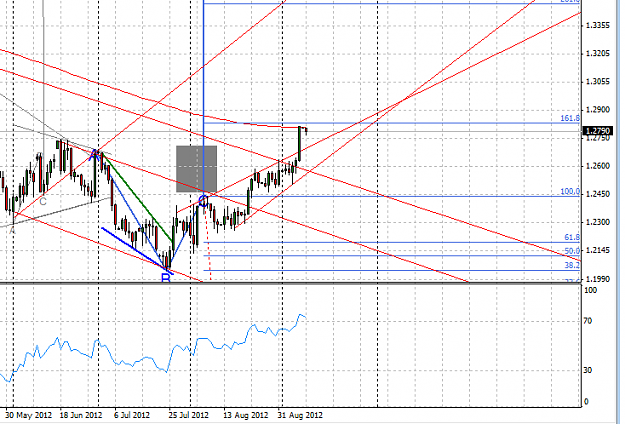
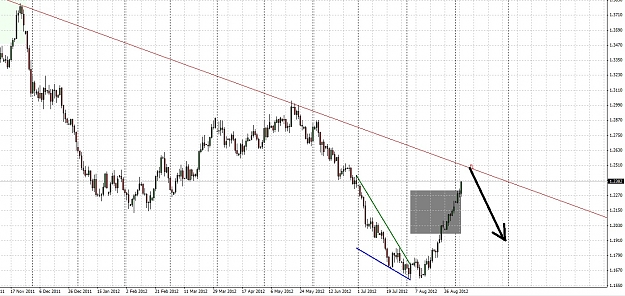
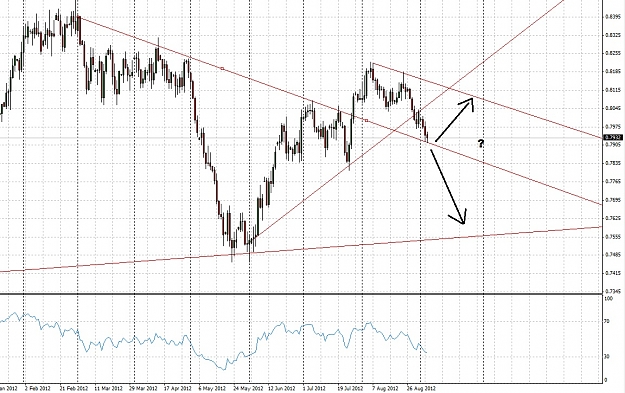
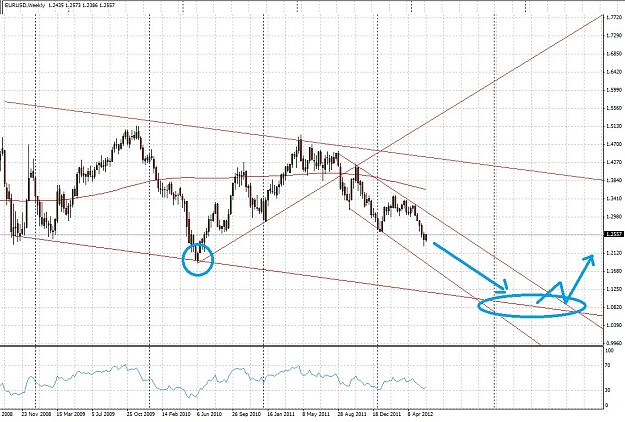
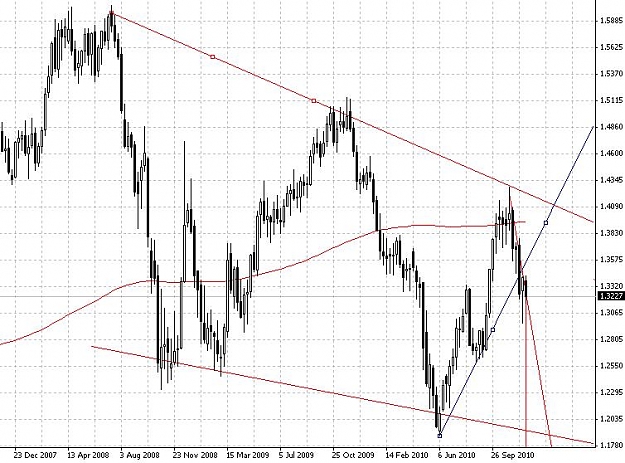
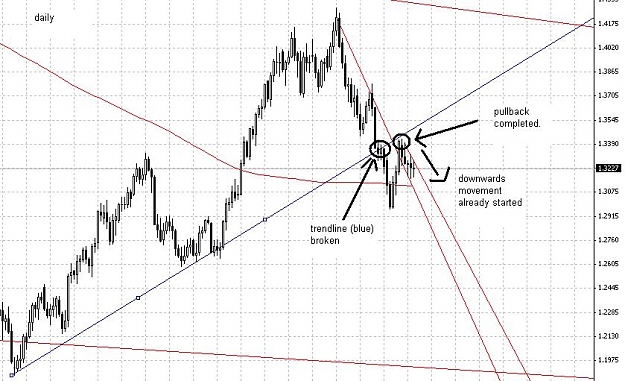
- The long term target for E/U is 1.10... and it will get there in 2013Started Jun 6, 2012|Trading Discussion|2 replies

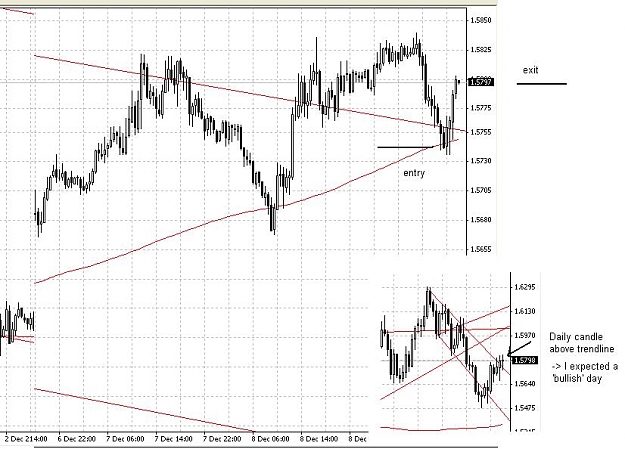
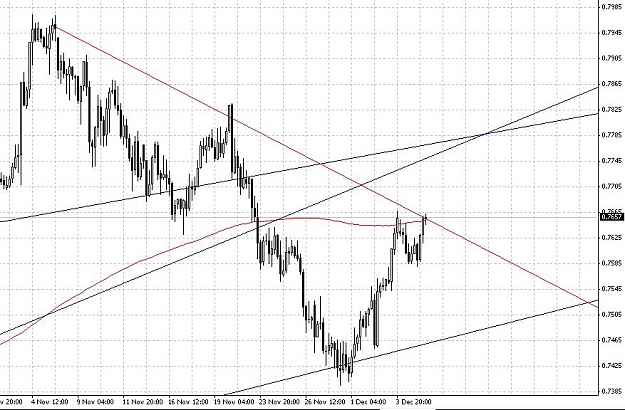
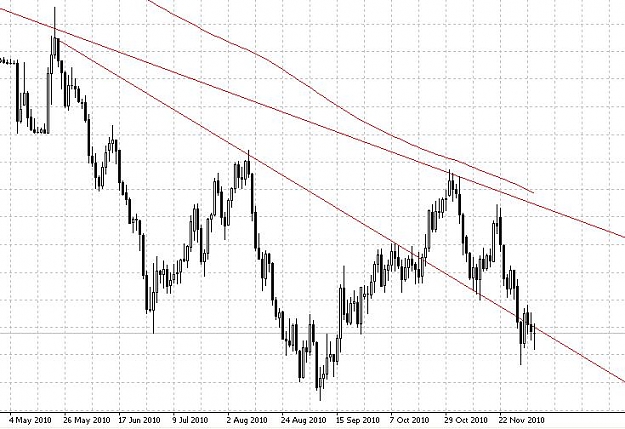
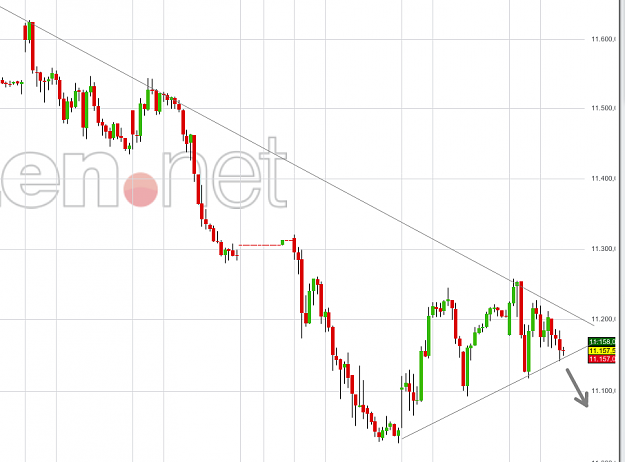
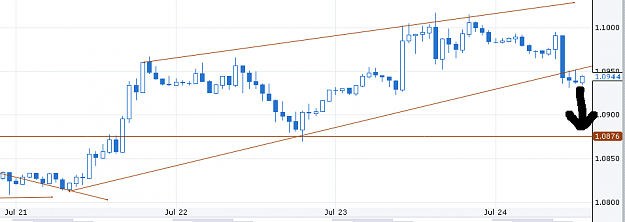
I wonder if anyone else only relys on trend lines for trading and which indicators you use to ...