- Search Forex Factory
- 28 Results
-
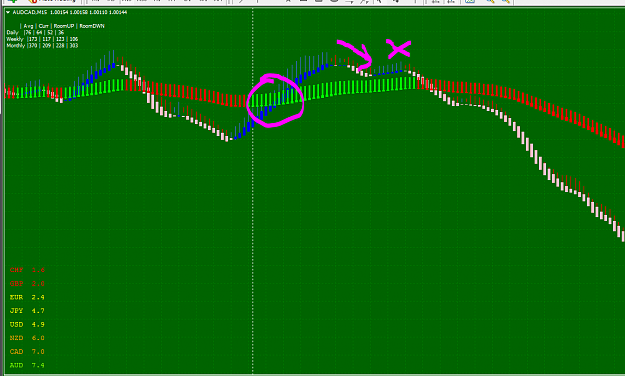
 onarticus replied Mar 3, 2017
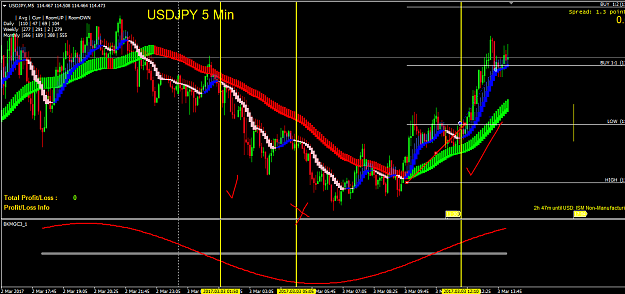
Hi, 5 min chart should clear things up. Yellow lines indicate possible entries. The X entry is the bad one owing to the wave position. image
Noise free system
- onarticus replied Mar 3, 2017
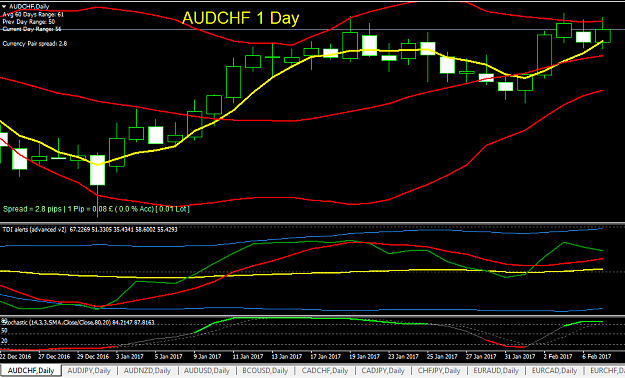
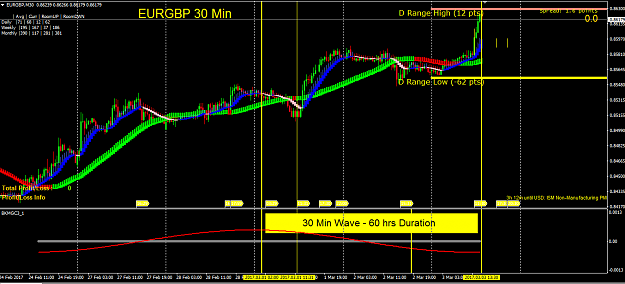
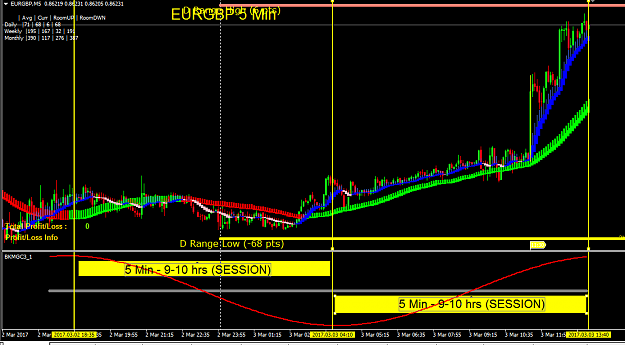
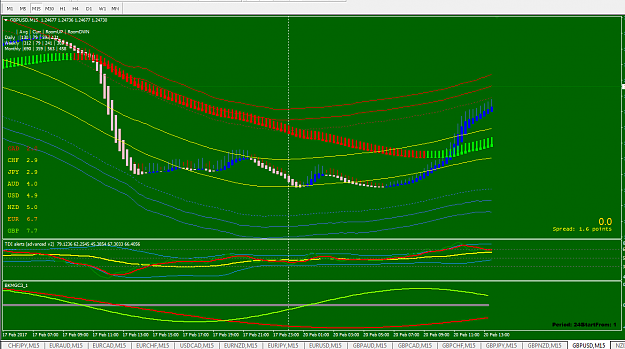
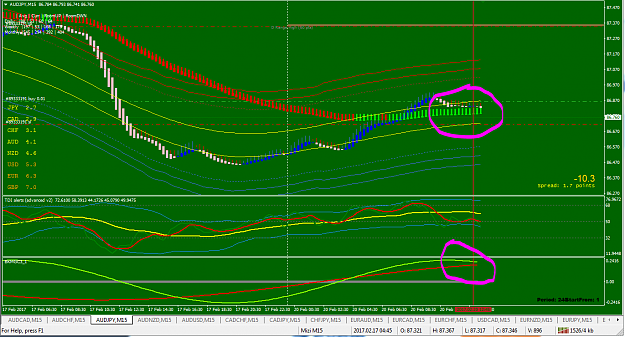
Hi, a quick note about the wave indi and why D1, H4 and even H1 may mislead you to think a trend change is imminent. See the attached charts which is self explanatory. The 5 min will give you the "current session" trend. Personally I think the wave ...
Noise free system

- onarticus replied Feb 27, 2017
Hi Dim1ne, OAPDave Thanks a lot for posting the indis and the very helpful pdf. I set up my charts yesterday and went through historic 8-9 breakout box. I wanted to clarify how you would have traded this breakout this morning (I'm in the UK). Entry ...
Noise free system
- onarticus replied Feb 23, 2017
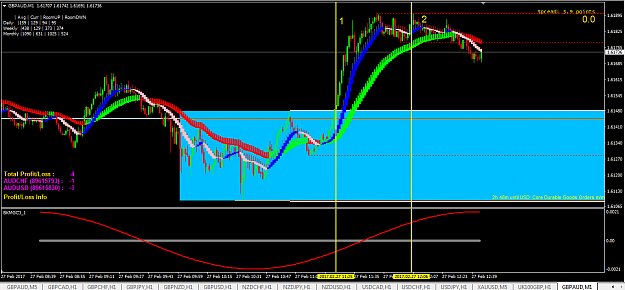
Mizi, Good evening to you Could you let me know your thoughts on the position of the wave for tsking entries at 1 or/and 2? Would you have taken these both? Thanks image
Noise free system
- onarticus replied Feb 21, 2017
Hi, looks odd doesn't it. I took an AJ sell on an up bar which isn't in the rules. Its a tight stop loss but the 5 SMA is pointing down and the upmove looks like a retracement. Its squarely against the rules. I should have pointed that out. Lets see ...
Monthly Profit - Daily Trading using SMA
- onarticus replied Feb 20, 2017
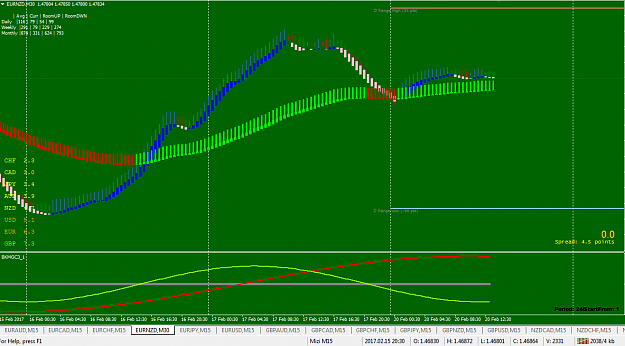
Thanks Mizi, My EURNZD 30min chart doesn't look like yours - I set exit to 50/2. Also do you use green line on the wave indi? And if Undersold the red wave is at the bottom? image
Noise free system
- onarticus replied Feb 20, 2017
Hi Sure, here are week 2 trades. Count gold as / 10 (93 pips). image
Monthly Profit - Daily Trading using SMA

- onarticus replied Feb 20, 2017
Hi Huss Great work! Just looking at GU, I don't see any entry on the 15 min chart. Can you show your trade please? Thanks image
Noise free system
- onarticus replied Feb 20, 2017
Hi I took an AJ long based on the pullback. You can see my TP is at Daily range high, and SL is under the last swing low (if bars were revealed), approx 12 pips. I have some questions: a) What do people if the trade turns against you, turns from ...
Noise free system
- onarticus replied Feb 15, 2017
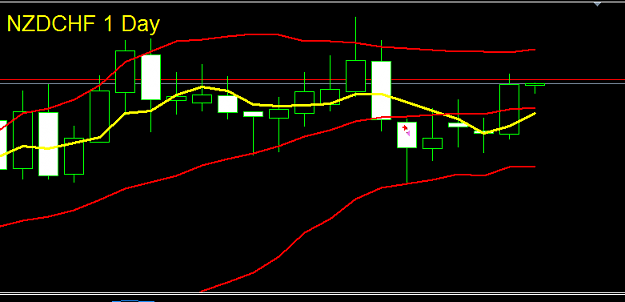
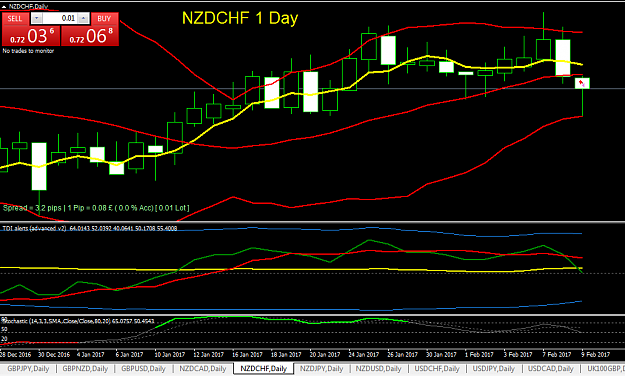
Hi Oddbjorb, Your NZDCHF chart looks nothing like mine? image
Monthly Profit - Daily Trading using SMA
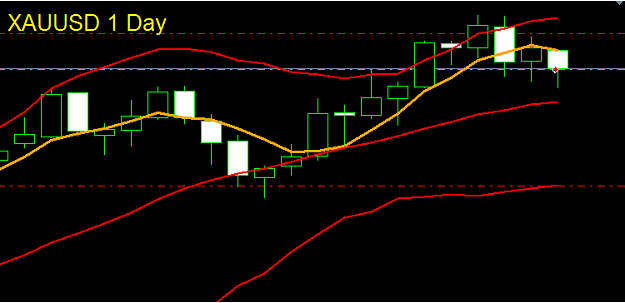
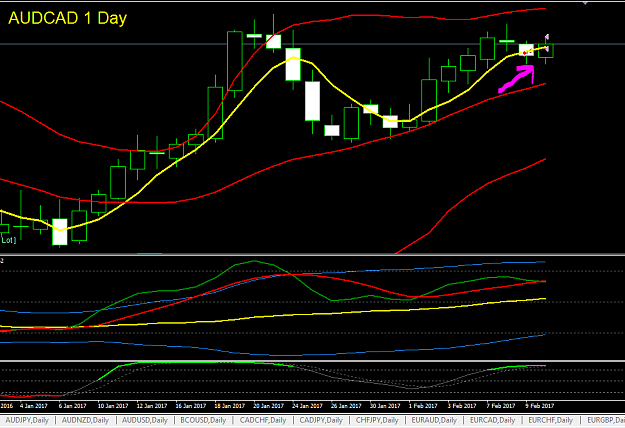
- onarticus replied Feb 13, 2017
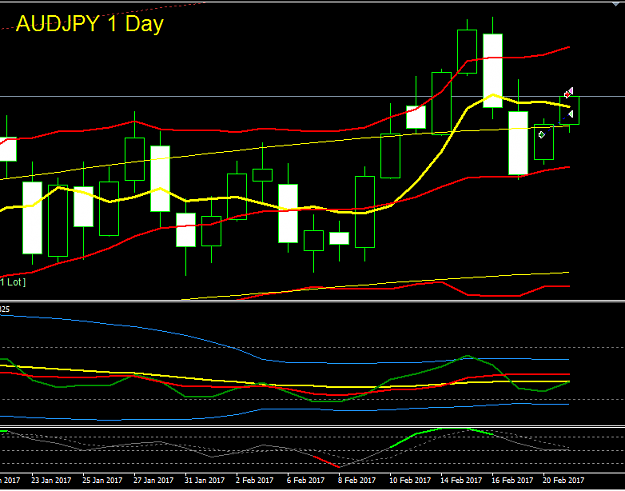
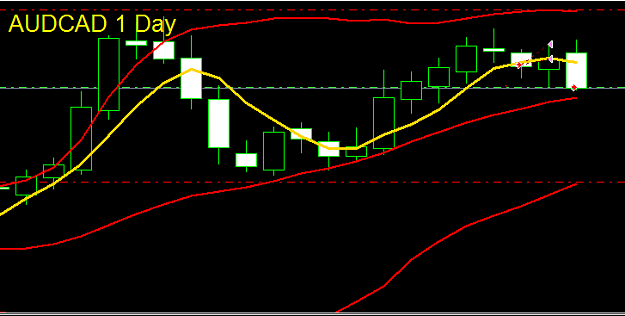
13 Feb 2017 First trade of the week: AUD/CAD SELL 2 Positions GOLD: SELL 1 position image image
Monthly Profit - Daily Trading using SMA
- onarticus replied Feb 10, 2017
Hi, Hope Mizi or someone can help with this. Not all Cross, Pullback, Entries work. See image below. Just wondering if I'm missing something or if there is an additional filter for these? Is this strategy simply take EVERY cross, pullback, enter? ...
Noise free system
- onarticus replied Feb 10, 2017
Lesson learnt - AUDCAD was against the rule for a SELL. 5 EMA was NOT pointing down! That was the loss..... but also I closed early - I am sure AUSSIE will come down soon.....
Monthly Profit - Daily Trading using SMA image
image
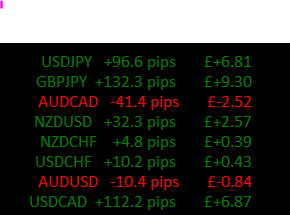
- onarticus replied Feb 10, 2017
Hi I opened 3 pairs earlier today (just before new daily candle) which I closed 8 hours later for a total of +187 pips. USDJPY: 96 pips. I closed early. Why? I broke the rules! I just wanted to bank it. GBPJPY: 132 pips: I closed early. Why? I broke ...
Monthly Profit - Daily Trading using SMA
- onarticus replied Feb 9, 2017
Hiya, sorry for the delay. Yes it looks the same. image
Monthly Profit - Daily Trading using SMA
- onarticus replied Feb 8, 2017
Good morning Mizi, Any idea why chart looks different to yours? image
Noise free system
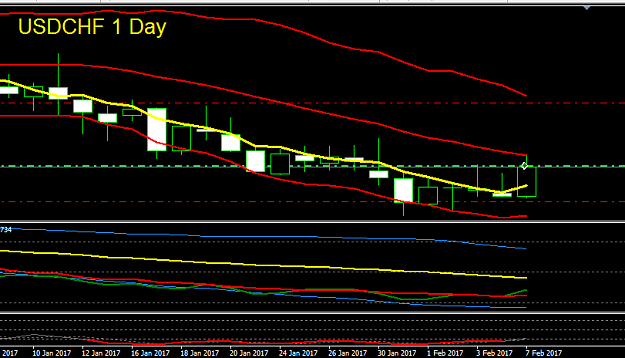
- onarticus replied Feb 7, 2017
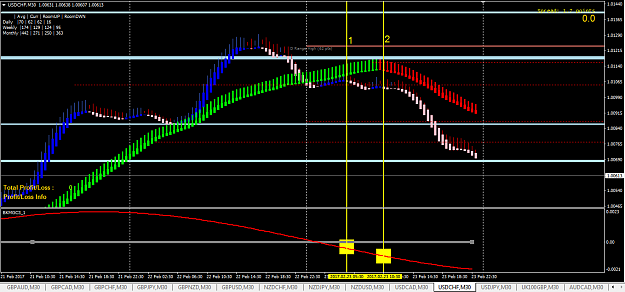
Tues 7th Feb. Took USDCHF - 2 positions. Looks good I think. AUDUSD looks tempting too but 5 ema not pointing down. GBPCAD is only on the middle BB, not for me. Fingers crossed and good luck to all. image
Monthly Profit - Daily Trading using SMA
- onarticus replied Feb 7, 2017
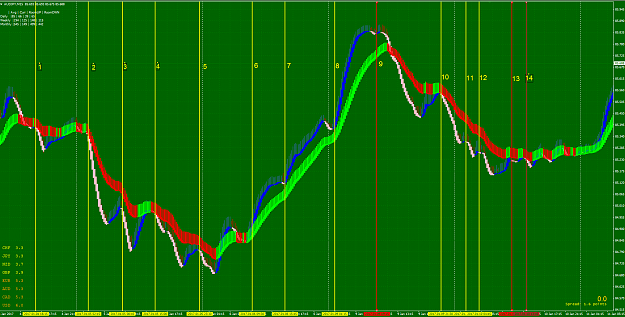
Hi Finding this thread fascinating. Just so that I am clear, are these 14 entries valid in terms of: a) The entry candle, and b) Time of day I'm on UK time. Yellow lines are winners. image
Noise free system
- onarticus replied Feb 7, 2017
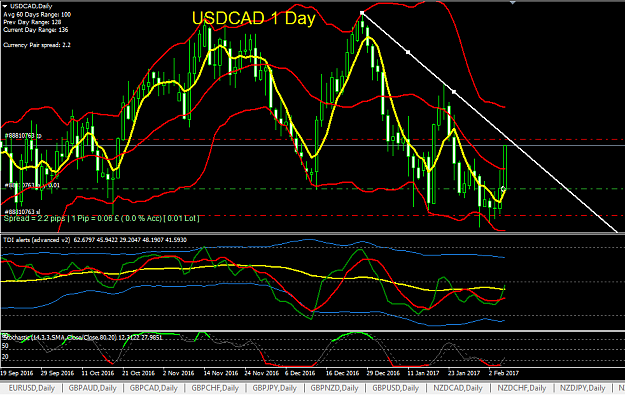
Thank you. I noticed there is a Trendline about to be hit on USDCAD. Are you considering closing it then? As the ADR has been hit already too. image
Monthly Profit - Daily Trading using SMA
- onarticus replied Feb 7, 2017
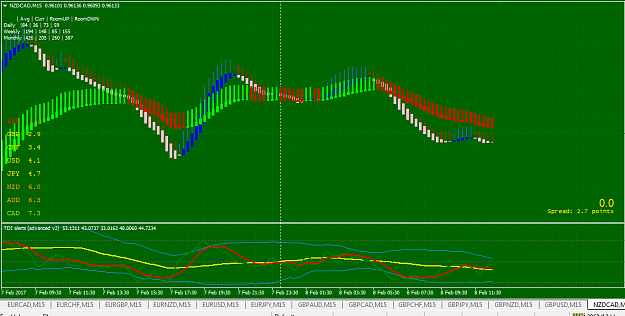
Hi Oddbjorg, Do you have the same chart as me? I didn't get an entry? image
Monthly Profit - Daily Trading using SMA