- Search Forex Factory
- 198 Results (1 Thread , 197 Replies )
-
 olegchartist replied Jun 23, 2020
Let's analyze the clusters to evaluate the investment attractiveness of bitcoin at the moment. Here is the BitMEX:XBTUSD chart. Despite some dramatic declines in May and June, this market continues to hold its uptrend, which is marked by three black ...
Bitcoin technical analysis
- olegchartist replied Jun 18, 2020
Read the messages from Central line Zone
Bitcoin technical analysis
- olegchartist replied Mar 27, 2020
Gold update The gold market is trending upwards this week. The green line [1] illustrates the support for the current bullish impulse. Let's analyze the context. 2] Breakout moment. High volume represents the effort of buyers to overcome the black ...
XAU/USD & XAG/USD - Gold & Silver Traders Thread
![Click to Enlarge
Name: 0Q8y49X[1].png
Size: 175 KB](/attachment/image/3590650/thumbnail?d=1585321602)
- olegchartist replied Mar 1, 2020
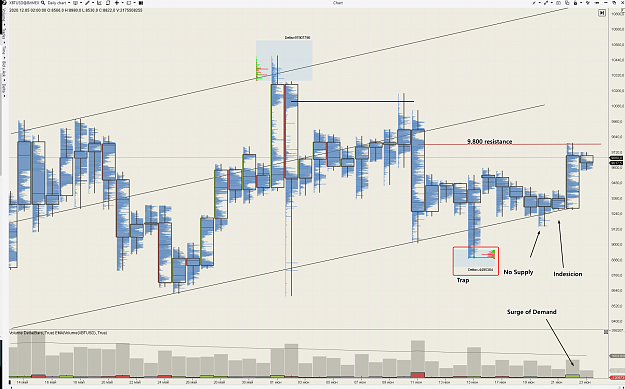
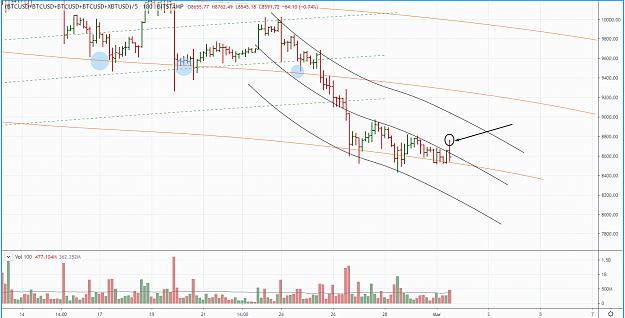
This recent Slkt above 8700 is looking like the preparation to breakdown below 8500 support. If this suggestion is true, price should find the next support around the bottom black line (somewhere around 8100).
The rise of CRYPTO - Bitcoin, LTC, Ether, Dash, Monero
- olegchartist replied Feb 27, 2020
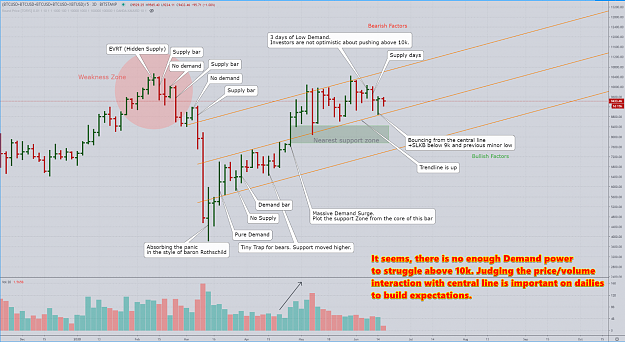
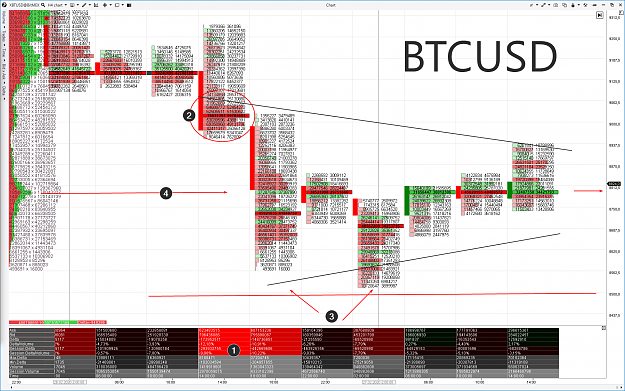
BTCUSD Here is a small bitcoin overview, based on the H4 cluster chart. 1] SuperMassive Supply Bar 2] The heart of the SuperMassive Supply Bar - 9k Zone. 3] However, price bounced up twice from this 8500 level (support) 4] And we have a sideways ...
The rise of CRYPTO - Bitcoin, LTC, Ether, Dash, Monero
- olegchartist replied Feb 27, 2020
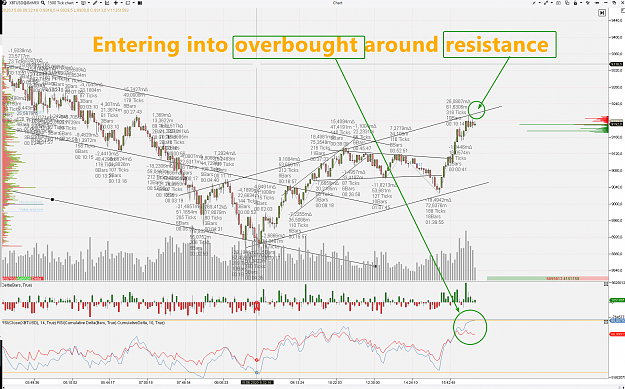
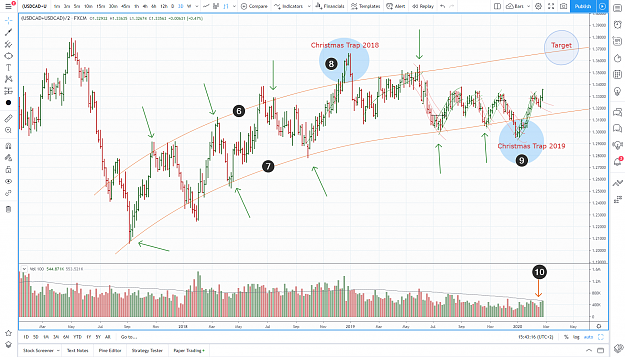
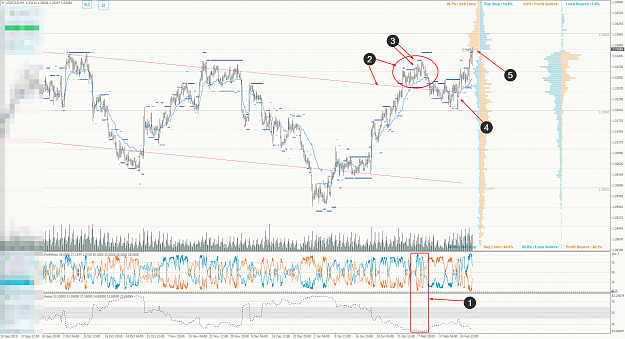
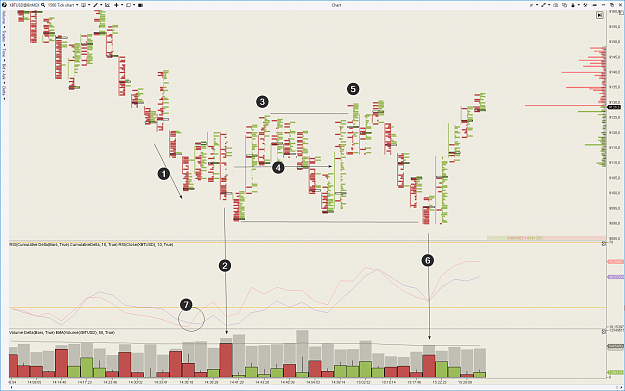
USDCAD Look at this chart. image We had overbought conditions on Ratios (1), overbought instance (price stepped up above the pink trend line - 2), many stop-losses were triggered there (3). All factors were suitable for bears to attempt to ...
USD/CAD
- olegchartist replied Feb 26, 2020
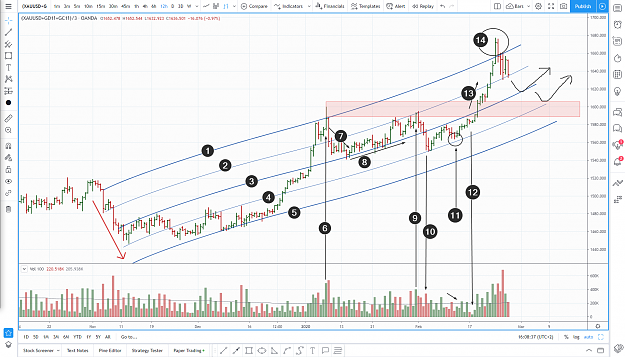
GOLD market overview Here is the 12h chart. I mixed data from 3 sources - CME and MOEX exchanges, Oanda broker. I plotted the 5 wave-lines of the up-trend channel: 1] Overbought 3] Center Trend-line 5] Oversold [2 and 4] - intermediate lines. Note, ...
XAU/USD & XAG/USD - Gold & Silver Traders Thread
- olegchartist replied Feb 19, 2020
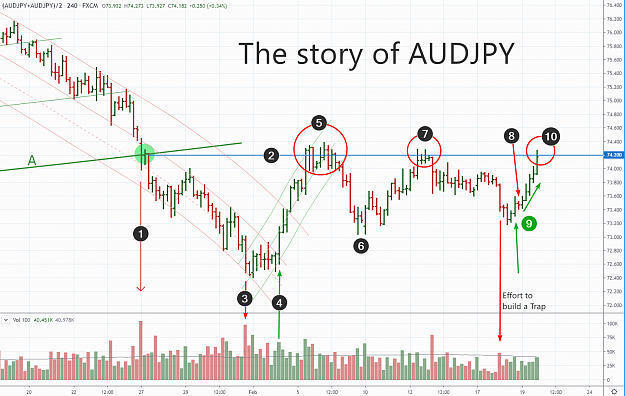
The story of AUDJPY We have major support line A on the background. On the 27/Jan it was broken down. Note the volume [1] during the breakdown (green circle). It represented the effort of bears to beat buyers. Bear got the victory. Plot the line of ...
AUD/JPY
- olegchartist replied Feb 18, 2020
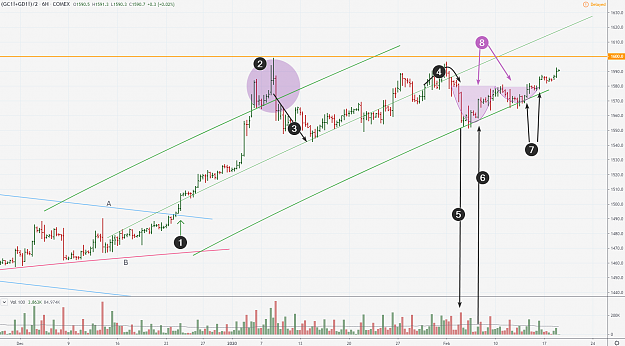
Gold I use the futures market to analyze global GOLD price. We have AB balancing wedge on background 1] After the breakout from the AB wedge (demand bar).... 2] ... price headed toward the overbought zone around 1600 line 3] Pull-back toward the ...
XAU/USD & XAG/USD - Gold & Silver Traders Thread
- olegchartist replied Feb 17, 2020
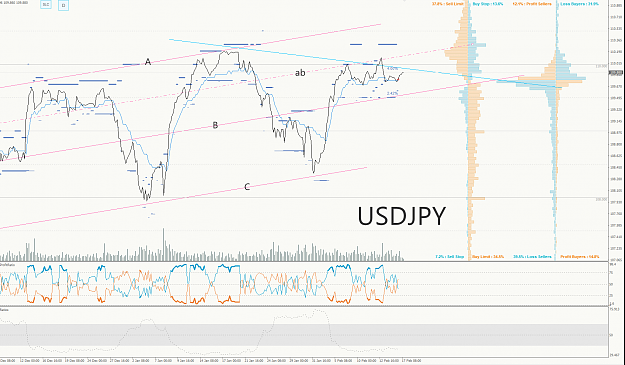
USDJPY Current price is fluctuating between ab and B lines of the valid moderate up-trend. Bouncing up from the B line can help bulls to overcome above blue line of resistance.
USD/JPY Discussion
- olegchartist replied Feb 13, 2020
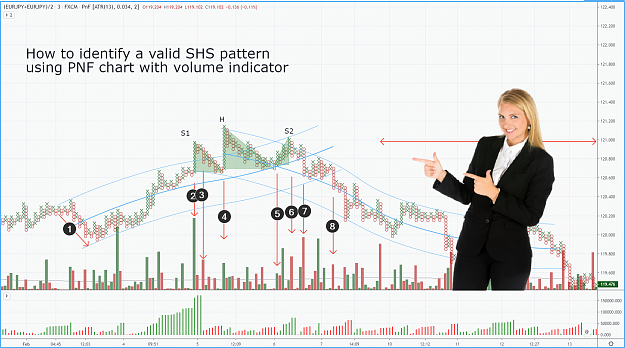
How to identify a valid SHS pattern using PNF chart with volume indicator Example from the EURJPY market. I use the recent SHS (head and shoulders pattern) to demonstrates some not-so-difficult concepts that will give you the great help to ...
How To Read Signals From A Chart
- olegchartist replied Feb 12, 2020
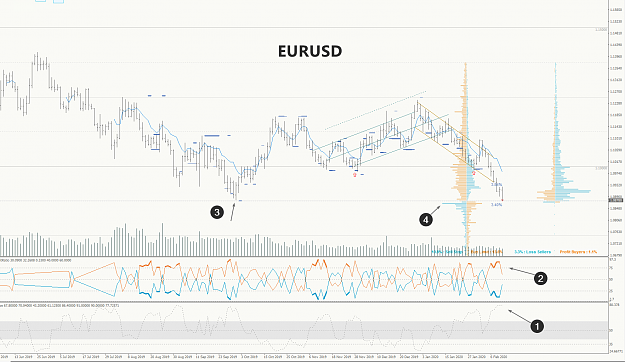
EURUSD PLAN This is a Daily chart of the EURUSD market, data from average forex broker, with Crowd-Behavior indicators. EURUSD is going to found support, and here is why: 1] Ratios are extremely high. It means the bottom is soon. The previous times ...
EURUSD
- olegchartist replied Feb 5, 2020
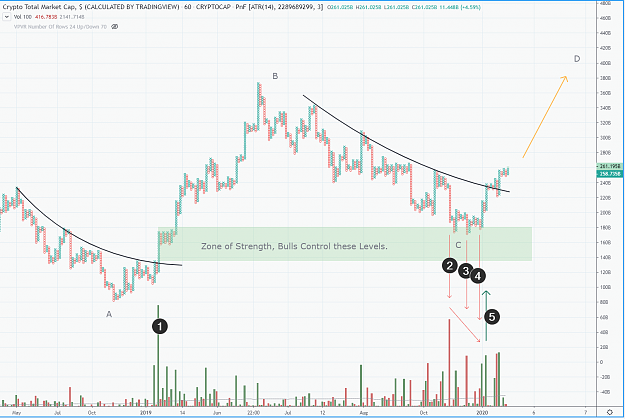
Bullish Points and Figures For this post, I use the point-n-figure chart of Total (Crypto Market index). PNF chart gives another fresh view of the market when analysts mess in bars and candles. Normally, classical PNF charts don't translate data ...
How To Read Signals From A Chart
- olegchartist replied Feb 4, 2020
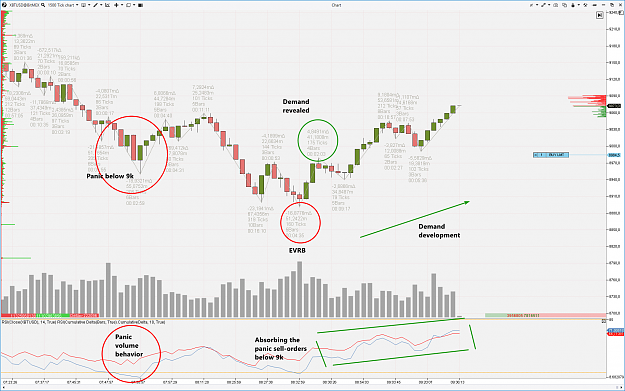
Here is an intraday chart 1] Market panic acceleration 2] Extremely high-spike of selling orders in a narrow range around 9100. Next bar - change in delta. 3] How price can reach this top if selling on 1+2 represents the real weakness? So 1+2 red ...
Bitcoin technical analysis
- olegchartist replied Jan 31, 2020
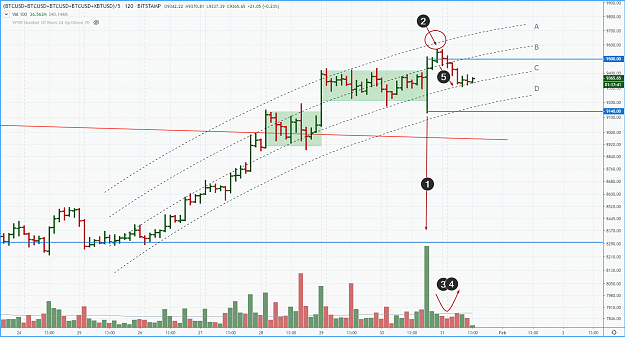
BTCUSD. Fail of bulls = bearish sign. Something has broken in #BTCUSD #BTC As you can see, price is moving inside the bullish channel (4 dot-lines). We had one consolidation (green square 1) during overcoming resistance caused by 9k and red line ...
Bitcoin technical analysis
- olegchartist replied Jan 30, 2020
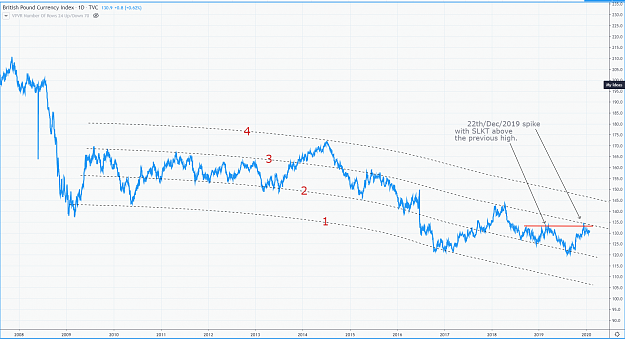
GBPUSD Extra-Big Picture View During the last months, the biggest event on the GBP markets was extra-wide price spike on 22th/Dec/2019 amid Exit-Poll news. I don't want to dive into fundamentals and relationships between exit-polls and price. The ...
Cable Update (GBPUSD)
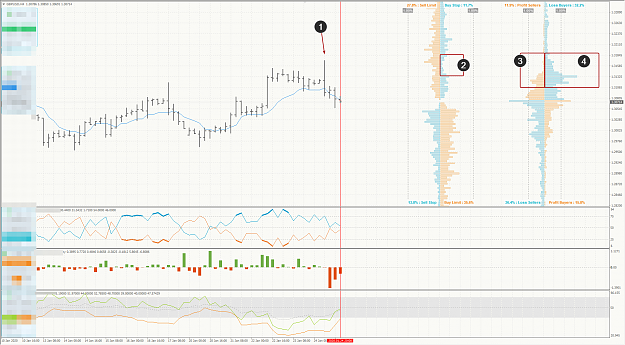
- olegchartist replied Jan 25, 2020
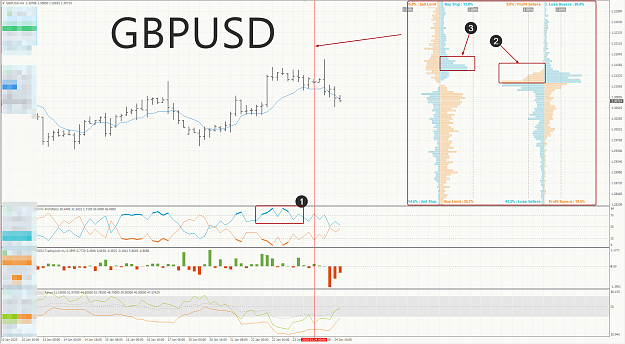
Here are two GBPUSD charts. I will use them to provide an example of real market nature. If you will know the genuine cruelty of market character, it will be easier for you to create trading ideas. You will understand price movements more properly ...
Cable Update (GBPUSD)
- olegchartist replied Jan 23, 2020
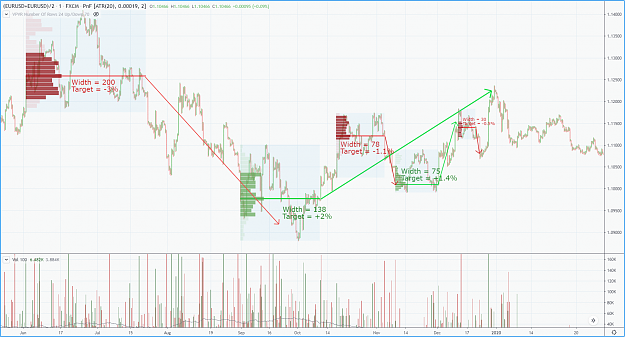
How to project targets? The wider accumulation - the bigger advance. The wider distribution - the bigger decline. This is Wyckoff style. Use PNF chart. For example, on EURUSD chart: 1 column of accumulation = approx 0.015% of future advance 1 column ...
How To Read Signals From A Chart