- Search Forex Factory
- 19 Results
-
 nms4716 replied Feb 17, 2010
Double Bottom 5m — I saw someone post or ask if this was a double bottom formation on 5m chart... the below picture says it all on how to determine this if you are currently looking at the 5m chart to go long. The "neckline" for the current 5m ...
EURUSD
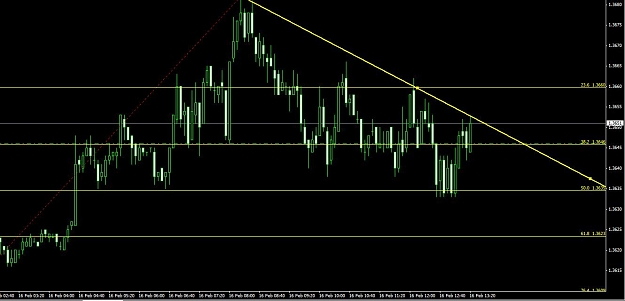
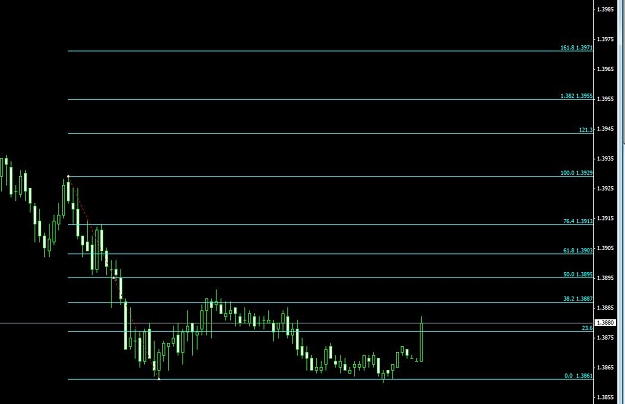
- nms4716 replied Feb 17, 2010
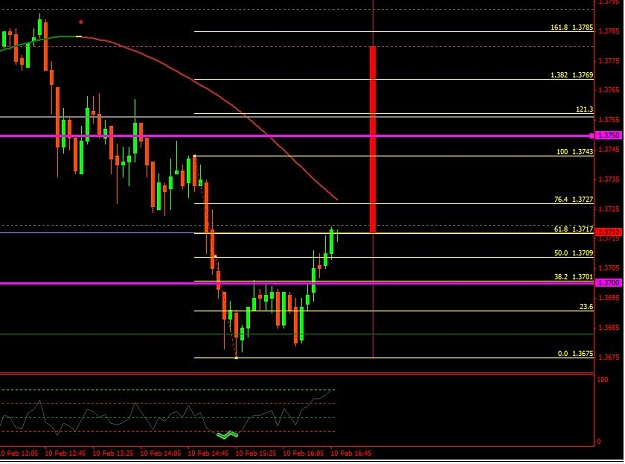
Well if you are looking at it from a Fib perspective, 50% retrace from the bottom of last big move is 1.3693 but is the move over is the question....
EURUSD

- nms4716 replied Feb 16, 2010
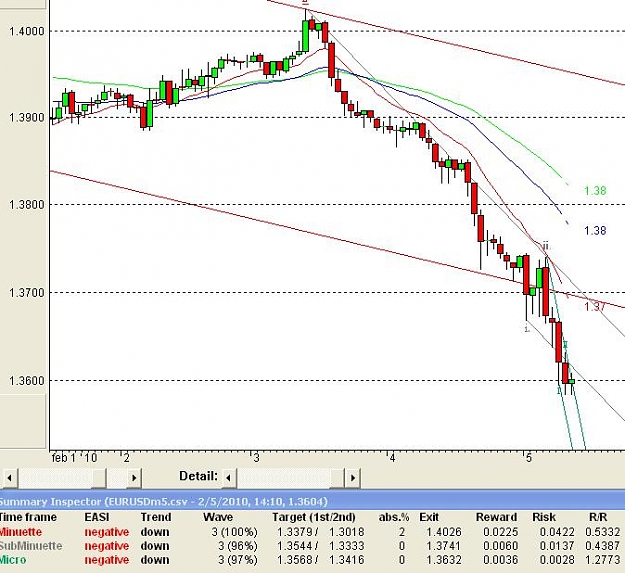
Could we be heading down.... bit of a down trend here on 5m.... also sitting on Fib
EURUSD
- nms4716 replied Feb 11, 2010
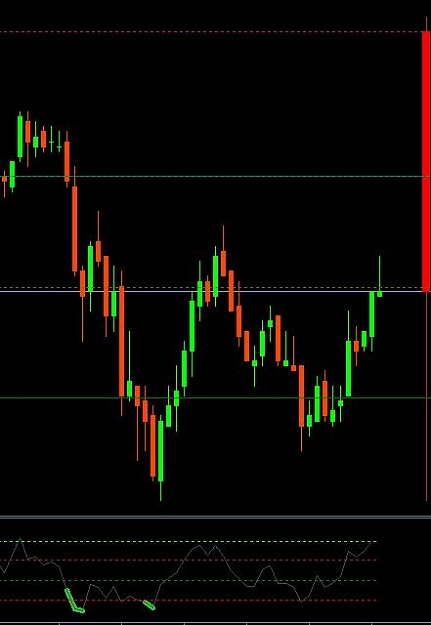
Hammer — Notice the Hammer on the chart, usually means change of direction if you follow candles.. 50% retrace is 1.3694.. Not saying we are headed there just FYI.. (dotted lines are MS2 and YL)
EURUSD
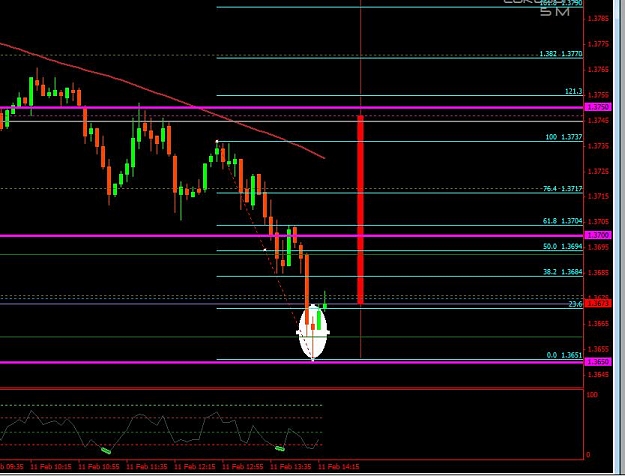
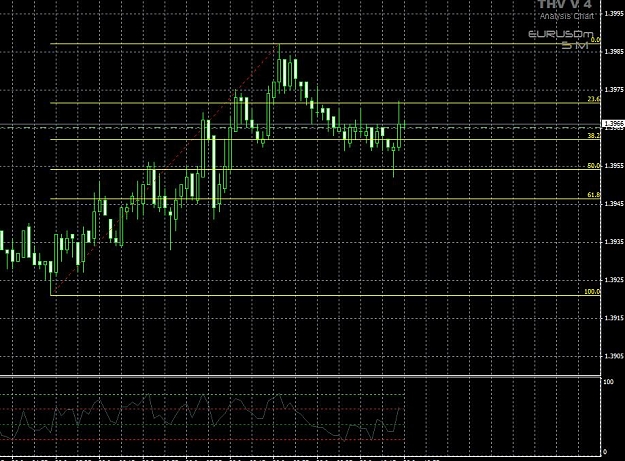
- nms4716 replied Feb 10, 2010
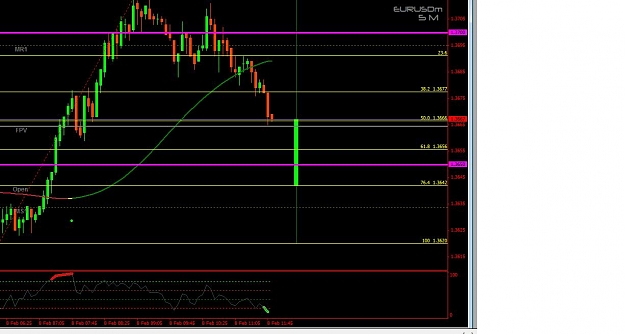
Sitting on 61.8% retrace from last move on 5m chart with RSI overbought.... perhaps down we go again soon.. (dotted line is MS1)
EURUSD
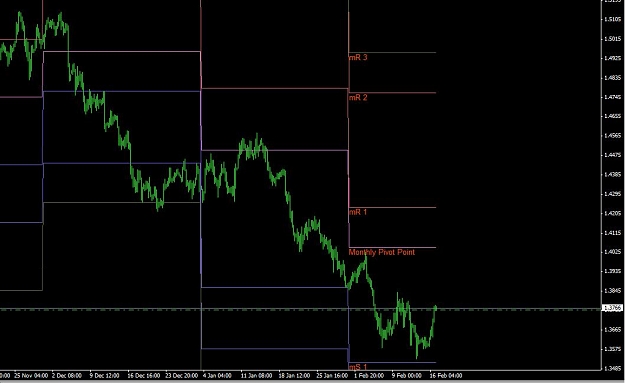
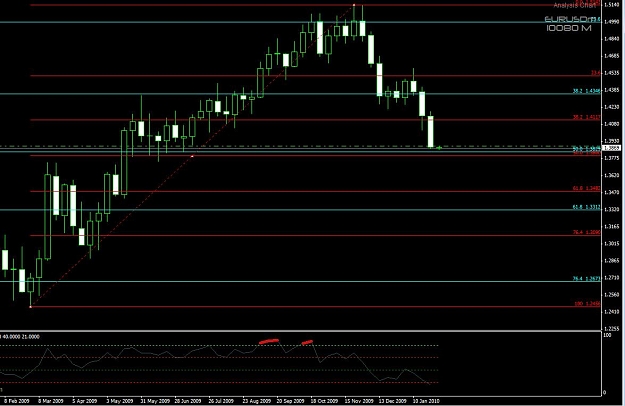
- nms4716 replied Jan 31, 2010
Weekly — Just curious what you guys think of this situation. We are sitting on a FIB 50% retrace line as of right now and the RSI on the weekly chart is extremely oversold... Thoughts? Reversal? not stating an opinion but what is it saying..
EURUSD
- nms4716 replied Jan 31, 2010
HAHAHA!! Nice one Gator... working on some Fib here, would you say since we have found some support on the 1.3860 level we could see a decent pull back to 1.3895 before a plunge downward?
EURUSD
- nms4716 replied Jan 29, 2010
Gator SORRY my bad got you confused with someone else.. anyways here is my Fib chart for what its worth.. bounced off of 50% retrace and also an "open" hammer 2 candles ago...
EURUSD
- nms4716 replied Mar 23, 2009
First Day! — Ok this is my first trading day using the THV3, Cobra can vouch for that because he answered a few questions i had about setup over the weekend. Woke up early for the London Session.. and took the short where the red dot/arrow ...
THV system, final edition
- nms4716 replied Mar 19, 2009
Double Top?? — Would anyone agree we are forming a double top here off of yesterday and todays rally?..does not look like a divergence. It has hit the Fib 1.382 Profit Level perfectly here. Any thoughts?
EURUSD
- nms4716 replied Mar 18, 2009
5 Min Chart — If your scalping (i am new) this is what my Fib looks on my 5 min chart. I am short @ 1.3123, (looked like a double top)T/P @ 1.3075 area. Just curious if anyone agrees, I am in a Demo account and practicing. Thank you for any ...
EURUSD
- nms4716 replied Mar 17, 2009
[quote=NuckingFuts;2610282]For those of you that follow candlestick patterns, it's looking like we could well have a confirmed inverted hammer and bullish engulfing candle if this monthly bar closes above 1.2675. It would be a little more picture ...
EURUSD
- nms4716 replied Mar 17, 2009
Current Fib on 15 Min Chart — Here is what we are dealt with now on the 15 min chart using Fib Retrace. Thinking Short atleast to 1.2975
EURUSD
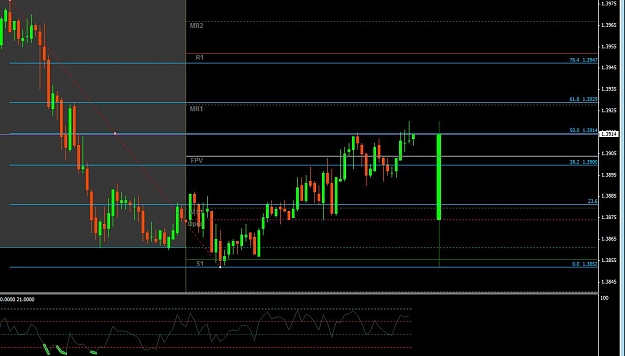
- nms4716 replied Mar 17, 2009
Marcow Request answered — Marcow, here you go. you can see the 2660 here as you requested. from this monring.. FYI, my trading platform is 5 hours ahead of my time zone, EST, the trade was made @ 9:42am @1.2947. Thanks for the help CDR.
EURUSD
- Posts by Member Search: 'nms4716'