- Search Forex Factory
- 22 Results
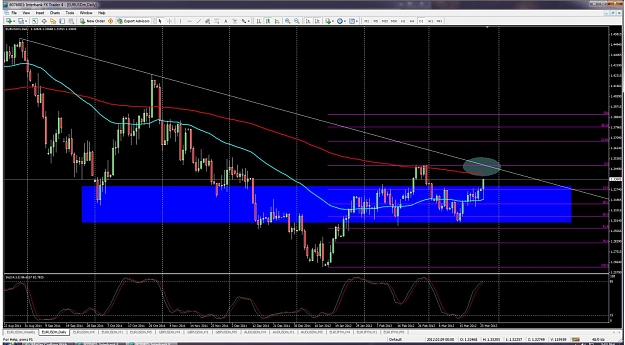
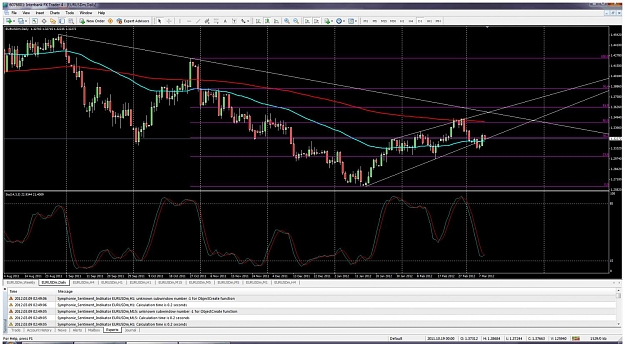
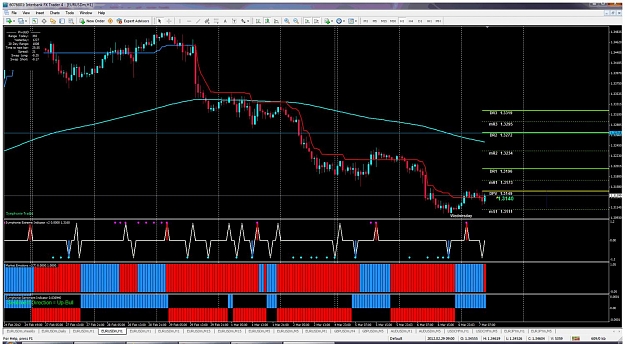
- njfx replied Mar 26, 2012
Approaching Important Resistanence Points — Looke like we are approaching the recent highs from the end of Feb on E/D, also 200 day MA, and decending trend line, and Sto is getting ~85. See ellipse area on chart.
Symphonie Trader System
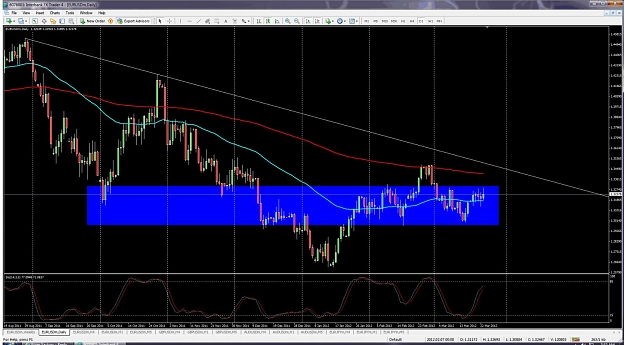
- njfx replied Mar 23, 2012
3261 is also the daily resistanence also the price has been using this area as a support & resistanence area for a few months now.
Symphonie Trader System
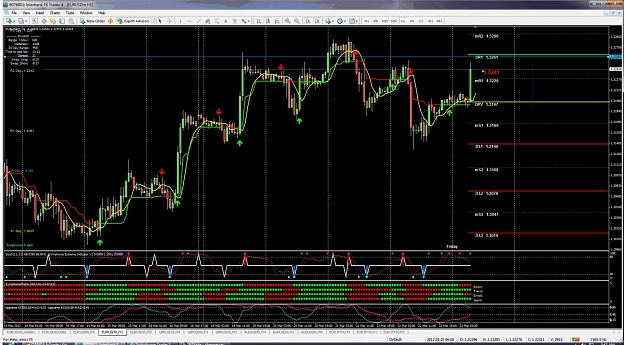
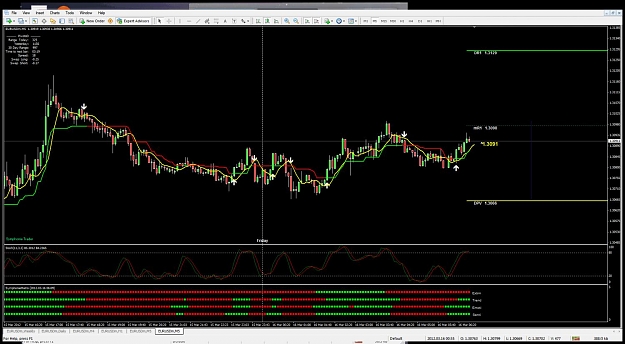
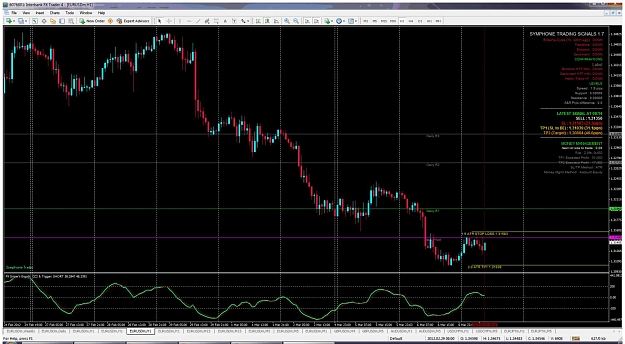
- njfx replied Mar 23, 2012
Approaching Daily Pivot R1 and an area of resistance, will be looking at the 5 min for a reversal possible.
Symphonie Trader System
- njfx replied Mar 16, 2012
4 hr chart trendline — I am soemtimes overly cautious, br careful with longs here there is a mid daily pivot at 3098 the Symphonie trendline spent a couple of hours there yesterday afternoon on the 5 min chart and 3100 can provide resistanence ...
Symphonie Trader System
- njfx replied Mar 9, 2012
If you go to the Insert menu there are a number of Fibs there. A retracement Fib for the previous days price action is one used quite often (from the previous days highs and lows). On a daily chart you should look at trend lines and have a fib for ...
Symphonie Trader System
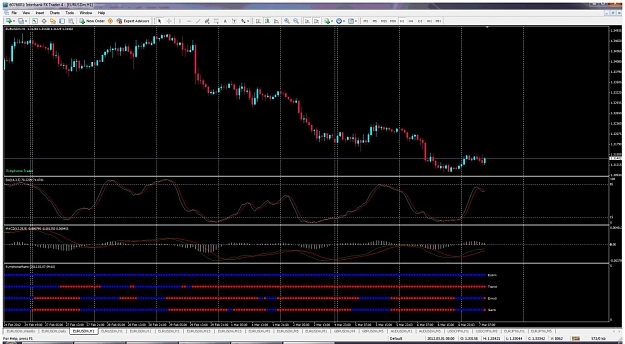
- njfx replied Mar 7, 2012
Question about 'versions' of Charts for Symphonie — I was going to look at at different versions of the Symphonie Chart. Om each case I have loaded then onto a 1 hr chart. I used the 1,3,2 setting for the extreme indicator in each case and ...
Symphonie Trader System
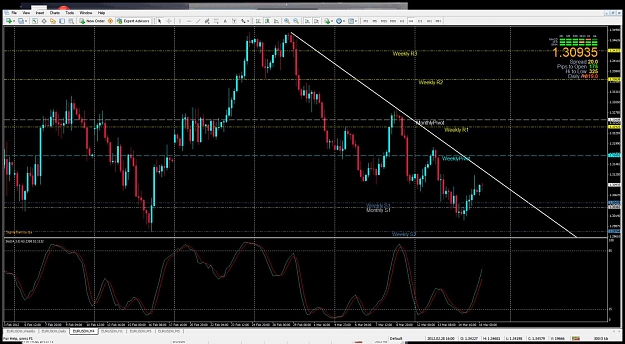
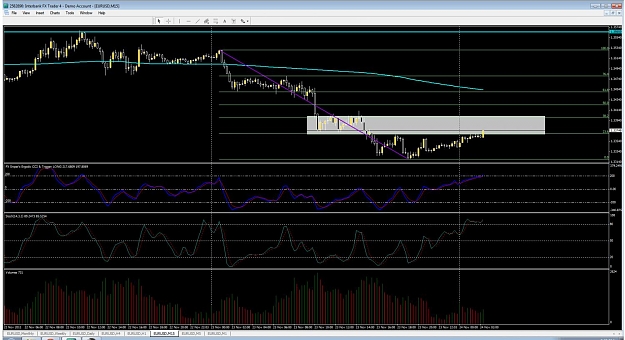
- njfx replied Nov 23, 2011
Good chance of getting to that area at least, even if it does down today. But there should be some Resistance there the daily pivot is at 3397, the 38 fib is at 3399 and of course the 3400 price, so we could see some issues getting over that, the ...
EURUSD
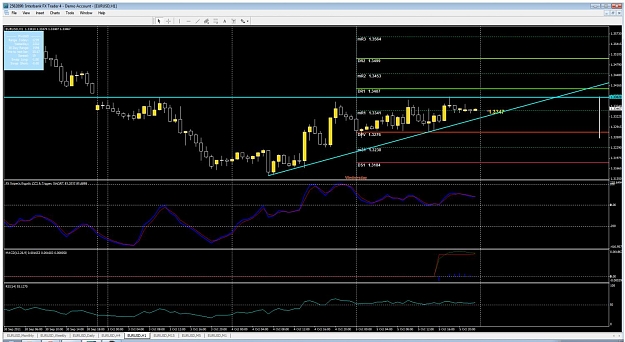
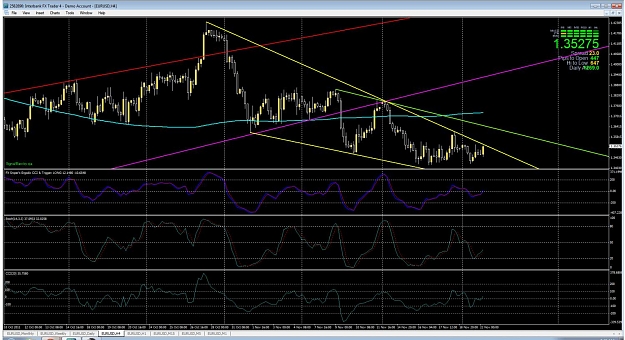
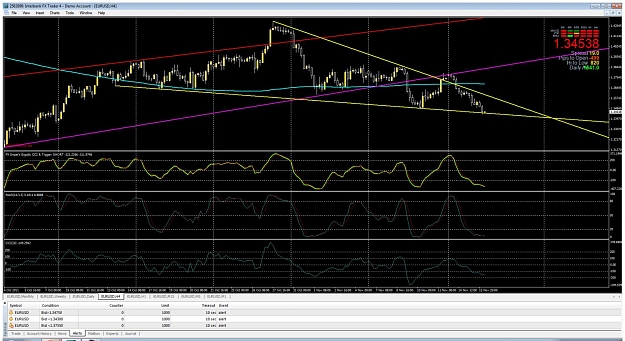
- njfx replied Nov 22, 2011
Seeing resistance around 3540 price + trend line on 1 hr chart = possible Big Ben Frankie, pullback to Daily pivot which is support of rising trend line from your chart
EURUSD
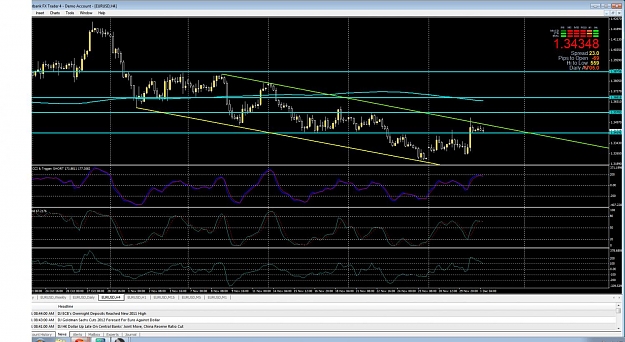
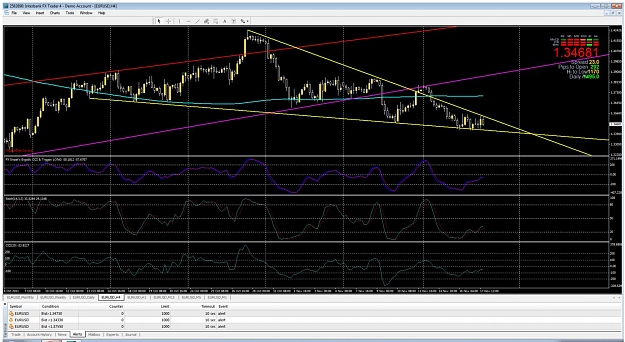
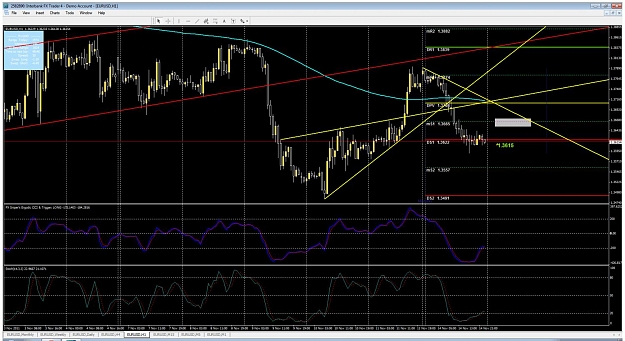
- njfx replied Nov 17, 2011
Things are getting tight. Should be interesting in the next couple of days, just scalp until the breakout occurs: Triple bottom on the 1 hr chart, falling wedge on 4 hr:
EURUSD
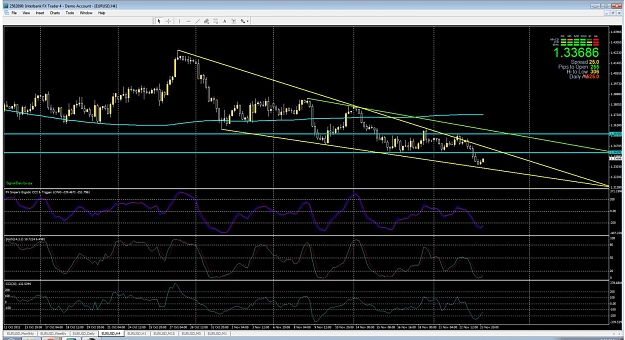
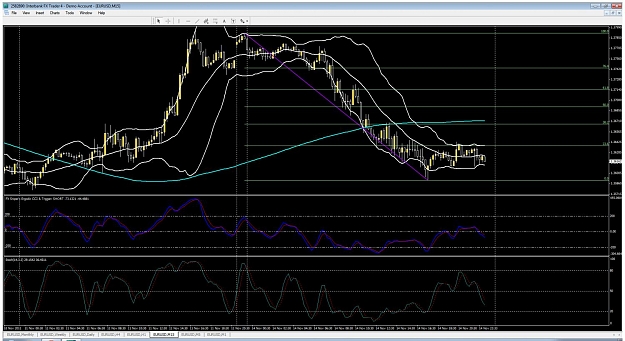
- njfx replied Nov 16, 2011
Currently things look a bit oversold, German & UK bond auctions today, daily Pivot s1 and Monthly pivots2 holding, will be keeping an eye on those:
EURUSD
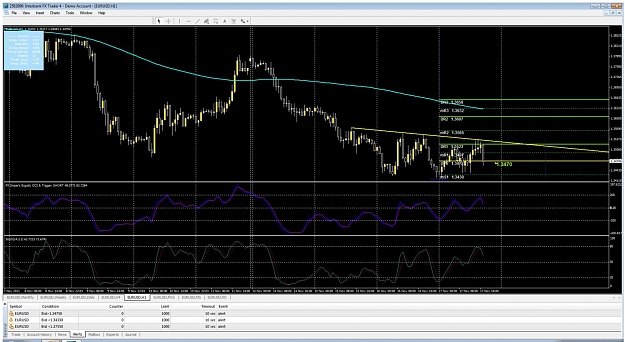
- njfx replied Nov 14, 2011
Yeah I am also looking for a retracement to the 366x/377x level. the daily fib has the 38 retracement level @ 3667 there and the Montly Support Pivot level is 3665.
EURUSD
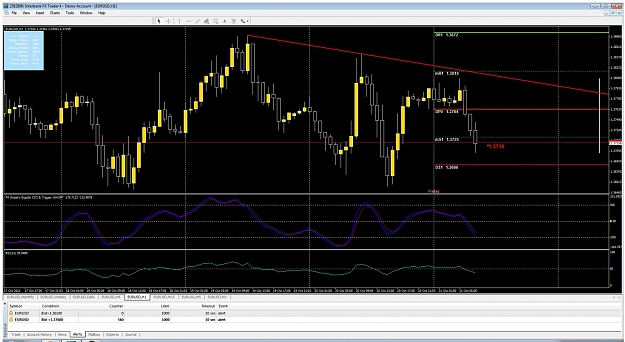
- njfx replied Oct 28, 2011
Euro Shorts Barely Budge — Wonder how long they can support the prices, We could mone into the 4330 area then the Euro hits the fan? url
EURUSD
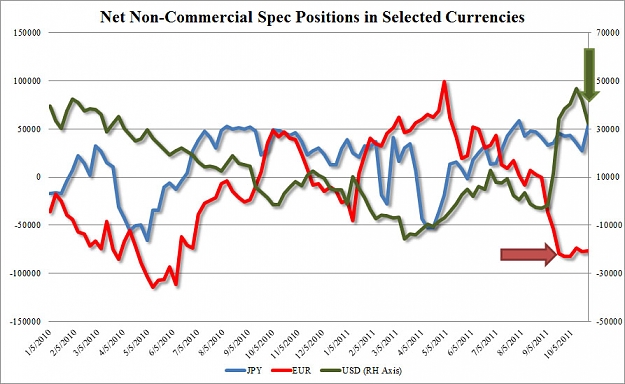
- njfx replied Oct 27, 2011
The Eu has been in a rising triangle for this month we are currently near the top of this pattern.
EURUSD
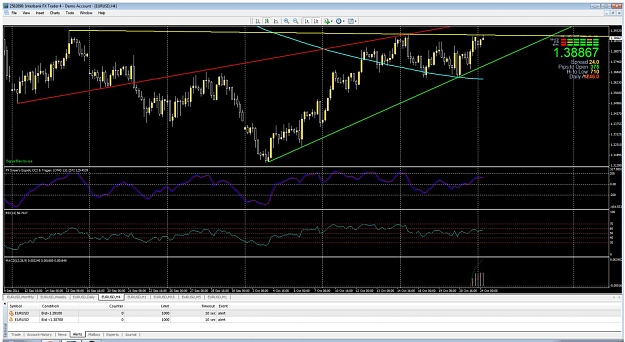
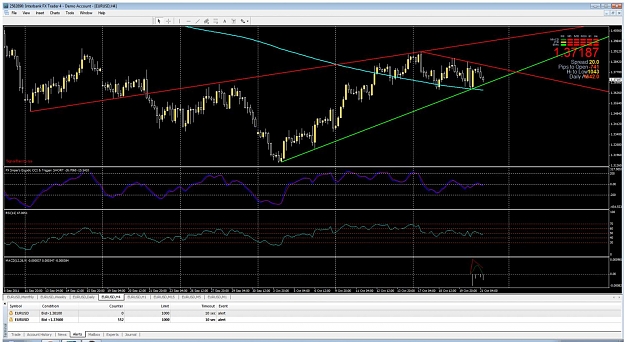
- njfx replied Oct 24, 2011
I went short at 139.03 Yellow Resistance trendline at 1.3906. orig stop loss at 1.3816 (see high fro 17 Oct), stop loss moved now to 39.02 Tp at 1.3806, MS1 pivot pt at 1.3800. Going to sleep now. MKt to volitale with EU meetings don't take chances.
EURUSD
- njfx replied Oct 21, 2011
The area around 368x will be important today Daily pivot support there also support trend line for past 3 weeks there also.
EURUSD
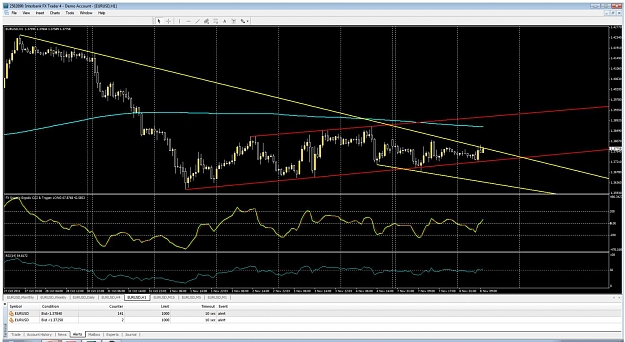
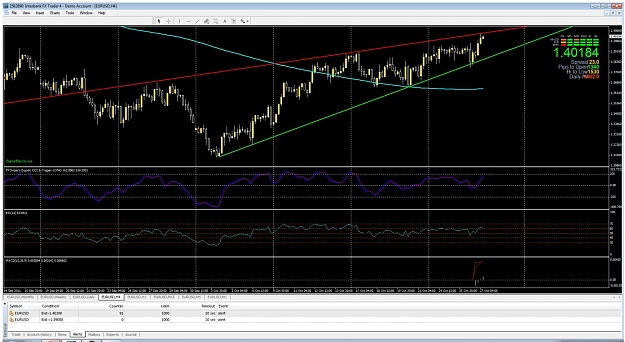
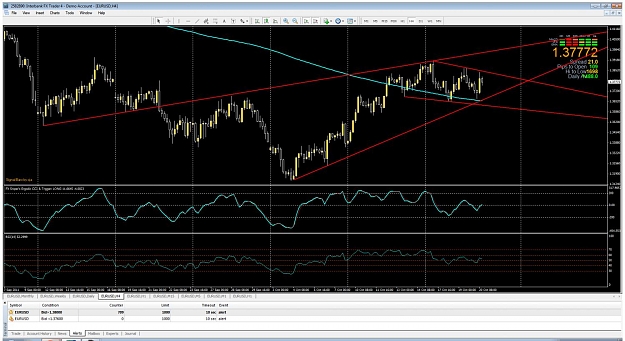
- njfx replied Oct 20, 2011
My 4hr view — Couple of different rising/falling wedges on 4hr resolution in the next few days:
EURUSD
- njfx replied Oct 5, 2011
Waiting for short — Well I am looking at the price this week and seeing a triangle. Will wait to see if it breaks low and go short.
EURUSD