- Search Forex Factory
- 6 Results
- neojigi replied Feb 1, 2013
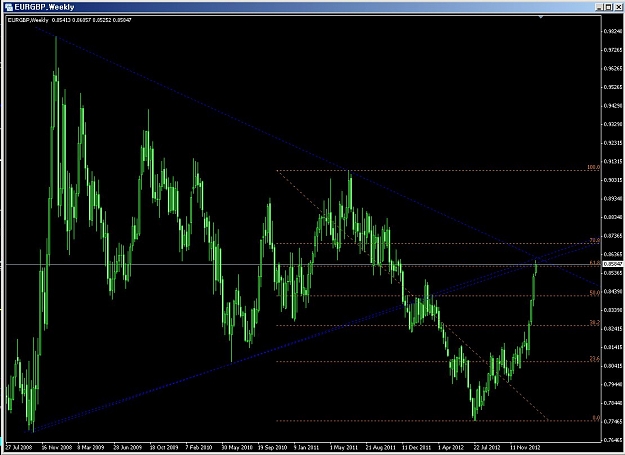
hey guys. how do you think this EurGbp weekly chart? i'm rookey, so i question to 'experienced traders'
EURUSD if eurgbp rejected upper t/l, then eurusd go down? there is upper t/l & fibo 61.8 level. in my newbie think, it drag e/u down. is it correct?
- neojigi replied Jan 31, 2013
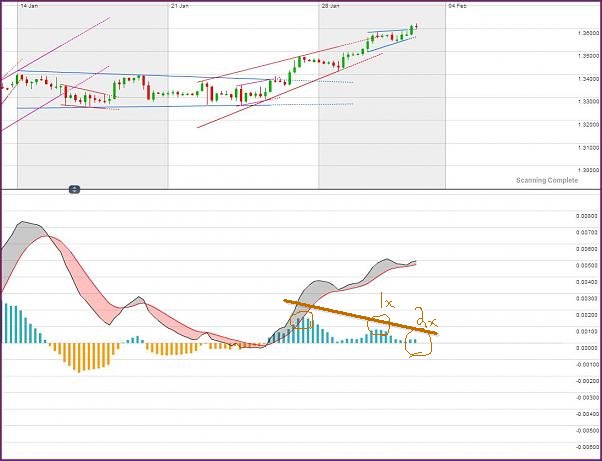
yeah, me too. but, if a few hour flat action continue... then 1 hour OsMA will crossed. 1 hour OsMA signal is useful to Scalp
EURUSD and, in your chart, you can see Bearish Divergense 2x. 2x divergence is more meaningful.
- neojigi replied Jan 31, 2013
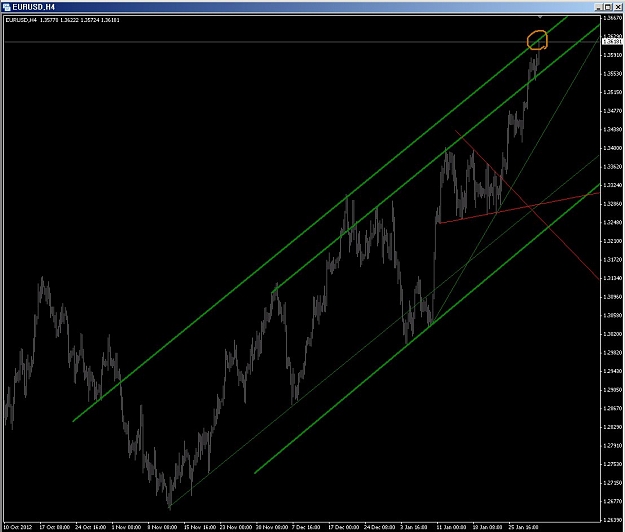
in this last channel line... if flat action or OsMA crossed in this area, i will some sell.
EURUSD
- neojigi replied Jan 31, 2013
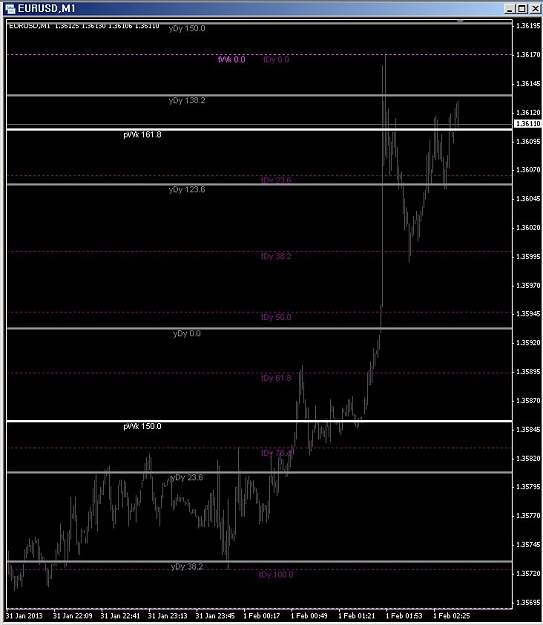
i want to share my self-upgraded indi. it is multiple purpose fibo indicator. it has... - previous week's fivo - previous day's fivo - this week's fivo (if high or low price change, fivo level auto changed) - today's fivo (same too...) - previous ...
EURUSD
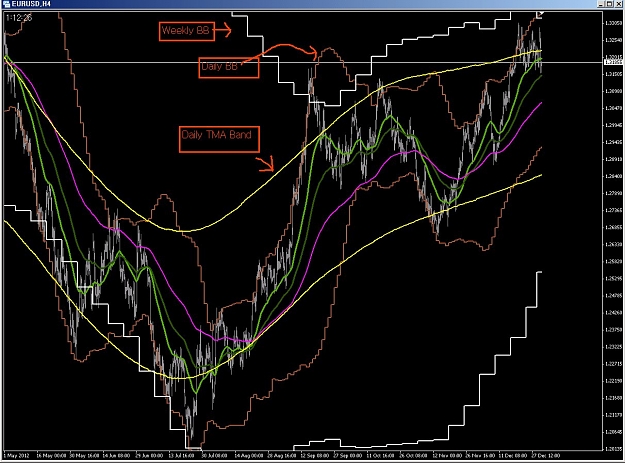
- neojigi replied Jan 2, 2013
How is my view to next week? Price touch Weekly BB UpperLine twice. Price is in TmaBand Upperline area. 4Hourly ema's has bubble. So, I expect price go down... - at least Daily BB LowerLine (1.294x) - if overshoot... TmaBand LowerLine (1.285x) ...
EURUSD
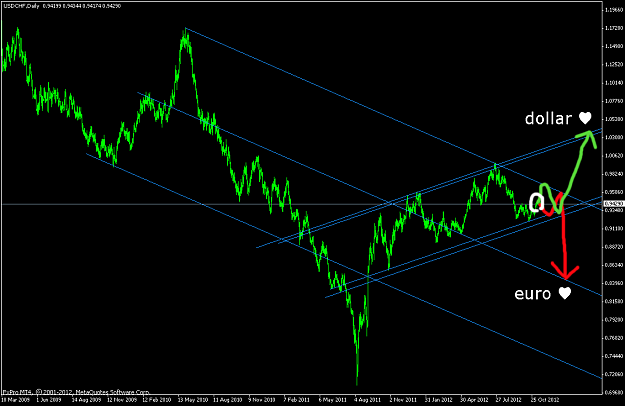
- neojigi replied Nov 16, 2012
what do you think this USDCHF chart? USDCHF is in triangle area. a few days... - up broken --> usd smile, euro cry - dn broken --> ...... but... eurozone is bad status. so i think up broken
EURUSD
- Posts by Member Search: 'neojigi'