- Search Forex Factory
- 45 Results (3 Threads , 42 Replies )
- marecki replied Mar 2, 2021
Isn't it a kind of martingale at this point? image If it was simple averaging the result should be around $0, but if I understand correctly it was closed at +$50. Therefore I assumed it martingale.
Opinions and Experiences with Hedging and Martingale
- marecki replied Mar 1, 2021
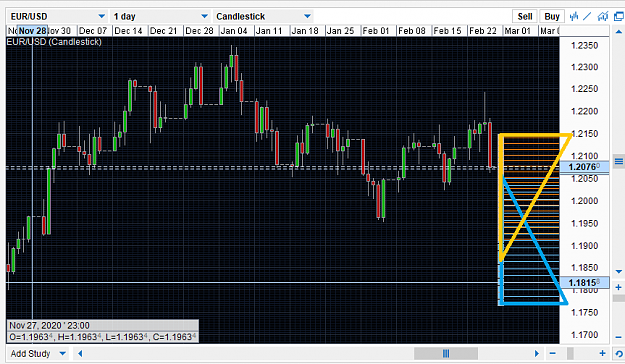
Yes, always triangle image but the truth is that in practice it is more messy actually image
Opinions and Experiences with Hedging and Martingale
- marecki replied Feb 28, 2021
Now I started to wonder if we are not trading more-less the same way. That is actually what I am doing with my strategy. 1. My long position shall increase when the price goes down and decrease when it goes up. 2. Also my short position shall ...
Opinions and Experiences with Hedging and Martingale
- marecki replied Jun 29, 2019
Hi, I promised that I will show some tools that make trading like a strategy game. VEEFX in his post (that has vanished very shortly) told something I liked very much. He called this way of trading: "a price trapping". He was so much right! This is ...
Trading multipair triangles, no stoploss
- marecki replied Jun 11, 2019
Hi cubicpip, You didn’t find any youtube movie about trading this way, because I think there are very few people doing this. ( The methods and strategies I am presenting in this thread are made up by myself. At oanda V20 REST API ( url ) site there ...
Trading multipair triangles, no stoploss
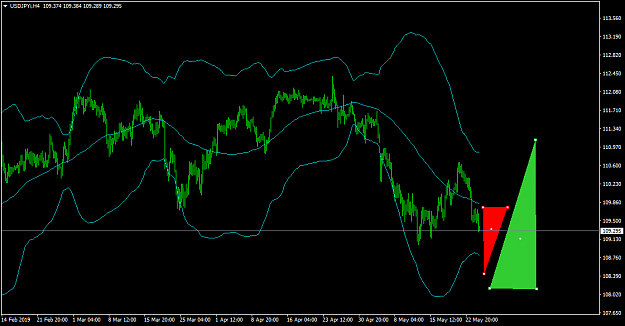
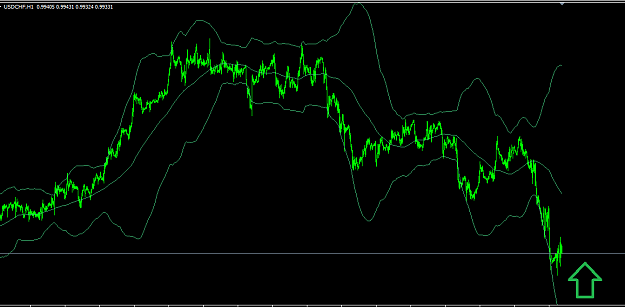
- marecki replied Jun 4, 2019
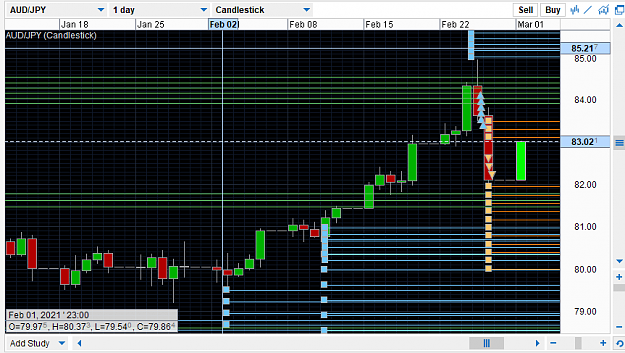
For example USDCHF h1 looks much like has now pression UP. image I'll put some orders up.
Trading multipair triangles, no stoploss
- marecki replied Jun 3, 2019
I was thinking about adjusting the density of the grid, but this would require total rebuilding my spreadsheet which is designed based on equal distances between orders. So as for my use, this idea waits for better times. If it's about a price or ...
Trading multipair triangles, no stoploss
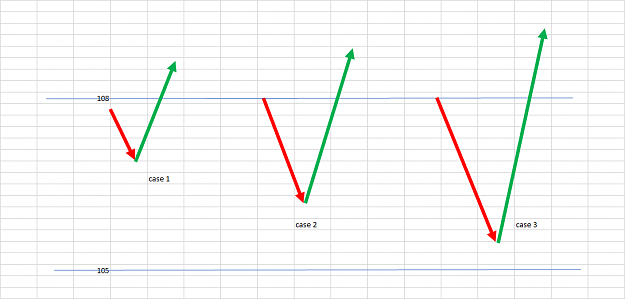
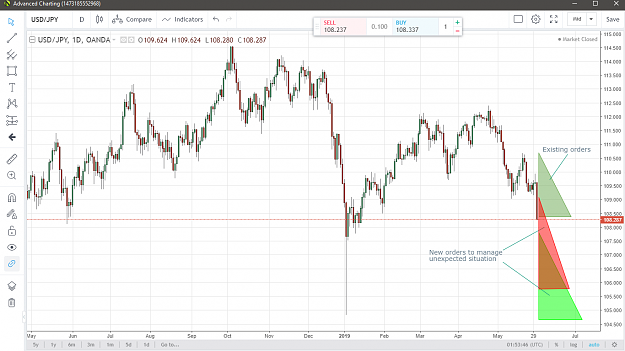
- marecki replied Jun 3, 2019
Hi yonnie, Honestly, I am not sure what is gonna happen, but I still expect some move up. The question is where is the local bottom. Last week has ended at 108.2. Looking on a chart level 105 looks quite achievable. Achievable doesn't mean that for ...
Trading multipair triangles, no stoploss
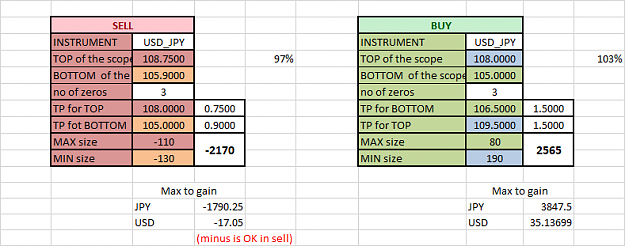
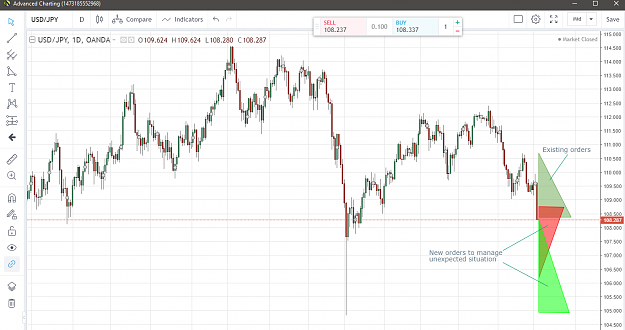
- marecki replied Jun 2, 2019
Continuing #Post 55 I decided to send following orders: image image we'll see how good decision it was. Other trades will be taken on other pairs. I'll try to find some pair that is likely to oscillate.
Trading multipair triangles, no stoploss
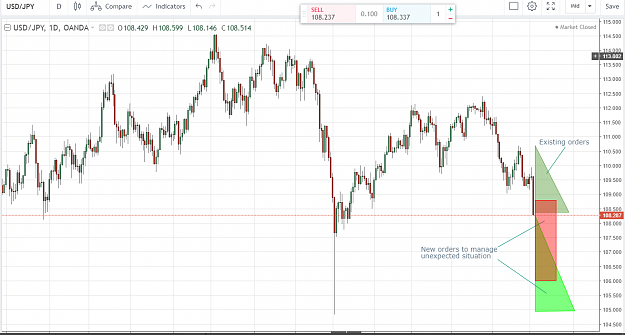
- marecki replied Jun 1, 2019
As I wrote on the end of #Post 51 USDJPY looks like need some management - I now trade it long and it looks like going more down. As I still have available margin I don't need to reduce position which would actually make some drawdown. Having margin ...
Trading multipair triangles, no stoploss
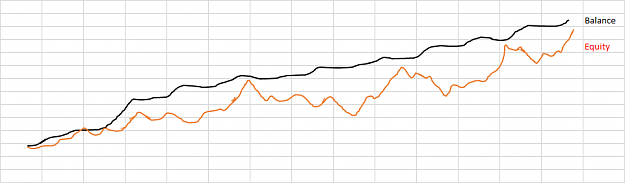
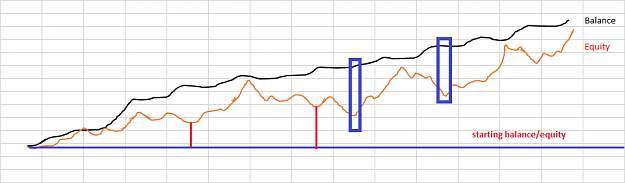
- marecki replied Jun 1, 2019
Let's take a look on another example of equity-balance chart: image I put also account's close out level on this chart. This is to show what we should be avoiding when trading grids. If we see such situation as above the reason of it might be one ...
Trading multipair triangles, no stoploss

- marecki replied Jun 1, 2019
Hi yonnie, Thank You for Your opinion, nice to hear. You are absolutely right, 100% in 8 months rarely comes without pain or without stress. Maximum DD (if we talk about consecutive losses) was quite low, maybe around 100$ when account Balance was ...
Trading multipair triangles, no stoploss
- marecki replied May 29, 2019
I have organized a trade explorer. I closed all positions that I could. I left only sugar and soybeans that couldn't be closed due inactive to market hours. I decided to leave it, as maybe it is gonna be good example of how to manage losing trades ...
Trading multipair triangles, no stoploss

- marecki replied May 27, 2019
Hi Zotium, Here is graph You are asking for. I didn't think much about it, but this is what I was calling my balance curve. image
Trading multipair triangles, no stoploss
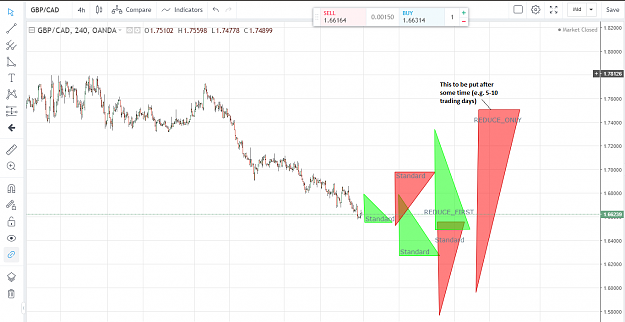
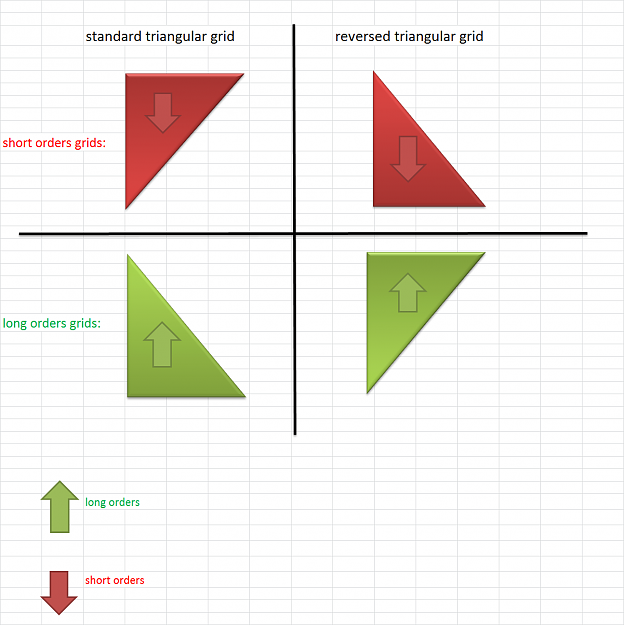
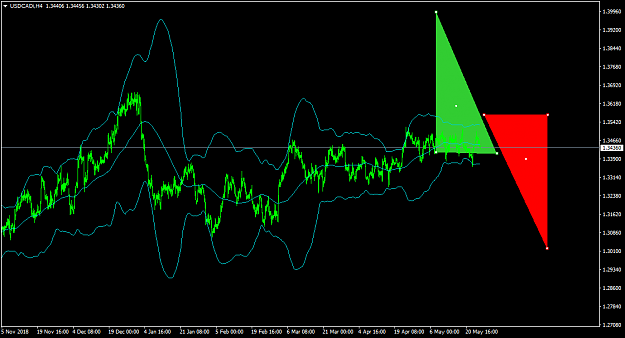
- marecki replied May 27, 2019
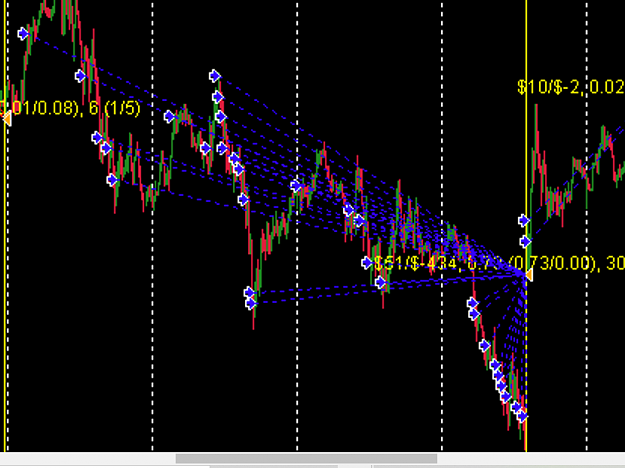
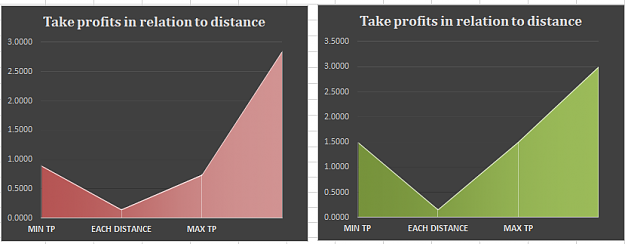
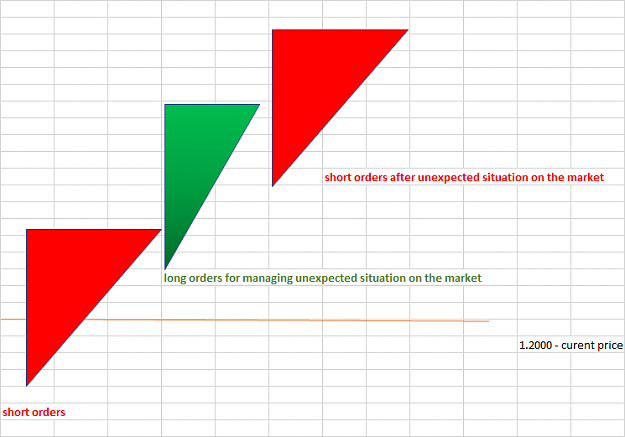
If last image in # Post 34 made some confusion there is another image to show which triangular grid is standard and which is reversed: image Reversed grids are worsening the COG and total profitability so I use it only for loss management or for ...
Trading multipair triangles, no stoploss
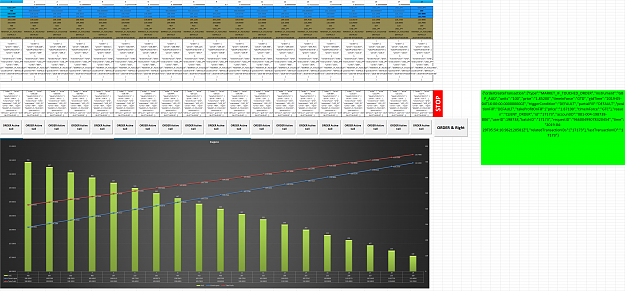
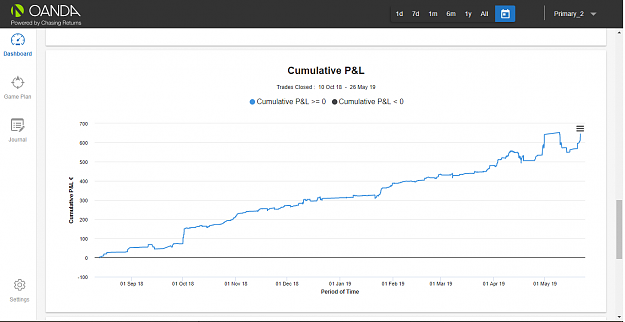
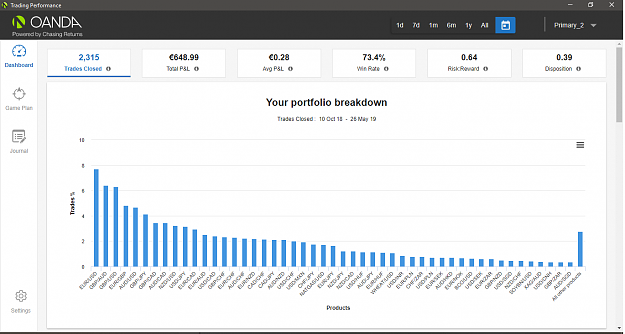
- marecki replied May 26, 2019
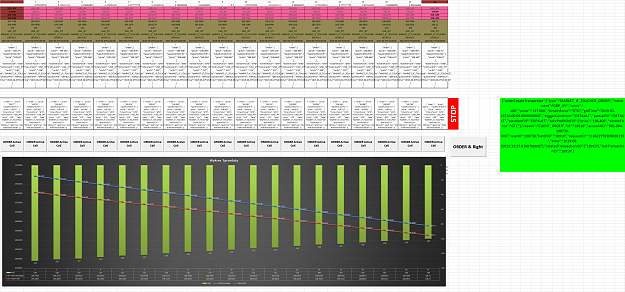
Hi LDFX. I started trading with this method around September/October 2018. Below is image of dashboard of Trading Performance. image Like I wrote before I trade small, but always real money. Please note that I started to trade on weekly charts, so ...
Trading multipair triangles, no stoploss
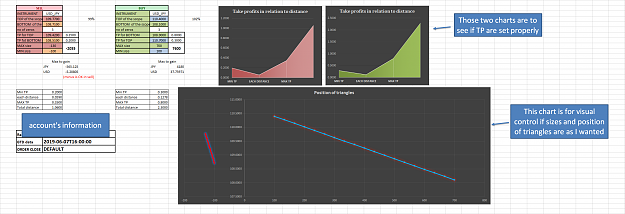
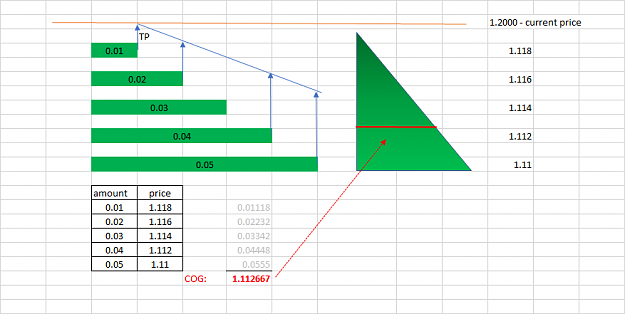
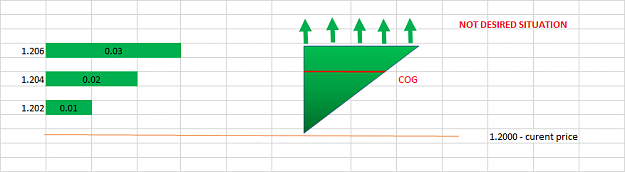
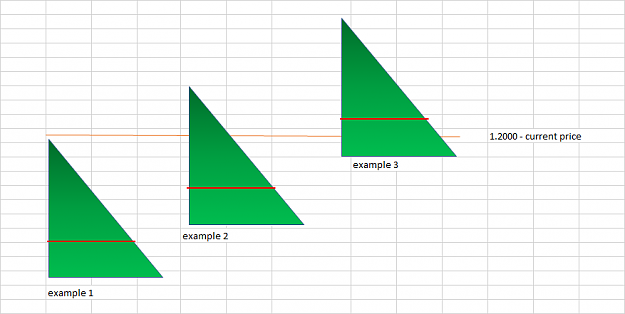
- marecki replied May 26, 2019
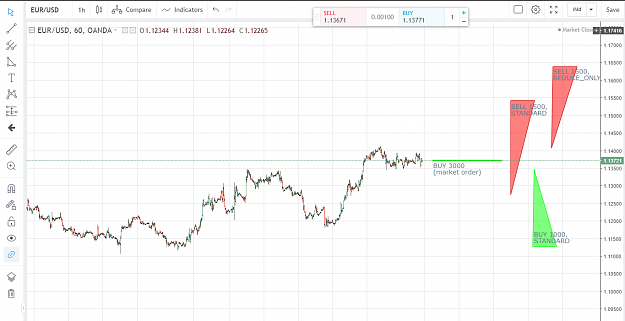
Hi Effax-square I'll try to visualize Your example. 1.2000 is current price, and Your 1st triangle looks like this: image This is a good example of long orders triangle - COG is 1.1126 (of course when all pending orders open). Let's visualize Your ...
Trading multipair triangles, no stoploss
- marecki replied May 25, 2019
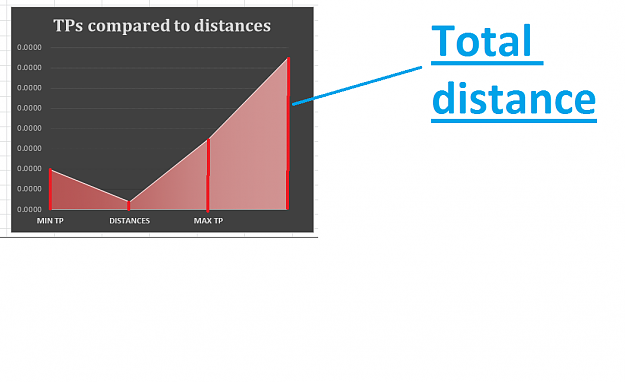
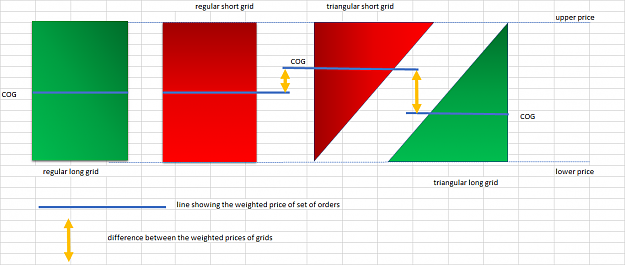
Thank You zotium, it's very nice to hear. That is why I want to share my ideas. Let's continue then and get back to the general idea of triangle grid. I'll be sometimes using a word COG (Center Of Gravity). This is what make a big difference between ...
Trading multipair triangles, no stoploss
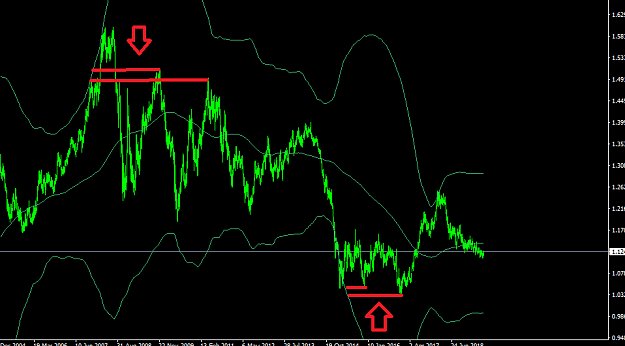
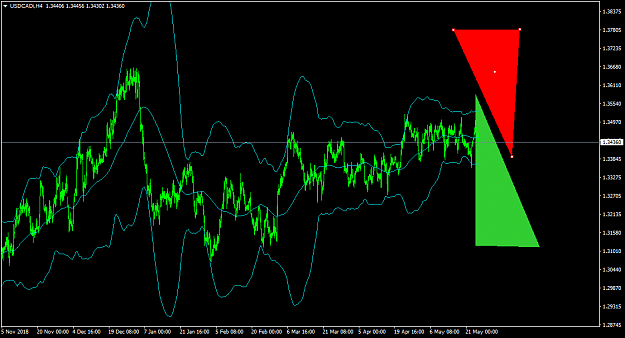
- marecki replied May 25, 2019
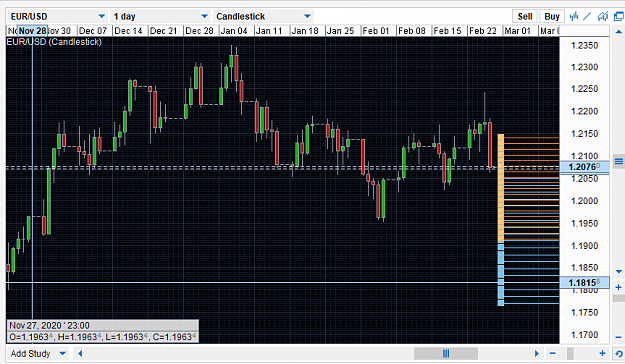
General rule which I use in my trading is to watch Bollinger Band. I am personally used to look at 75 period and 3 standard deviation BB, which You can see on charts I post. Below is USDCAD chart : image In relation to the past few months current ...
Trading multipair triangles, no stoploss
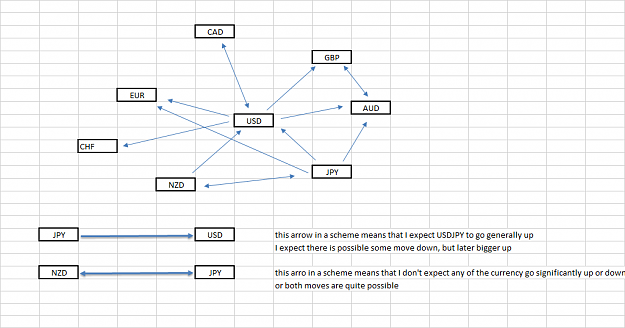
- marecki replied May 25, 2019
Gentlemen, many of traders in this thread are hungry of examples to see how this works, so before elaborating more theory let's put some orders to the market. First what I do is prepare my quick prediction of what will happen the few next days. Time ...
Trading multipair triangles, no stoploss