- Search Forex Factory
- 35 Results
-
 jimsterk replied Jul 7, 2018
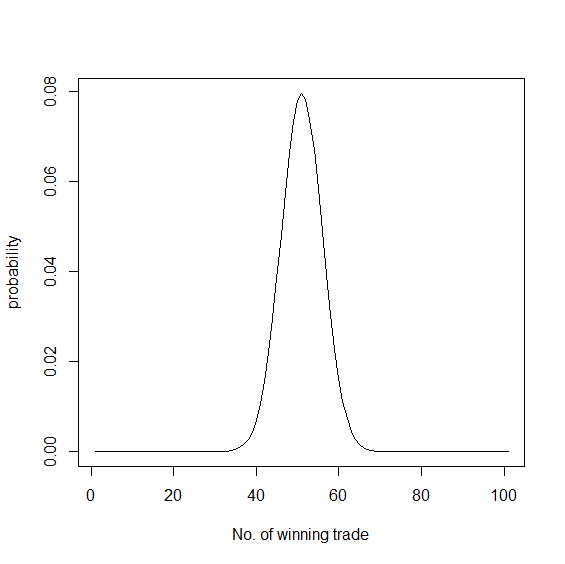
Hi Sis.yphus, How did you calculate 46.759%? As AntiCre said, each trade is 50.05% win rate and expectancy and variance remains constant. That means the distribution after 100 trades follows binomial distribution with win rate 50.05%. You need 51 or ...
The Killing Floor
- jimsterk replied Oct 4, 2017
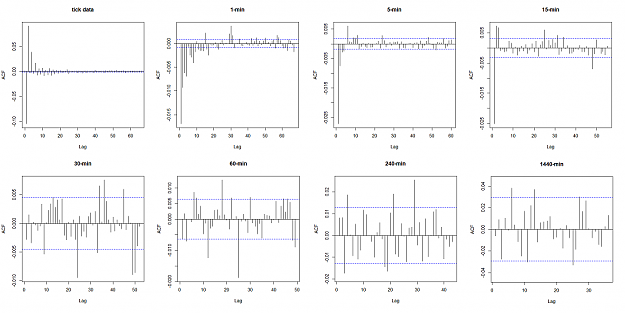
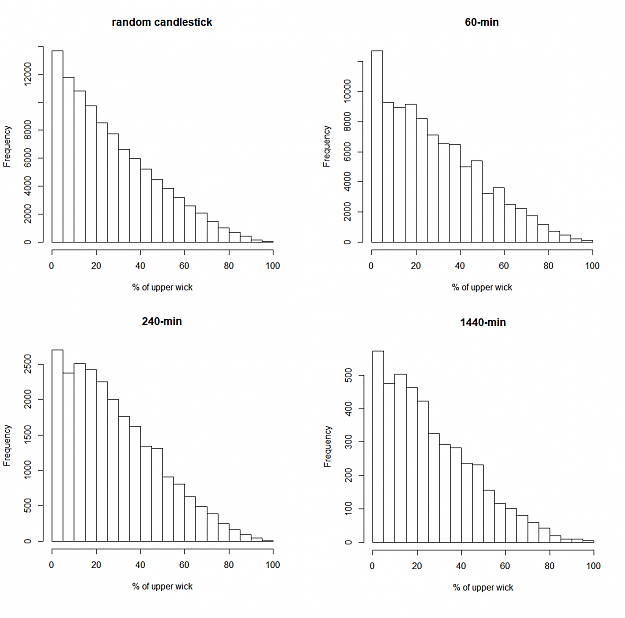
Interesting experiment. I randomly created 100000 candlesticks to check its validity. Here is my R code. Hope my code is correct. myfun <- function(n, n_ran){ u_wicks <- bodys <- l_wicks <- numeric(n) for (i in 1:n){ candle <- cumsum(rnorm(n_ran)) ...
Higher Edge within a Single Candlestick

- jimsterk replied Jan 15, 2017
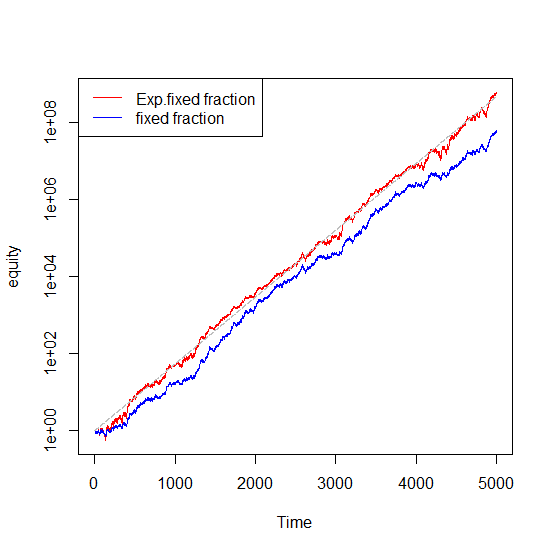
I am not a good coder, but are you sure your code is correct? I have got similar result with the paper. Suppose initial capital is 1, expectancy is 0.2 and fixed fraction is 0.02, which is the same as the paper. here is my code to create FIGURE 2. ...
FXEZ's Quantitative Research In R
- jimsterk replied Jun 13, 2015
Hi, Firstly, Neio, thank you sooooo much to open this thread! Since I have found this thread, I focused on the single candlestick and researched many threads in FF. It was surprizing, not just surprizing but rather I was shocked, that almost all ...
Higher Edge within a Single Candlestick
- jimsterk replied Dec 22, 2014
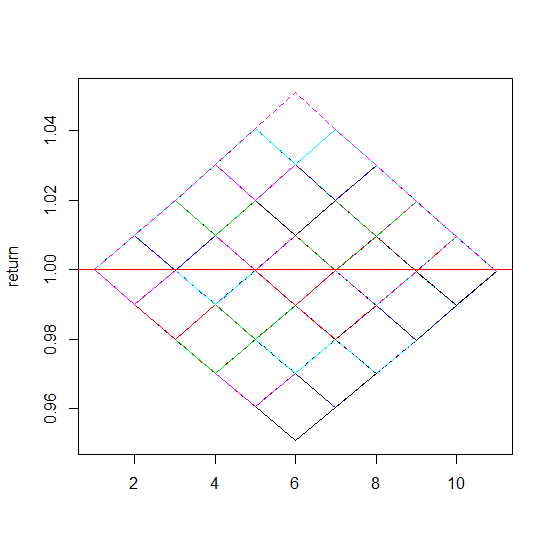
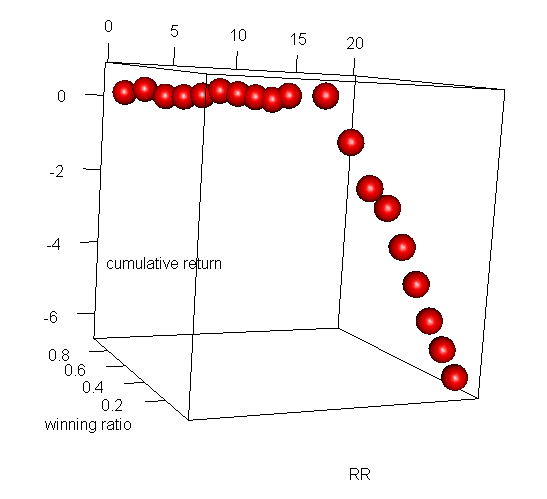
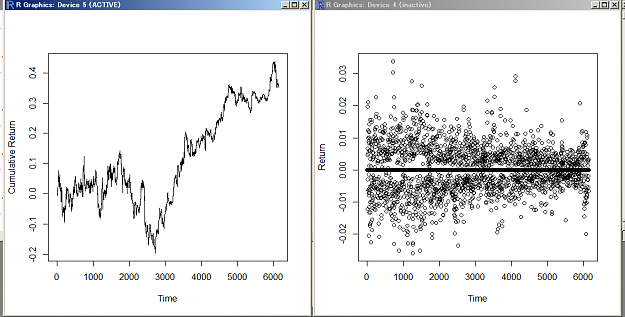
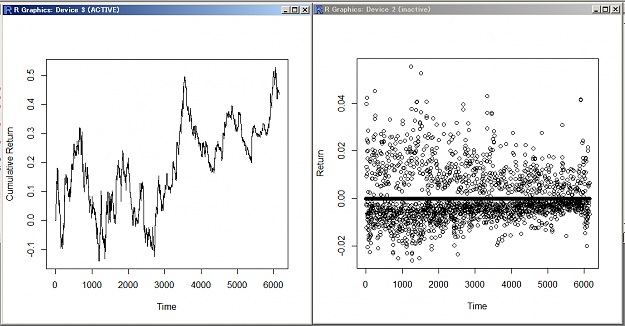
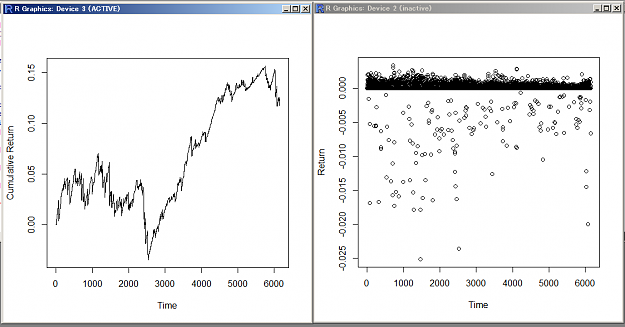
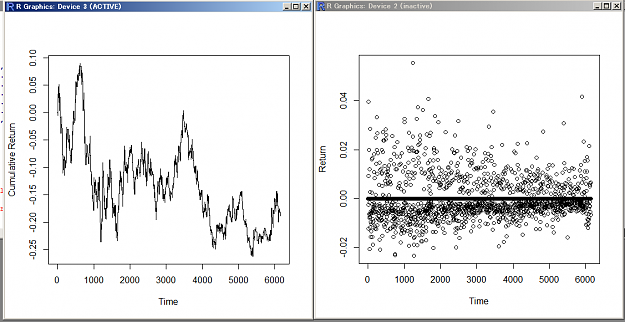
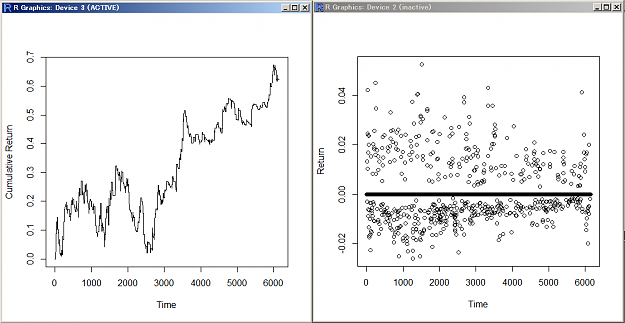
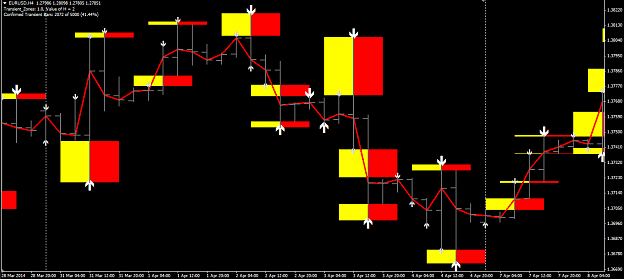
Some empirical analysis... Strategy:Transient Zone only Data:EURUSD240min Sample size:6150 First, I try risk=reward (1:1). Pictures below are the cumulative return and return. ( 0.1= 1000pips ) image Next, with constant risk, I changed reward from ...
The similarity system
- jimsterk replied Nov 3, 2014
Hi Eurusdd, Thank you for your answer. Do you use only n=2 ? When I read the ultimate truth thread, I thought that we need to work with long sub-sequences. But if we need only n=2, that makes calculation easier. Thats good. Thank you, Hi jackprobe, ...
The similarity system
- jimsterk replied Oct 19, 2014
This is my understanding about omega and revolution. 1.we need transient/recurrent idea and DNA url 2.omega is kind of support/resistance, as if the transient zone. if price reaches to omega, then stoploss. omega appears like zigzag, and if price ...
The 3-plan
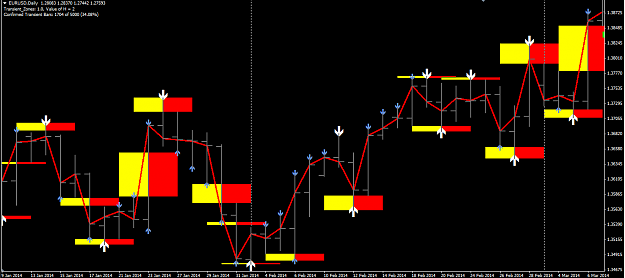
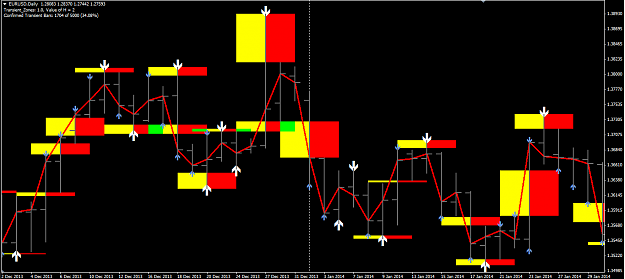
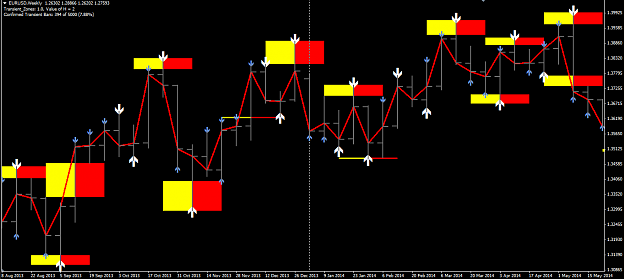
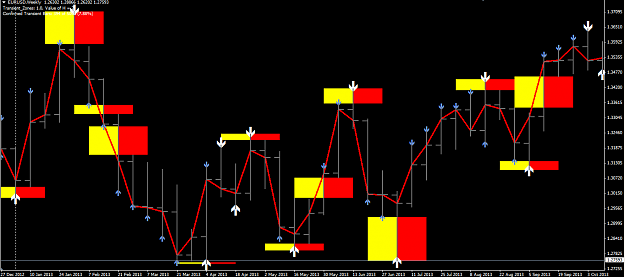
- jimsterk replied Oct 18, 2014
Daily chart: image image image Weekly chart: image image image Settings are not changed, but obviously the accuracy loses as timeframe gets bigger. I do not know what change is necessary to duplicate his arrows. I use alpari but I think ...
A delicate secret
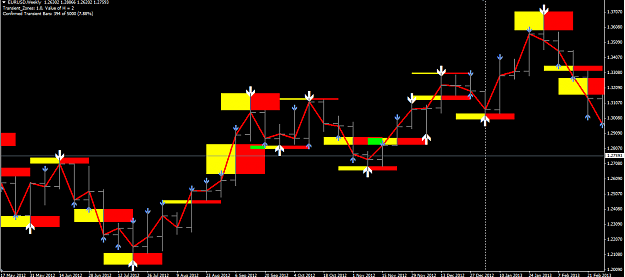
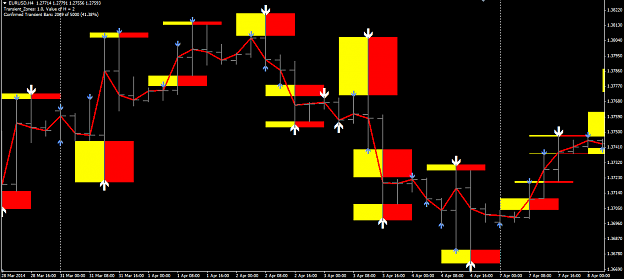
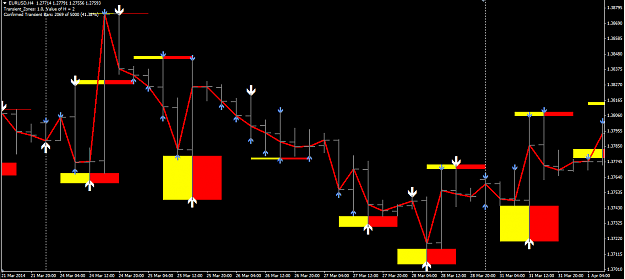
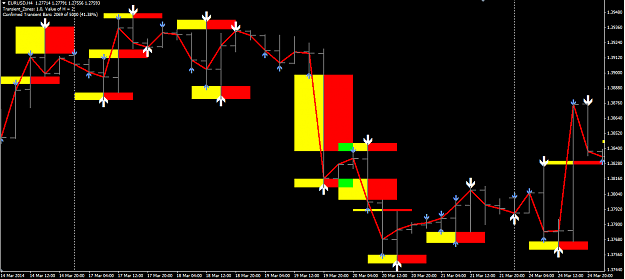
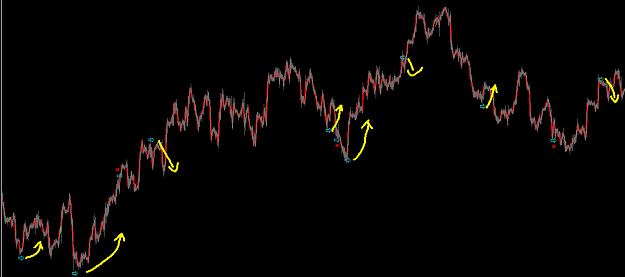
- jimsterk replied Oct 18, 2014
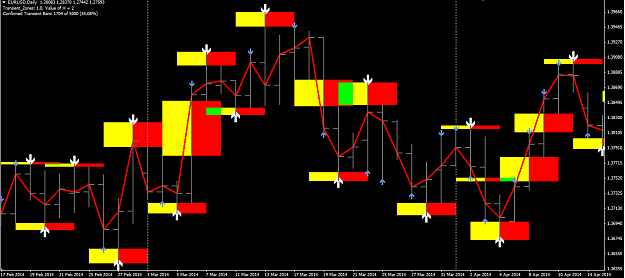
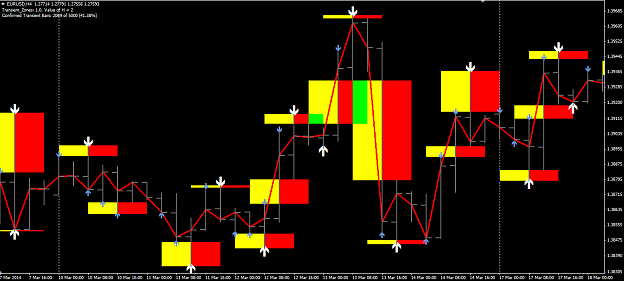
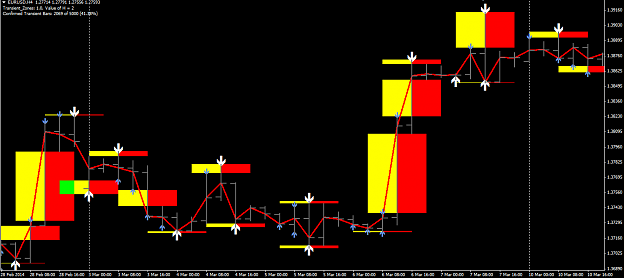
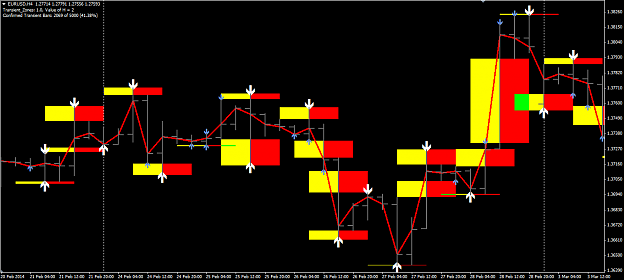
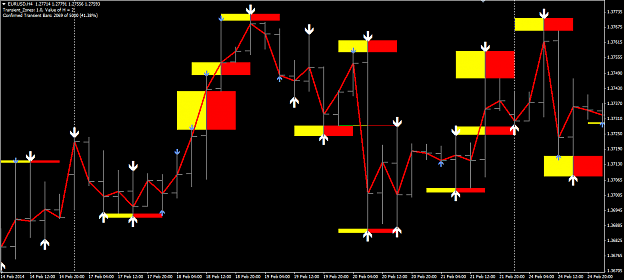
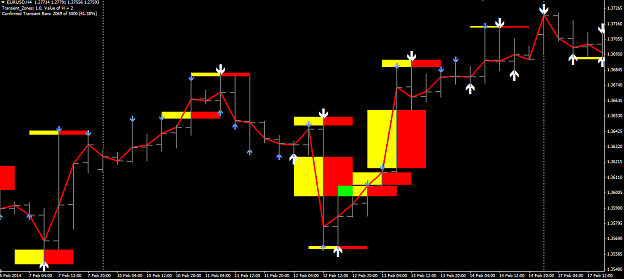
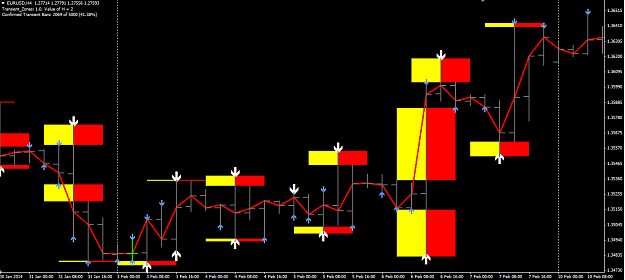
Firstly, sorry for posting too many charts. But this is the relationship between transient zone and delicate secret. (Freefox, thank you for your indicator!) If we apply certain rule, we can duplicate his yellow/orange arrows with 80%-90% accuracy. ...
A delicate secret
- jimsterk replied Oct 17, 2014
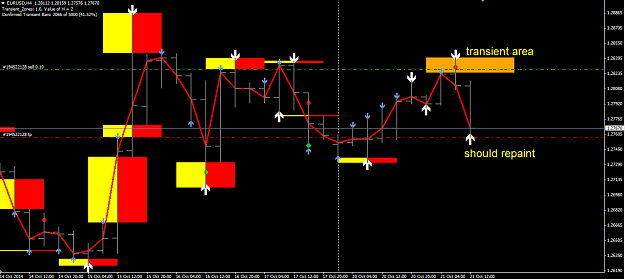
Hi burnssss, Yes, I also thought delicate secret is related to transient/recurrent idea. But cannot duplicate his chart exactly. (I borrowed transient zone indicator(h=2) from Freefox. Thanks to him.) image image I also think 3-plan is related ...
The similarity system
- jimsterk replied Sep 5, 2014
Hi burnssss. If we assume proposition 1 is true (that is there exists h-recurrent price almost surely) =>once we identify the transient price forming, we can say that it is very good candidate for a true transient price (because price is almost ...
The similarity system
- jimsterk replied Sep 5, 2014
I am not sure if I grasp things correctly. I still do not understand 97%-3%. This is just a quick calculation. edit: I found some error in programming. So I deleted the 1st picture. It does not change the result though. Therefore, if we assume ...
The similarity system
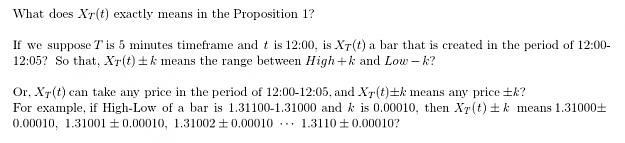
- jimsterk replied Sep 4, 2014
Maybe language barrier, but i do not exactly understand the proposition 1. image Eurusdd or anyone, could you please elaborate on this? thank you. edit: or maybe 1.31000+-0.00010, 1.31010+-0.00010, 1.31020+-0.00010, ... , 1.31100+-0.00010 ?
The similarity system
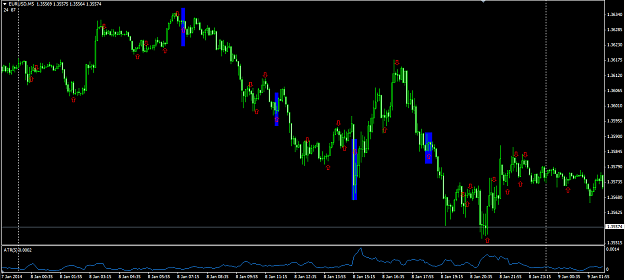
- jimsterk replied Jun 18, 2014
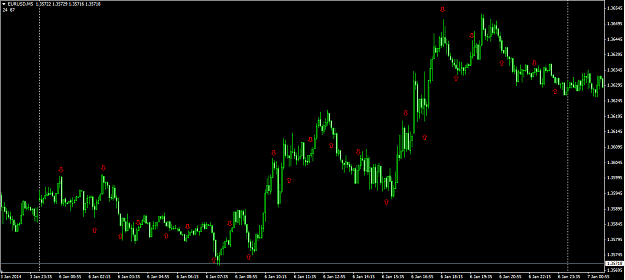
hi madmoney, i am trying to put everything simple, so no adaptability, no error prediction, no 3-doors, and no atr5. and this is next day prediciton. blue rectangles are where i choke myself
Fractals, ZZ & the Pissing Dog image possibly good mm can bring some $$ if i ...
- jimsterk replied Jun 16, 2014
continue on from yesterday post obviously not good...
Fractals, ZZ & the Pissing Dog image @madmoney nothing new. i keep tweaking to find best entry/exit points. i have not experienced aha yet. do you also play with this algo? @samuelkanu thank you. im not sure if i am ...
- jimsterk replied Jun 15, 2014
another try image maybe improving... currently i feel they are not very important, but i have to do backtest more. i need rest.
Fractals, ZZ & the Pissing Dog
- jimsterk replied Jun 14, 2014
thank you for reply, thoughts! yes, the biggest problem of this analysis is we can only place the target level. nothing suggests about entry level. because of this, we may be in the situation of huge drawdown for a long time. maybe grid trading, ...
A delicate secret
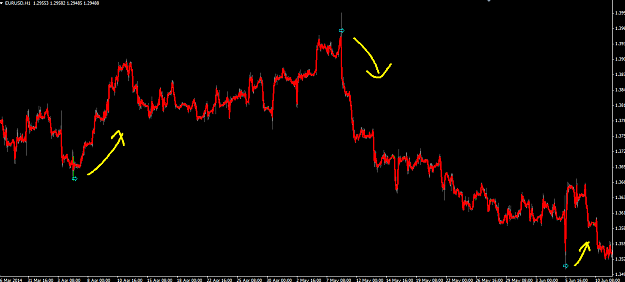
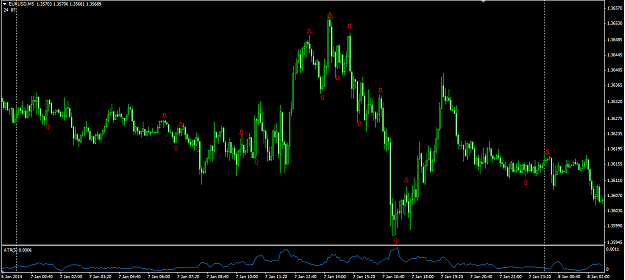
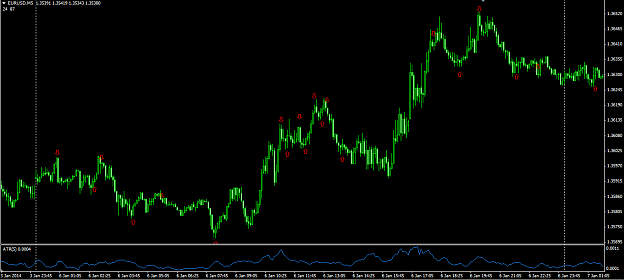
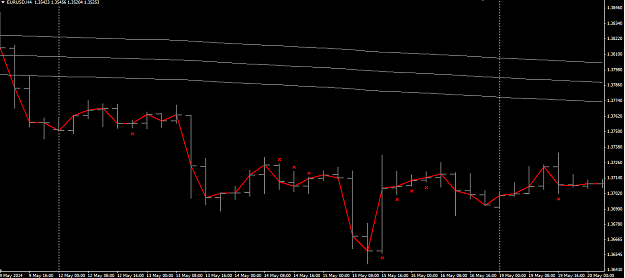
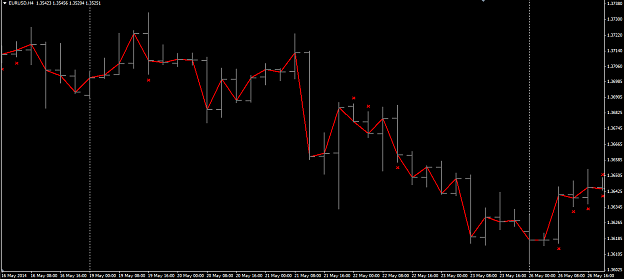
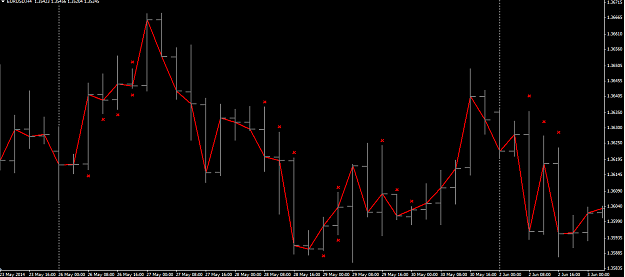
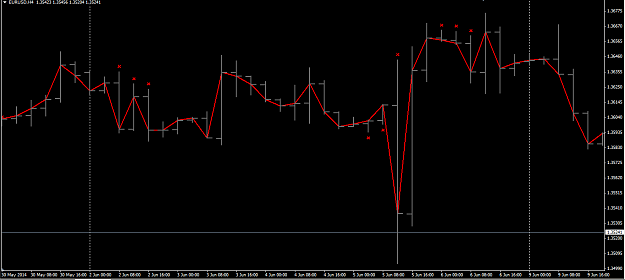
- jimsterk replied Jun 13, 2014
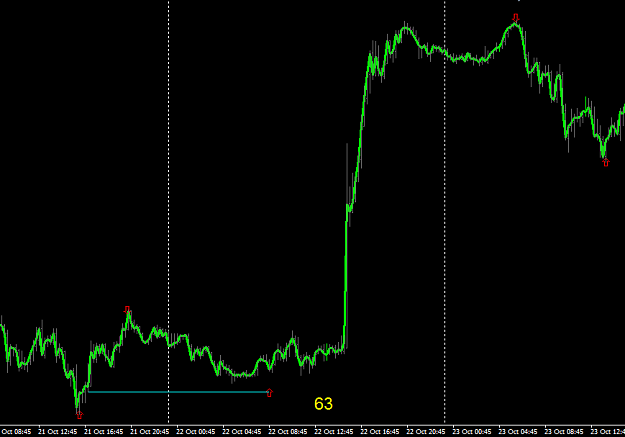
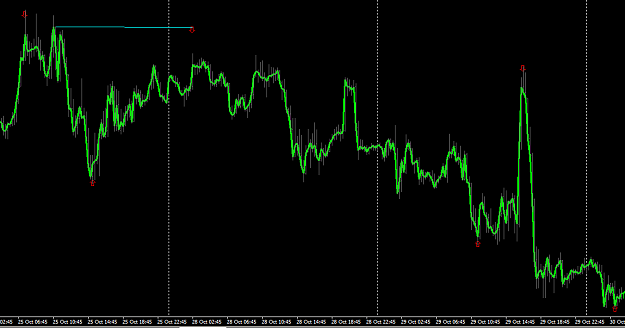
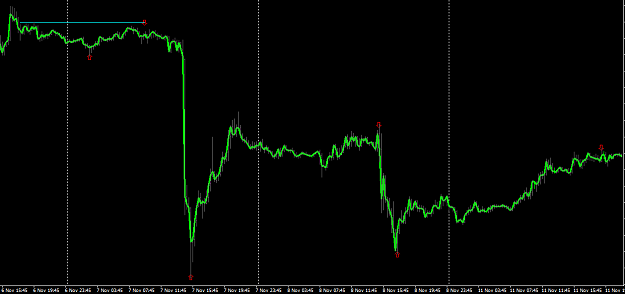
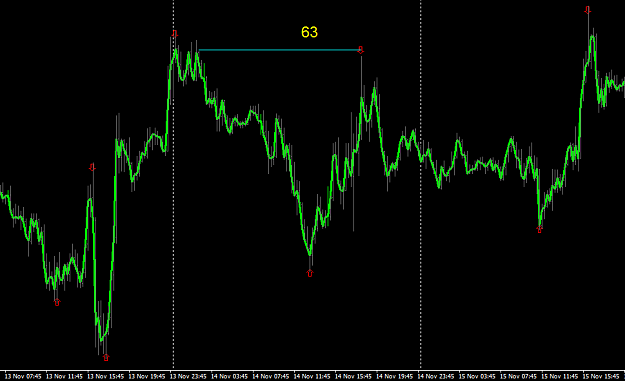
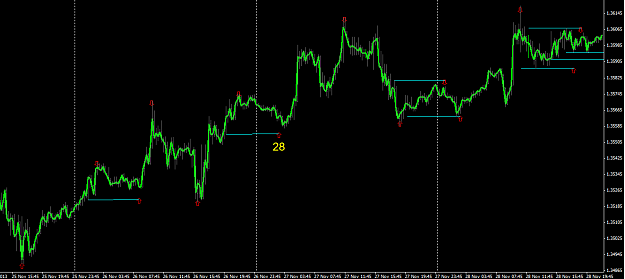
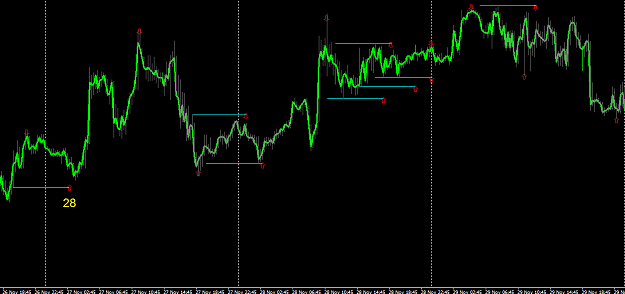
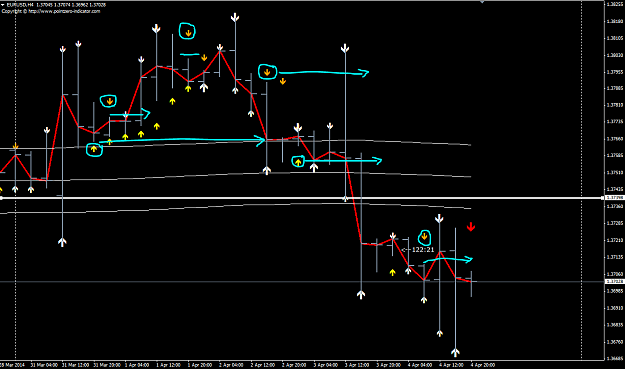
hi everyone, these pictures are what i learned from eurusdd. i have no idea when the price return to these levels. levels in the pictures are all good and successful, but if i backtest 2010-2013, some levels grow +50 days and +400pips...
A delicate secret ...
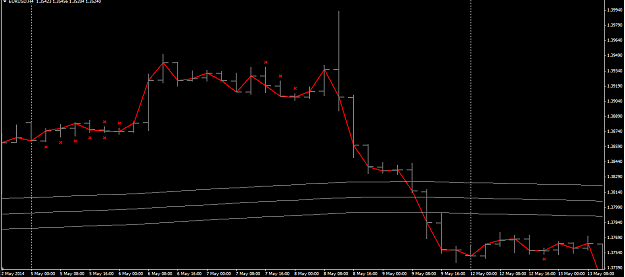
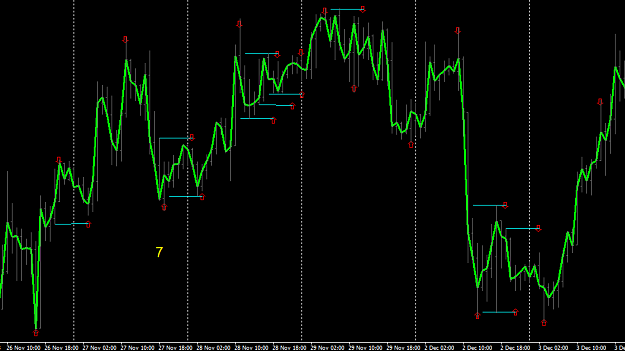
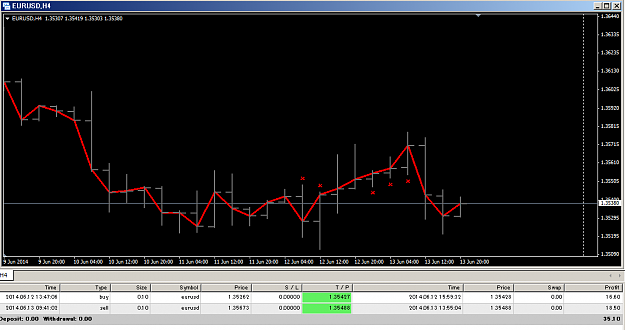
- jimsterk replied Jun 13, 2014
sampled data: 2011-2013 out of sample: start from 2014 not very good... but its fun
Fractals, ZZ & the Pissing Dog
 image keep tweaking...