- Search Forex Factory
- 74 Results
- howard replied Mar 3, 2020
Hello Paul Thank you for the fibo indicator, I cannot work out why the indicator is showing one bar back as opposed to starting from 0 point on Monday. Can you think of any reason, please see the chart
Simple Monday-Tuesday System (attached calculator)
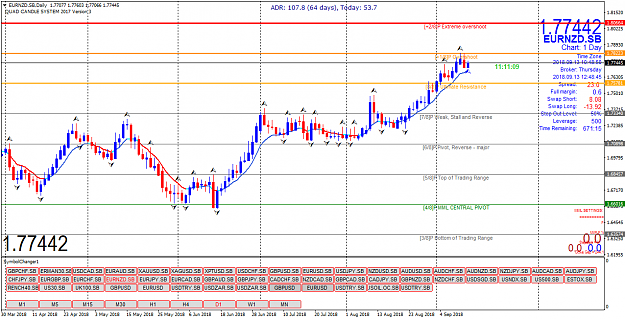
- howard replied Sep 13, 2018
Hello Masterrmind I attach my EURNZD chart here, can you think of any reason why the mm lines are different from your chart? P64
Quad Candle System
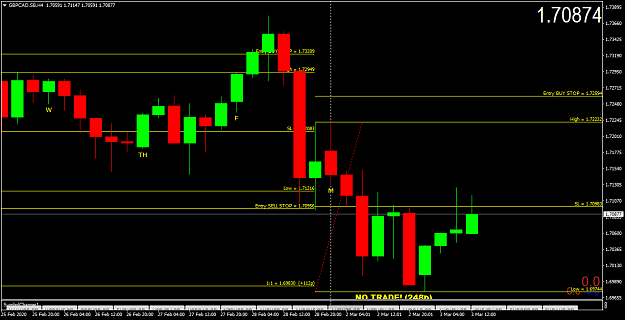
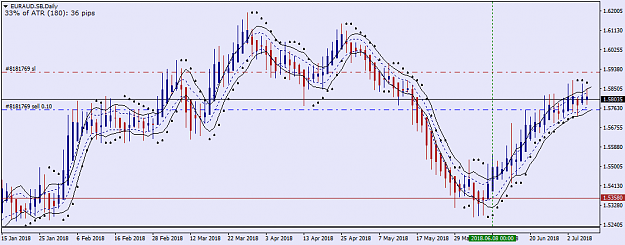
- howard replied Jul 8, 2018
Hi According to your template, on the attached chart long entry is close of the bar where the vertical line is drawn and stop is where the horizontal line is located. Is this correct?
Monthly Profit - Daily Trading using SMA
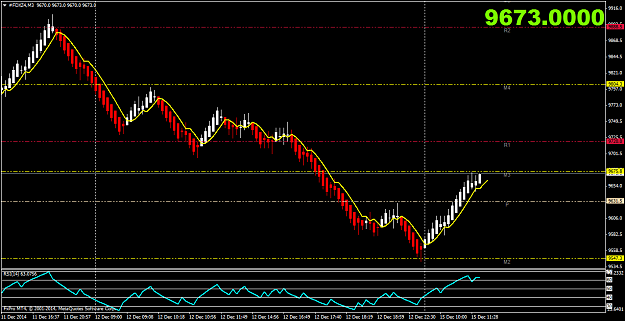
- howard replied Dec 15, 2014
According to your stats and in order to eliminate the noise as far as possible it maybe better to change the block size to 15 as in the attached chart.[attach]1572788
Carpe diem: Intraday tactics for Dax and Dow
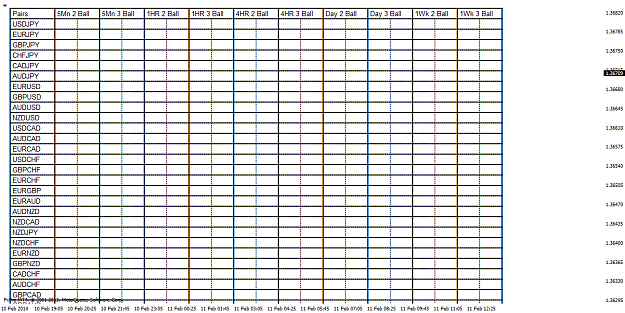
- howard replied Feb 11, 2014
This is what I get from the dashboard , do not know why
My Market Order System
- howard replied Mar 20, 2011
Hi nomask Do you consider yen pairs weekly candles as being suitable setups? they all have the same shape as the attached UJ weekly
Trading Major Lines
- howard replied Nov 1, 2010
4 Digit — And below are the same charts fo a 4 digit broker as we can see there is no difference between 4 and 5 digits
Multiple Trading systems gbpusd only


- howard replied Nov 1, 2010
5 Digit — Charts are for zigzag depths 1 and 8 on a 5 digit broker As we can see depth 8 has an extra signal for today
Multiple Trading systems gbpusd only

- howard replied Oct 1, 2010
EURCHF — Another candidate may be EUR/CHF, weekly is in buy mode however we should wait for a fractal bar to form on weekly to confirm the fib levels and then wait for the daiy to retrace to around 50% level and turn into buy mode.
123 Method by lgtj
- howard replied Sep 30, 2010
EURCHF — On the other hand this can be regarded as a new bull trend making HHs/HLs as shown on the attached chart
DanUK's Advanced Trend Trading Strategy
- howard replied Sep 8, 2010
But when the chart is set to 4h, it is like yours, so the indicator is faulty
Multiple Trading systems gbpusd only
- howard replied Sep 8, 2010
It seems as if my Matrix is not working properly, it is quite different from yours
Multiple Trading systems gbpusd only
- howard replied Aug 2, 2010
Thank you Could you post a chart of GBP/USD and explain what you would have done for today or explain it on my chart attached below
Buy dip sell high with rsi
- howard replied Apr 7, 2010
Exits — A good exit method might be to apply the fib tool to the zigzag (blue and red lines), set a target of 2.62% level and at the same time trail the stop on the ledges of TM (one ledge before the last). If target hit, this would give us a ...
profitable Zigzag
- howard replied Aug 15, 2009
Hello vic On the attached daily chart of GU, if we wanted to wait for a full signal as you describe that is cross of red and blue lines to take place above the cloud we should have entered the trade around the yellow circle. But if we wanted to ...
Ichimoku forever
- howard replied Jul 20, 2009
GBPUSD — I used Trix 3111 on 15m and 4hr for entry and Trix 4111 on 1hr for exits, entered at 1.6415 and exited at 1.6531 Slightly different from yours, maybe you want to check it.
MTF Trix system
- howard replied Jun 12, 2009
I don't know why you were stopped out Our entry was on the vertical yellow line on my chart and stops should have been moved in stages at the green dotted lines on my chart , the current stop being at 1.6474
EUR/GBP Trendmagic System
- howard replied Jun 4, 2009
2nd of June: Short did not trigger and long played out nicely in line with trendmagic
The London Progressive Strategy