- Search Forex Factory
- 18 Results (1 Thread , 17 Replies )
- haikanoz replied Mar 11, 2018
My take on EJ as a high-timeframe swing trader, - I would sell when price hit the area of 137.00 - 137.00, and buy when price at the area 125.00-127.00 (based on weekly chart, supported by monthly). Dont know when this will happen. image Recently ...
Swing Traders Welcome
- haikanoz replied Jul 24, 2016
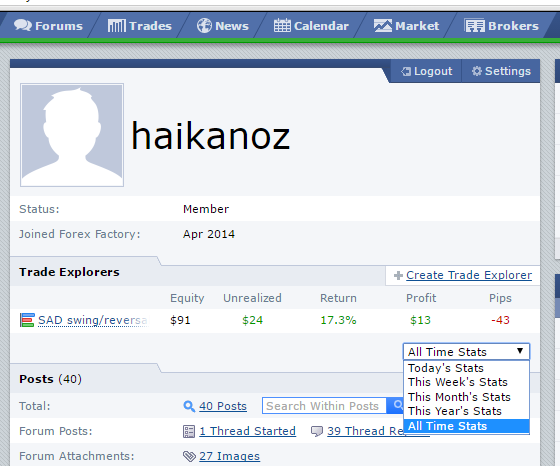
Hi JUP, To show the "all time stats", go to your profile, under yr trade explorer tab, click n select all time stats from the drop down list of selection. Done Hope this helps image
1 year profitable trading goal
- haikanoz replied May 5, 2016
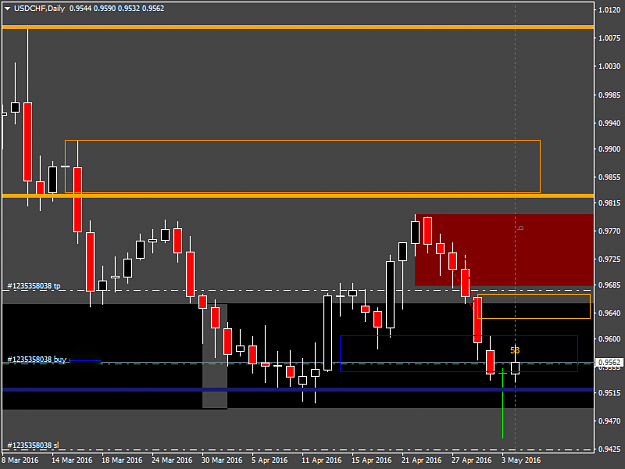
closed both my UChf & UJ long trades, prematurely image image
(binned per thread starter’s request) Truth in Trading
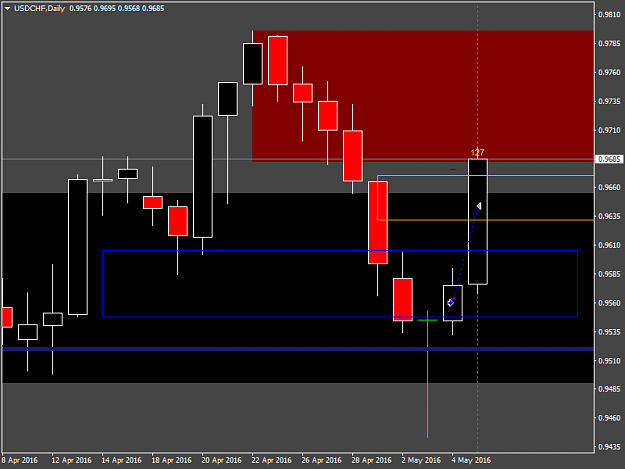
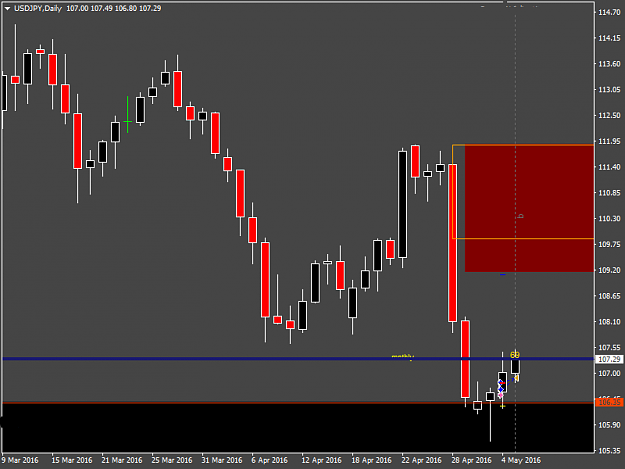
- haikanoz replied May 4, 2016
I am long UChf & UJ, as both prices are at weekly support zone and buy signal @D1. There are hardly any move for both trades
(binned per thread starter’s request) Truth in Trading image
image
- haikanoz replied May 2, 2016
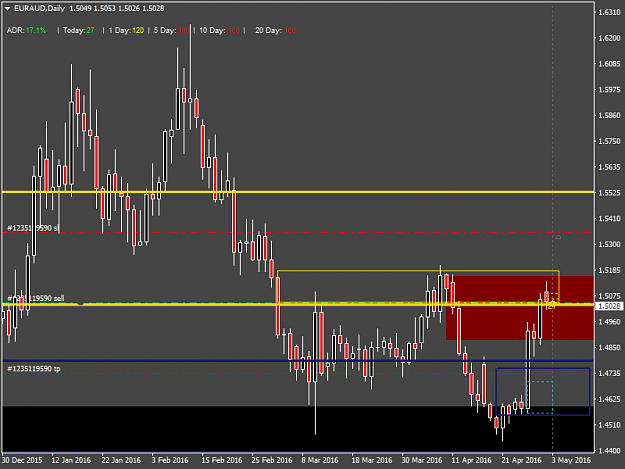
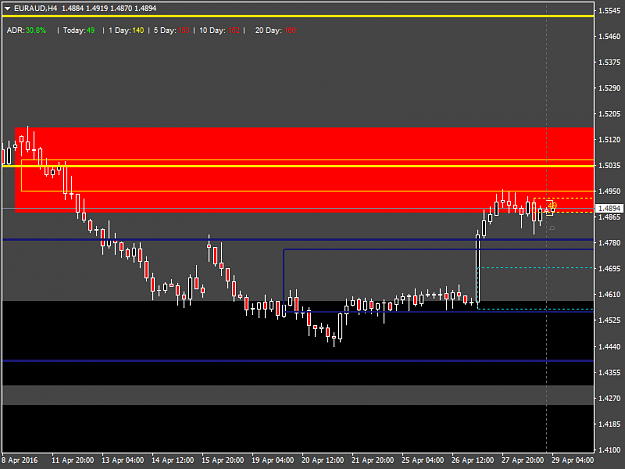
G day, Oh, what a coincident. am also shorting EAud... hmmm has to agree with fxpiet.... emotions. Am getting too aggressive, that i shouldn't be. Sign of a bad trader image update: stopped out at BE during RBA announcement (while floating at ...
(binned per thread starter’s request) Truth in Trading
- haikanoz replied May 2, 2016
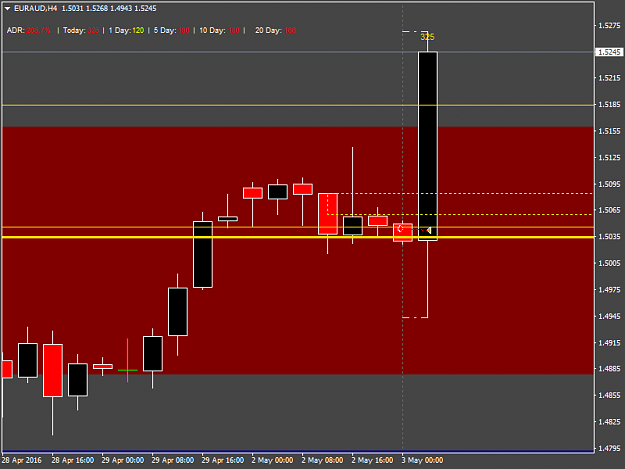
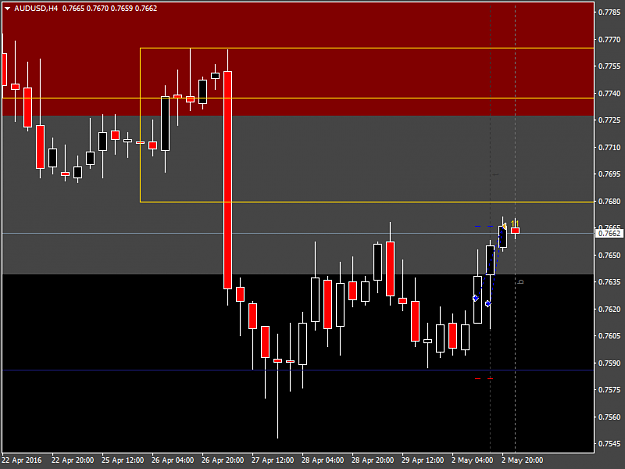
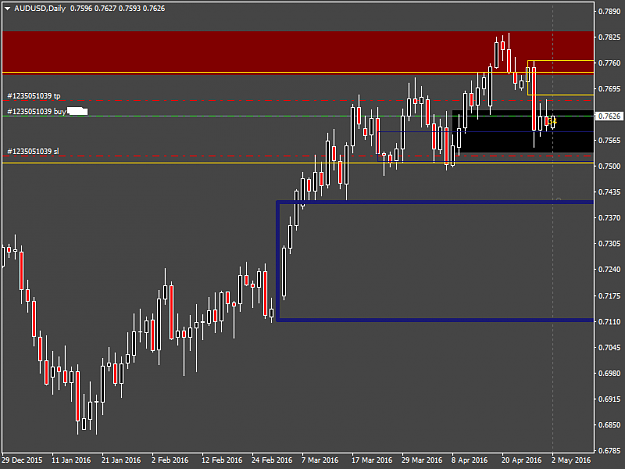
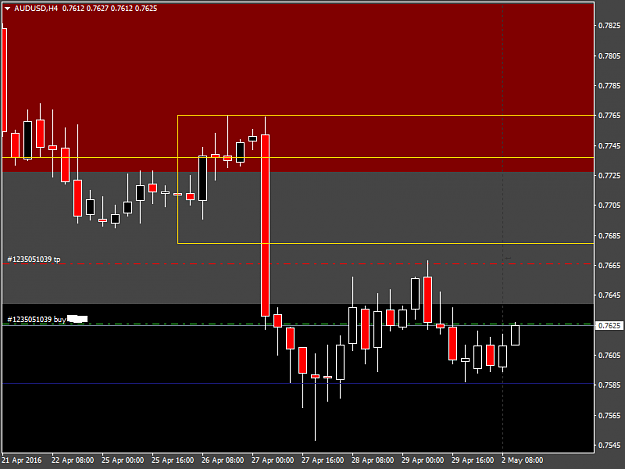
This was from my trade yesterday 2 May 2016: Open buy position following the H4 timeframe, in sync/confluence with London Breakout with TP 45pips, SL 90pips image image Trade duration (3barsxH4) (edit: add another position upon retracement. ...
(binned per thread starter’s request) Truth in Trading


- haikanoz replied May 1, 2016
Major Pair #9 Monthly & Weekly Date: 1May2016 AU -to be update- ---------------------------- ----------------------------- 2 May 2016: Open buy position following the H4 timeframe & London Breakout with TP 45pips, SL 90pips. image image
Haikanoz Trading Journal/Journey (Privately for Myself Only)
- haikanoz replied May 1, 2016
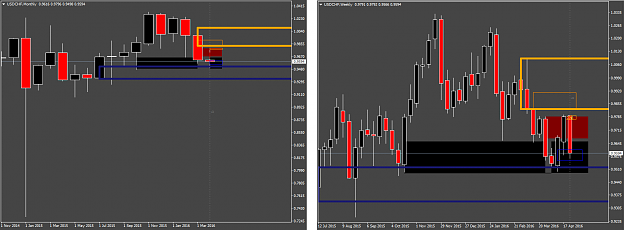
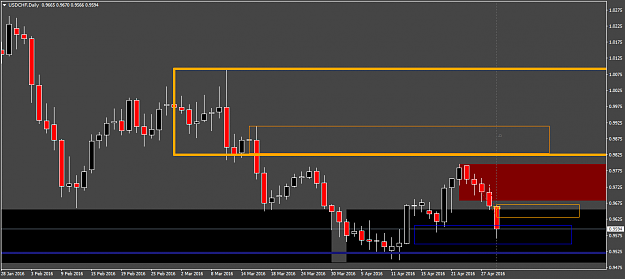
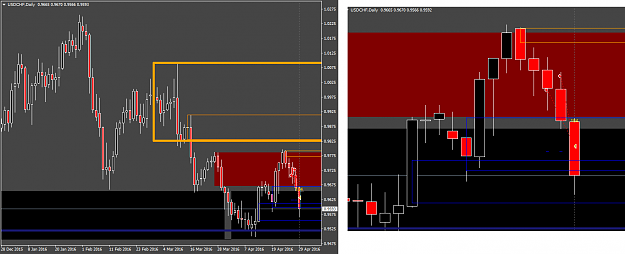
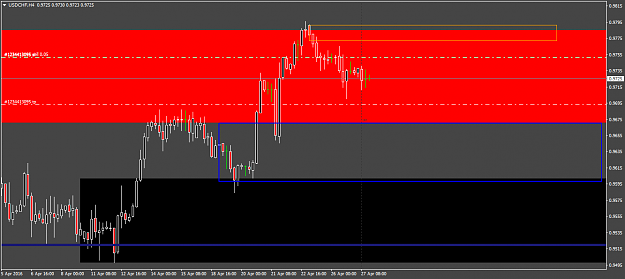
Major Pair #7 Monthly & Weekly Date: end April 2016 UChf 27April2016 My current trade/open position sell USDCHF (re-entry post-FOMC when the original trade was stopped at BE during FOMC). This is my original entry criteria: (i) price has been ...
Haikanoz Trading Journal/Journey (Privately for Myself Only)

- haikanoz replied May 1, 2016
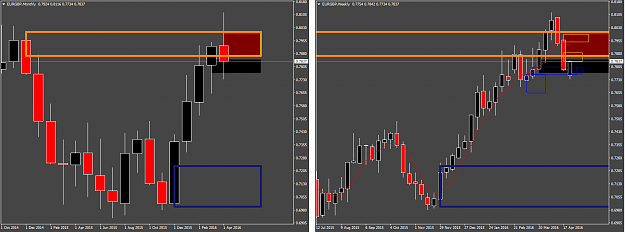
Major Pair - Monthly & Weekly Date: 1May2016 EG image 1 May 2016: The upward move this week, ends near/reaching the weekly-supply zone. Hope that price will continue move upward, penetrating that zone, before forming a reversal pattern. (sell). My ...
Haikanoz Trading Journal/Journey (Privately for Myself Only)

- haikanoz replied May 1, 2016
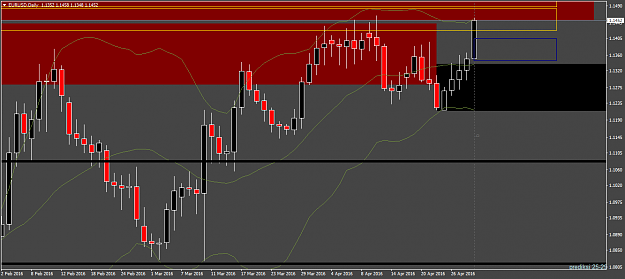
Major Pair - Monthly & Weekly Date: 1May2016 EU image 1 May 2016: Weekly closed bullish, creates a new weekly-demand zone. Daily (fri 30Apr) also ended BuLBC, creates new BULBC. My take is that the mid-term (this coming 2-3 weeks) sentiment will ...
Haikanoz Trading Journal/Journey (Privately for Myself Only)

- haikanoz replied May 1, 2016
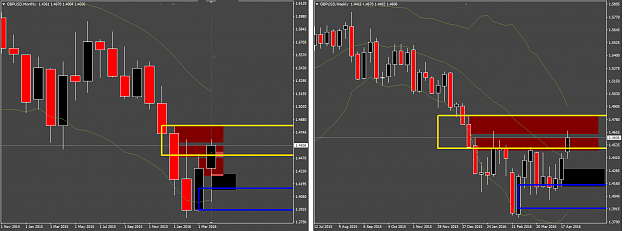
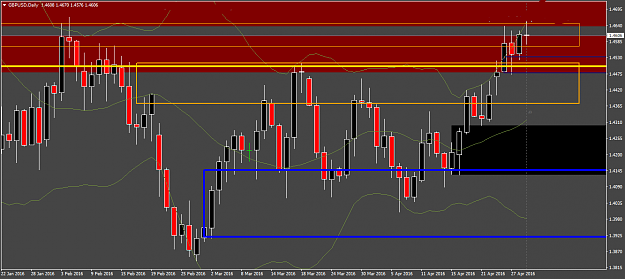
Major Pairs - Monthly & Weekly Date: 1May2016 GU image Date: 1 May 2016. Price is now at the daily+weekly+monthly supply zone). Thus, I would not perform mid-term-buy at this price, instead I'll observe the possibility to sell, despite the ...
Haikanoz Trading Journal/Journey (Privately for Myself Only)
- haikanoz replied Apr 29, 2016
Close UCHF sell for 90+80pips Trade duration = 3 days (opened after FOMC wed). Done for this week
Haikanoz Trading Journal/Journey (Privately for Myself Only)
- haikanoz replied Apr 29, 2016
Closed my UCHF sell for 90+80pips (trade duration = 3 days, opened after FOMC wed). Tq Winston for the sharing Done for this week
(binned per thread starter’s request) Truth in Trading

- haikanoz replied Apr 28, 2016
Thanks Winston, for the insight Been following this thread since the beginning, apply/studying it on major pairs and execute 2-3 live trades (mini-tiny lots) on real account. Must admit that i like the color selection (bull=black, bear=read) ...
(binned per thread starter’s request) Truth in Trading
- Haikanoz Trading Journal/Journey (Privately for Myself Only)Started Apr 27, 2016|Trading Journals|12 replies
My first attempt to write a trading journal. Strategy: trade the major swing/reversal, based on the ...

- haikanoz replied Dec 3, 2014
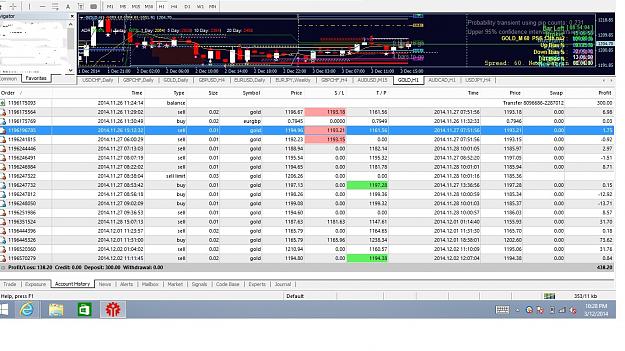
Thankyou Tuan Kiads for what you've shared with us. Been applying it on gold on last+this week, work beautifully and able to catch the big buy & sell moves... walau cuma dengan lot 0.01sen,,,Definitely a huge help. Hope to be appear on your subs ...
MTH Accel Shift- Advance Renko Trading System (ARTS) MT4 b600
- haikanoz replied Apr 25, 2014
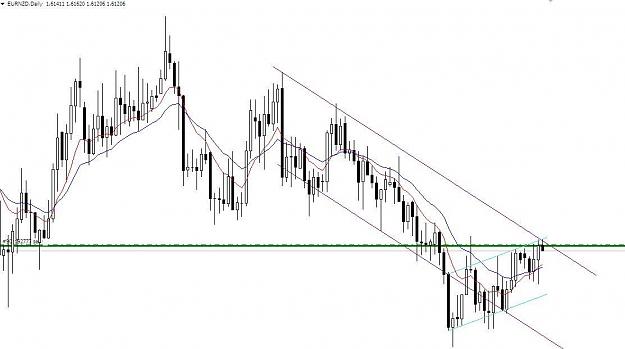
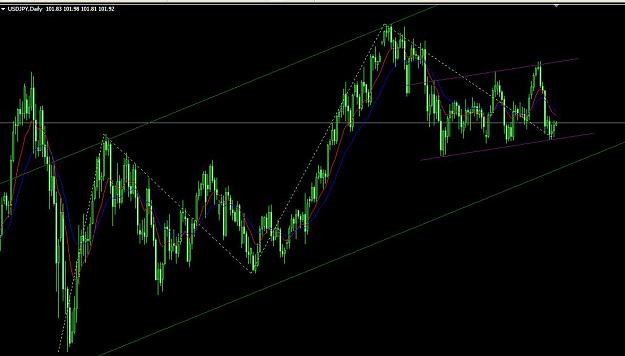
Good sharing of valuable info guys. tq OP. My take is by combining the candlestick pattern with daily s r line, daily channel (purple color) and H4 channel (turqoise color) to find confluence. doing this since abt 2 months ago, normally hold ...
Simple stupid position trading (H4/D1)
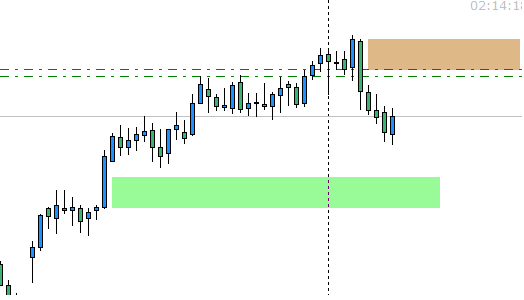
- haikanoz replied Apr 15, 2014
Thanks JoeNYfor the post. we can see that the Green dotted line mentioned by JoeyNY is actually the price movement created by the bigger timeframe (the weekly channel) (solid green line) ?
Why chase the trend instead of the range?
- Posts by Member Search: 'haikanoz'