- Search Forex Factory
- 22 Results
-
 gautam0597 replied Feb 8, 2013
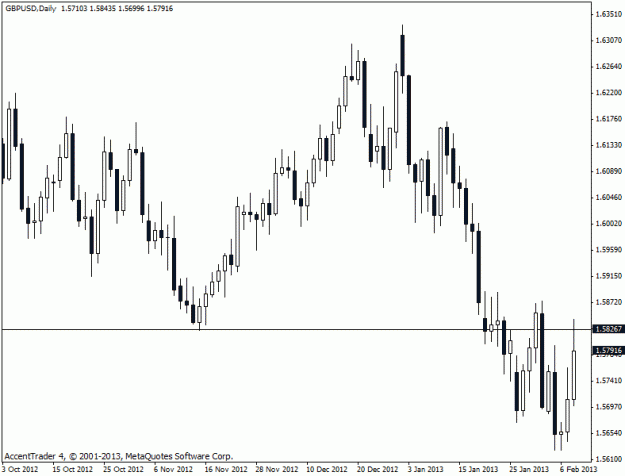
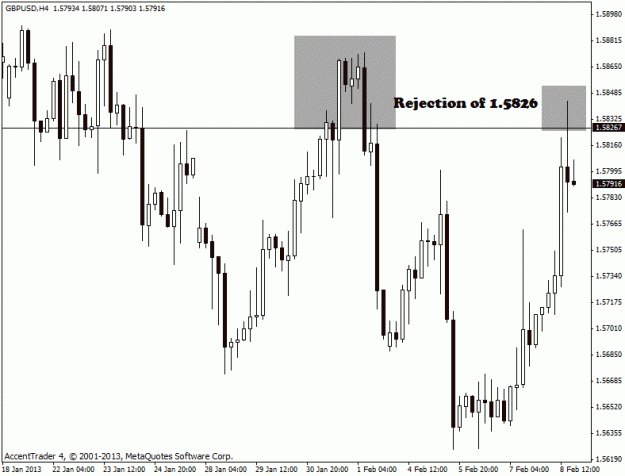
A good trade setup forming in GBP/USD On Wednesday, the GBP/USD tried to blow past the 1.5800 level only to drop back below that zone today. The real question is going to be whether or not this is a sign of real strength, or if it is a simple retest ...
Cable Update (GBPUSD)
- gautam0597 replied Feb 8, 2013
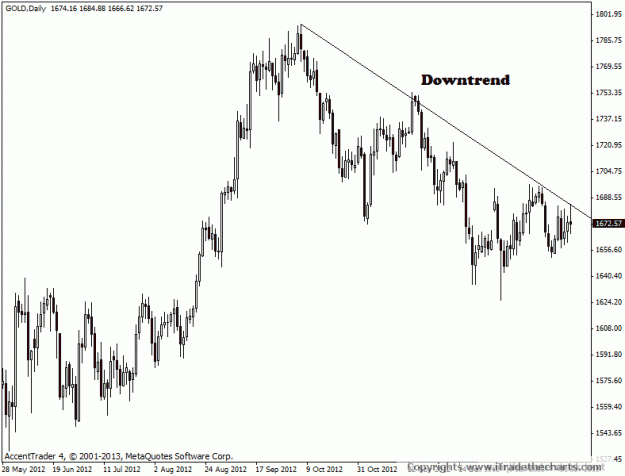
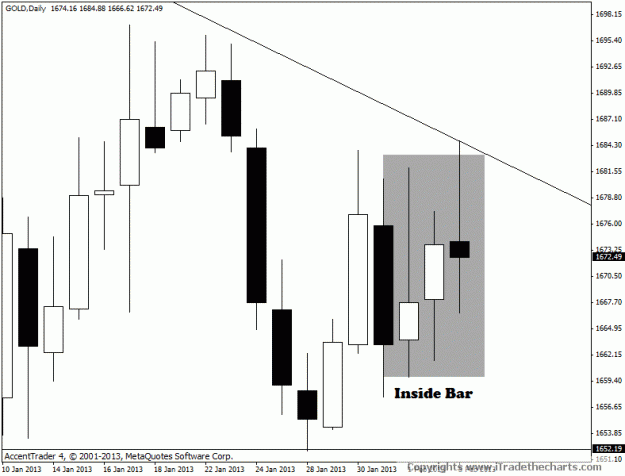
Can you tell that Gold is in a downtrend? Gold is definitely facing stiff resistance at $1685 and has been capped by this significant resistance zone $1685-$1700.The chart below clearly illustrates the fact that the yellow metal is in an obvious ...
All Majors and Gold
- gautam0597 replied Feb 8, 2013
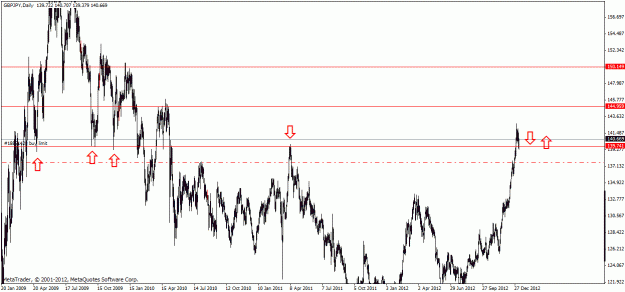
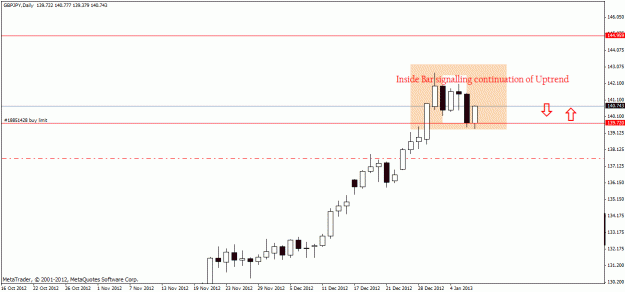
GBPJPY uptrend gathers steam GBPJPY - Inside bar from core resistance turned support The GBPJPY is a monster when it comes to making massive moves especially when following a trend. The pair broke the core resistance(139.72) on 31st Dec,2012 ...
Geppy's Geppy Thread (GBP/JPY)
- gautam0597 replied Feb 8, 2013
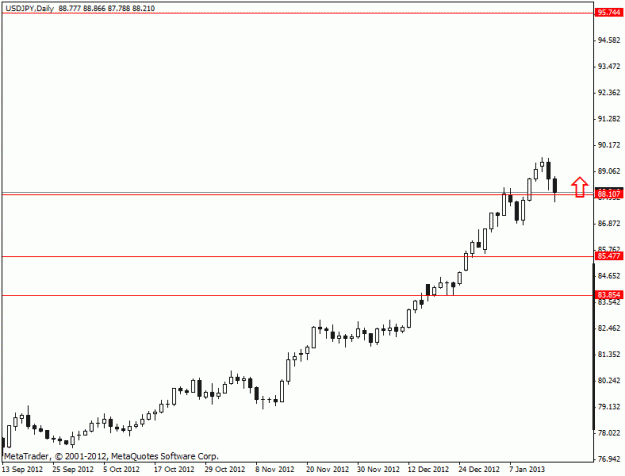
USD/JPY on a pullback The price action in forex on Tuesday was more indicative of a 2-way street, principally on the yen, but also elsewhere. We saw some reversal a week ago on dollar-yen, but this was undermined by the rally into the end of last ...
USD/JPY Discussion
- gautam0597 replied Feb 8, 2013
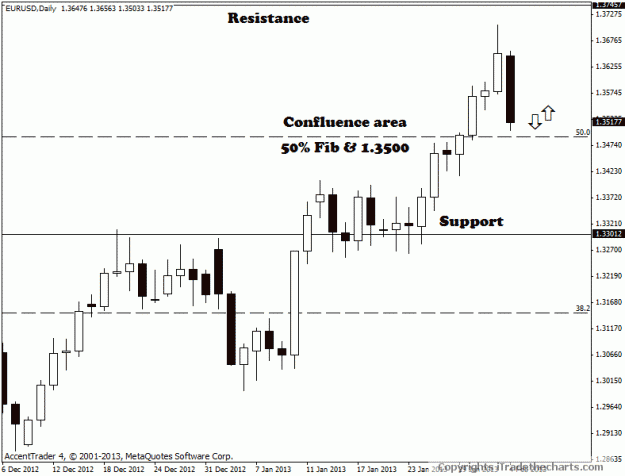
Euro bulls too strong Even as many investors and analysts believe that the statistics and data releases can greatly impact currency price movements, thus foretelling in regards to future advances within those economies, the study of price action ...
EURUSD
- gautam0597 replied Feb 8, 2013
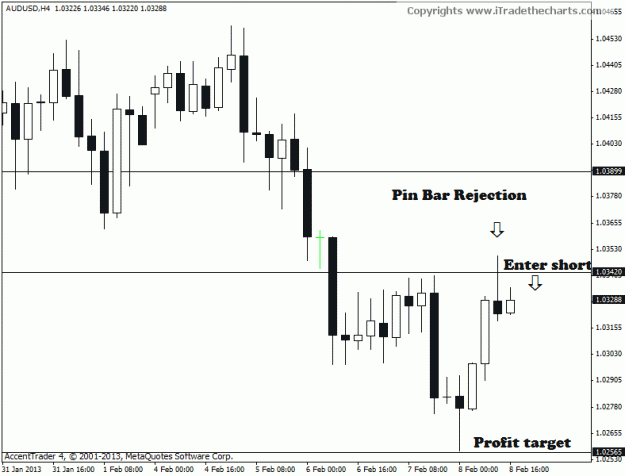
How to identify a good retracement trading opportunity? The Aussie dollar had earlier seen some intense selling followed by correction to a fair value this week. We have identified 1.0342 as the former support & current resistance and hence its a ...
AUD/USD
- gautam0597 replied Dec 24, 2012
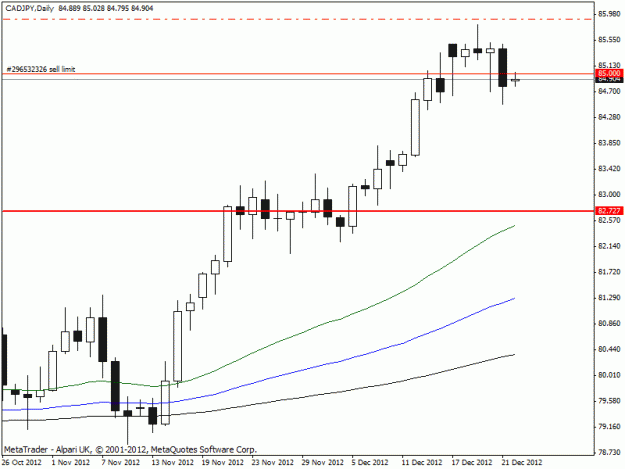
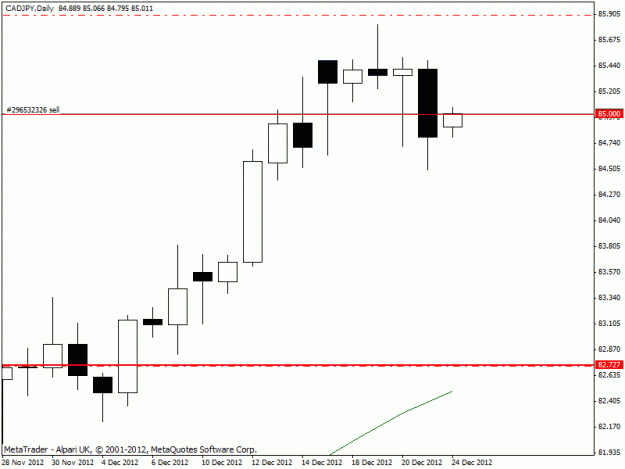
Trade#6: CADJPY Another case of a 19th Pin bar followed by a bearish candle on the 21st closing below a core resistance level. Sell @85.00 T/P 82.72 S/L 85.90 Possible Risk=$100.00 & Possible Reward=$250. R:R=1:2.5
My Trading Journal
- gautam0597 replied Dec 24, 2012
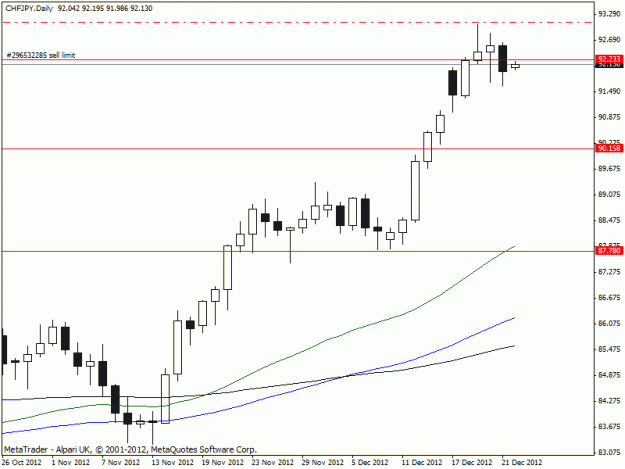
Trade#5: CHFJPY After a Pin bar on the 19th and a bearish candle on the 21st closing below the core resistance of 92.23, I decided to go short. Sell @92.233 T/P 90.158 S/L 93.100 Possible Risk=$100.00 & Possible Reward=$240. R:R=1:2.4
My Trading Journal
- gautam0597 replied Dec 24, 2012
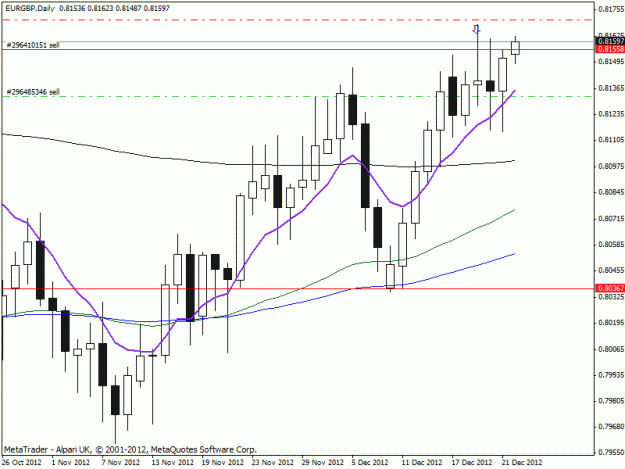
Trade#3: EURGBP Retest of resistance and rejection in the form of a pin bar and 2 other rejection candles calls for a move South. Sell @0.81325 T/P 0.80367 S/L 0.81707 Possible Risk=$100.00 & Possible Reward=$547. R:R=1:2.52 Trade#4: EURGBP Got in ...
My Trading Journal
- gautam0597 replied Dec 24, 2012
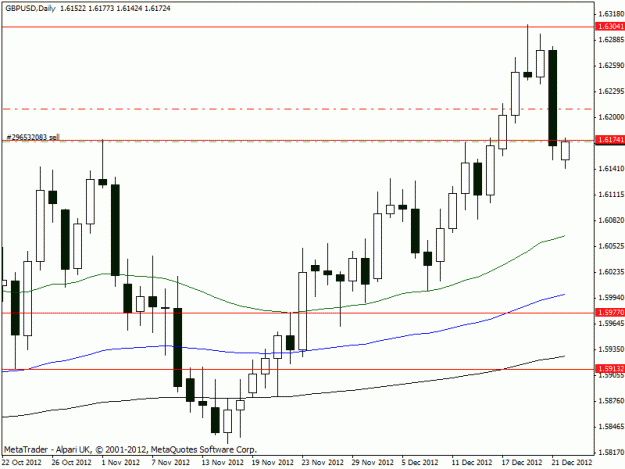
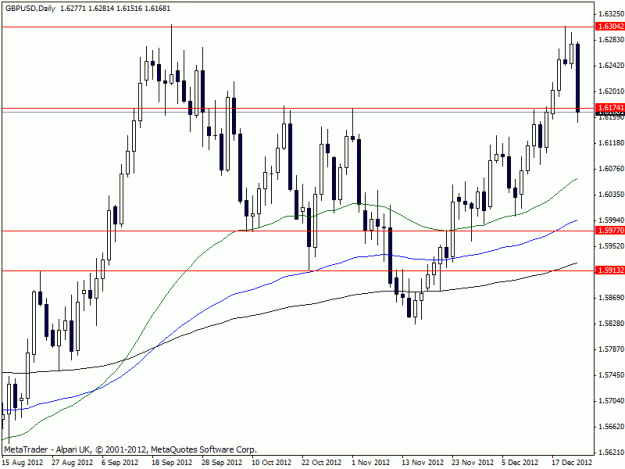
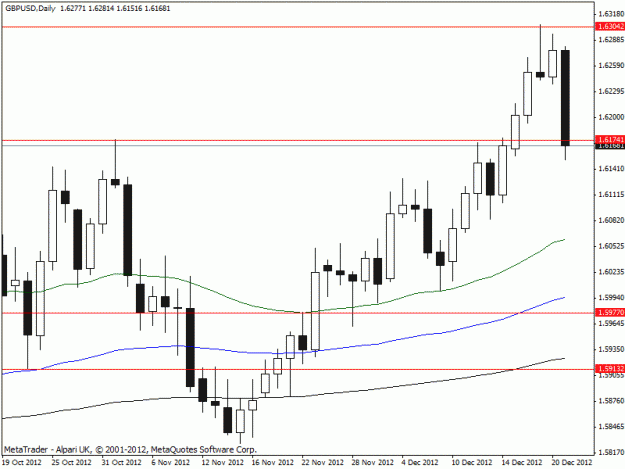
Trade#2: GBPUSD A BIG bearish pin bar on the 19th followed by a huge bearish candle on the 21st meant the momentum now was shifting to the downside. The bearish candle on the 21st closed below the key support of 1.6174 confirming the weakness. SELL ...
My Trading Journal
- gautam0597 replied Dec 22, 2012
UPDATE: After suffering a string of losses due to over-trading I have decided to stop trading the H4 charts for a while. From now, I'd only be trading D1 charts and hence I'd like to number my trades henceforth. Trade #1: Sell GBPUSD (Note: Uploaded ...
My Trading Journal
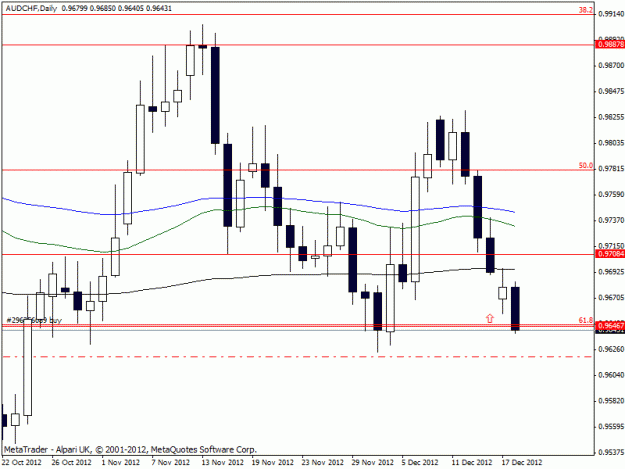
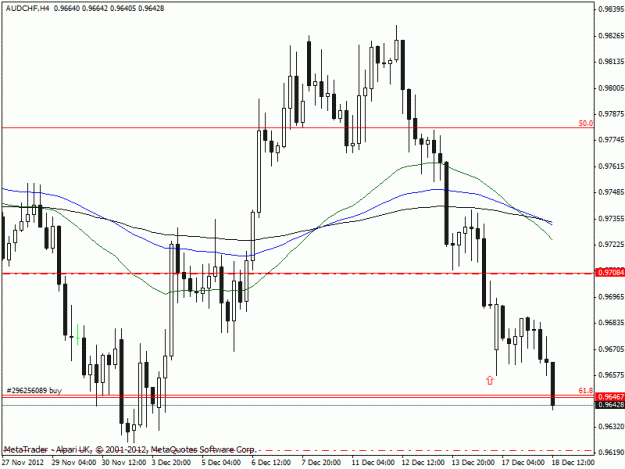
- gautam0597 replied Dec 18, 2012
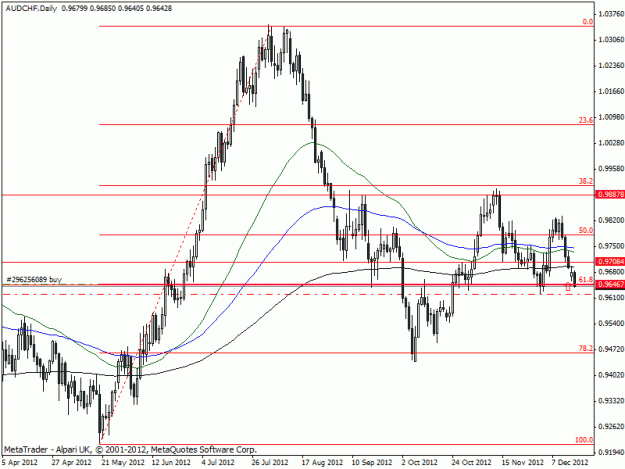
AUDCHF made a Double bottom formation at the significant 61.8% retracement of the bullish impulse wave from May 18 to Aug 2 (2012) The actual retracement was all the way down to 78.6 level but I thought 61.8 was a good level to buy this pair. This ...
My Trading Journal
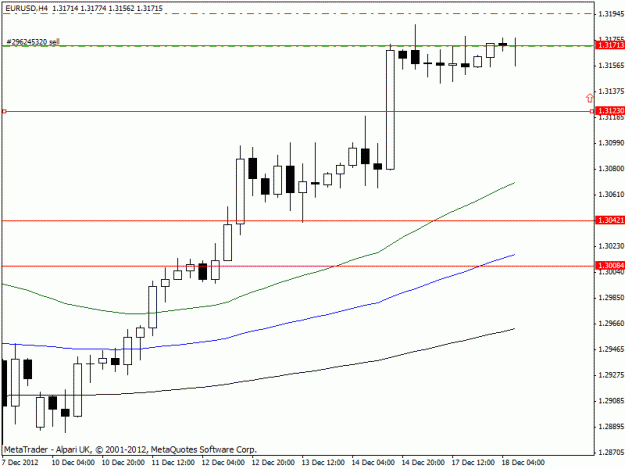
- gautam0597 replied Dec 18, 2012
A counter trend EURUSD trade. Sold from a resistance level upon signs of weakness. [email protected] TP:1.3123 SL:1.3195 My Risk=$100.00 & Reward=$200.00
My Trading Journal
- gautam0597 replied Dec 18, 2012
EURNZD Sell [email protected] S/L 1.5658 TP1 1.5563 TP2 1.5464. Took this trade because price has completed its correction and started moving south. Note the rejection from the core support turned resistance(red line) in confluence with the "magic moving ...
My Trading Journal

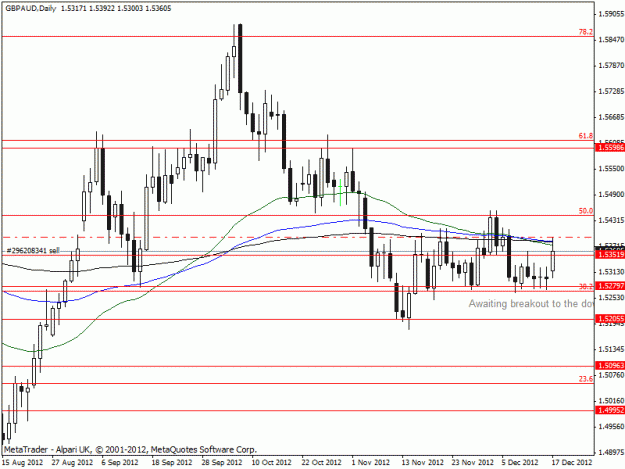
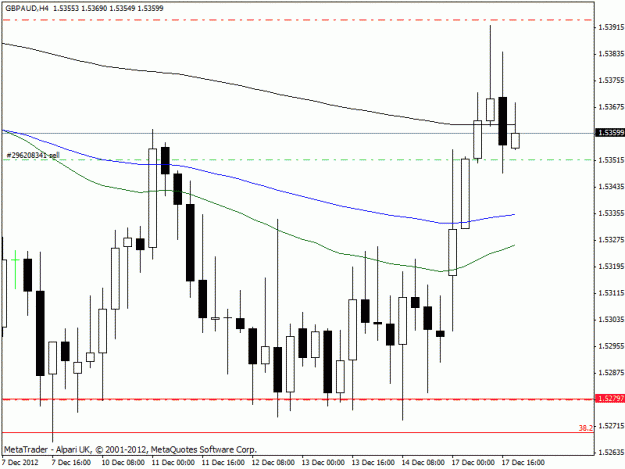
- gautam0597 replied Dec 17, 2012
After hitting the retracement level of 78.6% on the daily, the GBPAUD pair has resumed its move down. Therefore, going with the trend. Although at one point came awfully close to being stopped out. SOLD@ 1.5351 for a TP 1.5279; S/L 1.5394 My ...
My Trading Journal
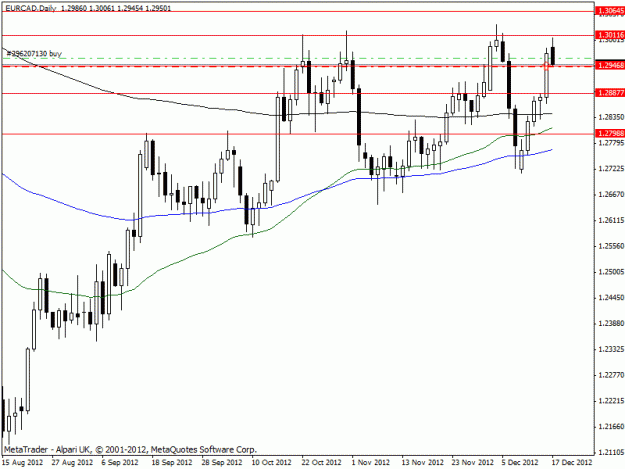
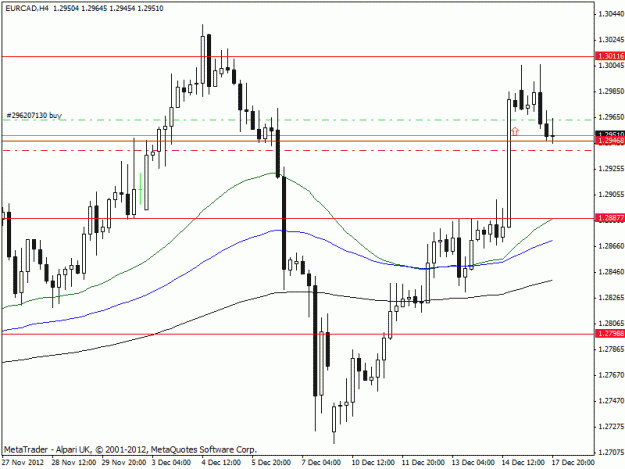
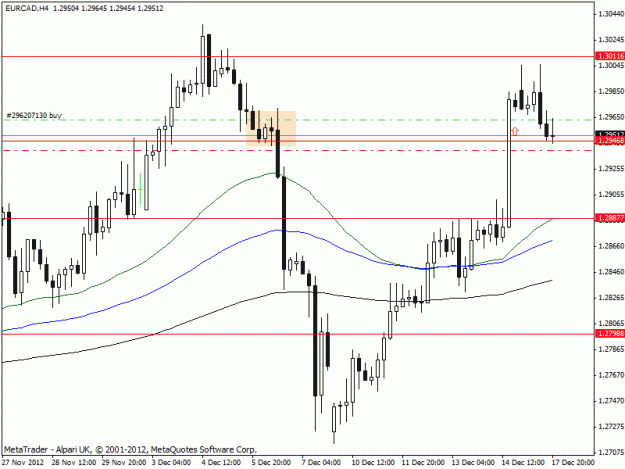
- gautam0597 replied Dec 17, 2012
I traded the EURCAD this time. I knew price being awfully close to the triple top resistance had to definitely test it before moving either way. I took an opportunity to buy up on a small correction on H4 as indicated by the rectangled box in the H4 ...
My Trading Journal
- gautam0597 replied Dec 17, 2012
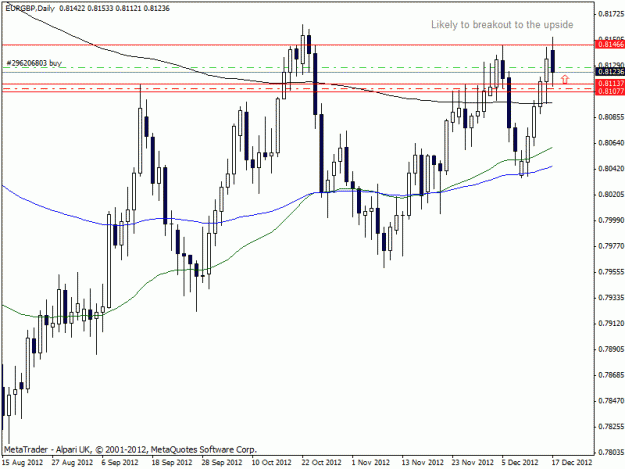
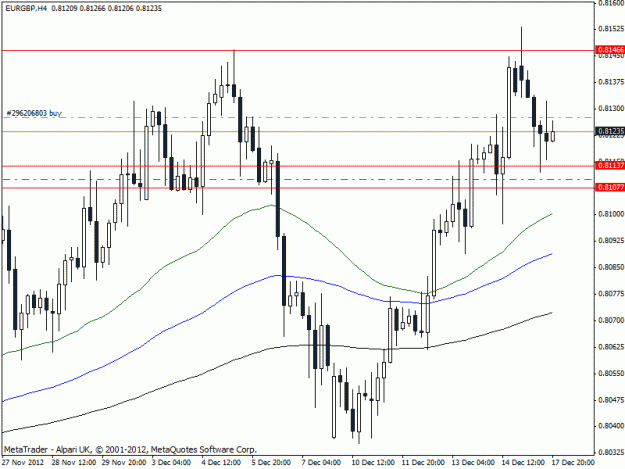
EURGBP - The Violent beast! Although the trade is now live, I feel I shouldn't have taken it in the first place till it actually broke through the triple top formation. The reason I took it in the first place is because price tried many times to go ...
My Trading Journal
- gautam0597 replied Dec 17, 2012
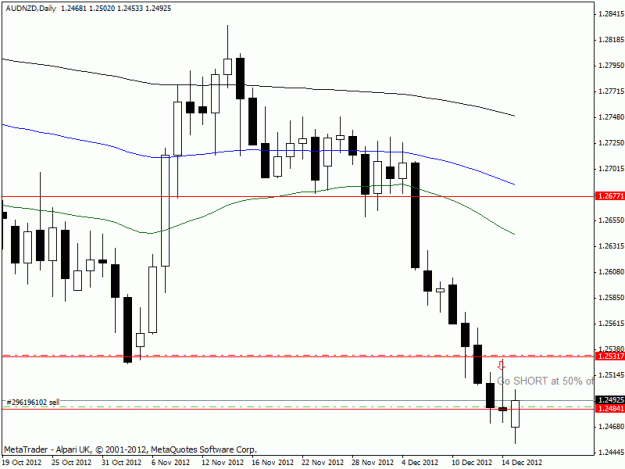
The sight of a huge pin bar is always a delight! Saw one of those on the Daily TF in a core support zone. Entered short at almost 25% of the Pin bar to continue to go down with the trend. SOLD@ 1.2486 for a TP 1.2407; S/L 1.2533 My Risk=$47.00 & ...
My Trading Journal

- gautam0597 replied Dec 17, 2012
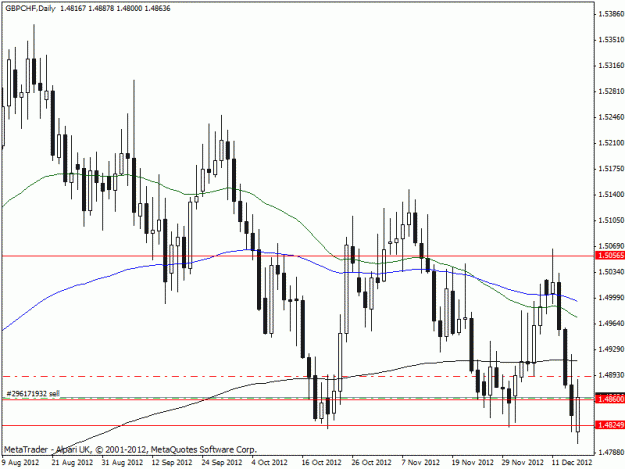
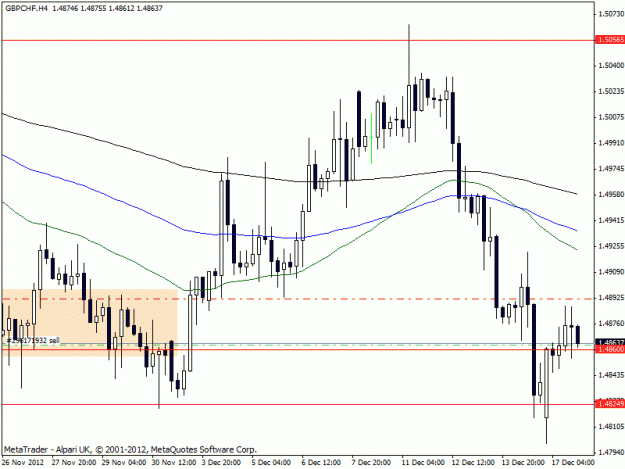
Classic case of support turned resistance. Highlighted box in the H4 chart is the zone. When it tested this zone before its next leg down, SOLD @ 1.4862(H4 support turned Resistance zone) for a TP 1.4758; S/L 1.4892 My Risk=$30.00 & Reward=$104.00 ...
My Trading Journal
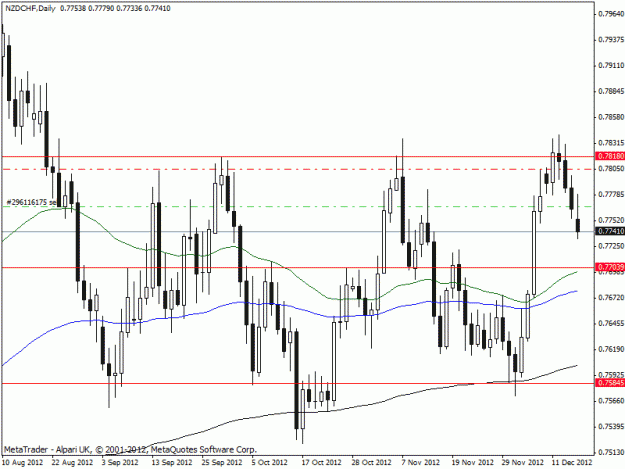
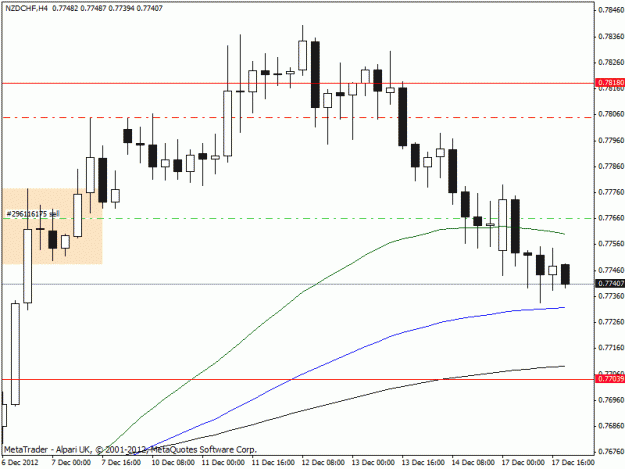
- gautam0597 replied Dec 17, 2012
NZDCHF this time. On the daily, this pair is coming down from a triple top formation contained in the retracement of a impulse move. So this time, I am going with the trend. From the H4 chart, you will be able to see in the colored box, the ...
My Trading Journal