- Search Forex Factory
- 29 Results
- fxslinger replied Nov 12, 2008
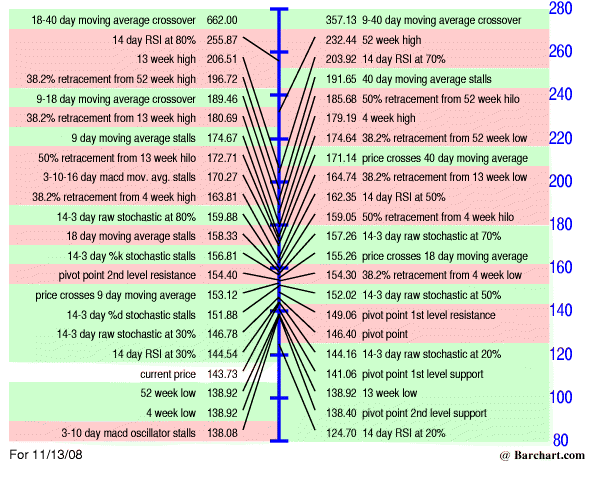
We stopped dropping at the pivot point support at 141.06. If this level goes, next support is 138.92. http://charts3.barchart.com/procal.asp?sym=^GBPJPY
Auslanco - GBP/JPY and GBP/USD (newstrade)
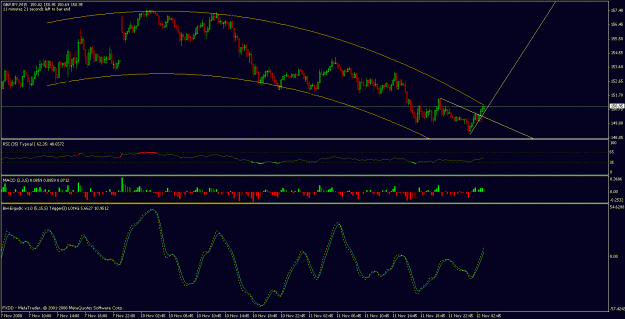
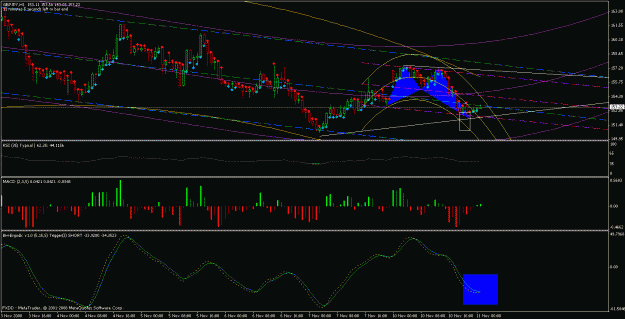
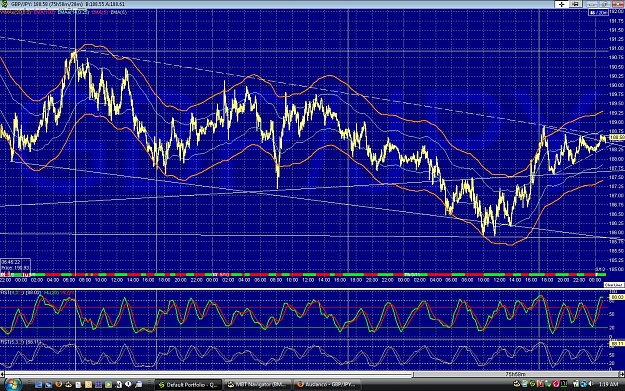
- fxslinger replied Nov 11, 2008
If it makes you feel any better, it's bumping it's head on the top of the polychannel on the 15 minute chart. Keep an eye out for a turn.
Auslanco - GBP/JPY and GBP/USD (newstrade)
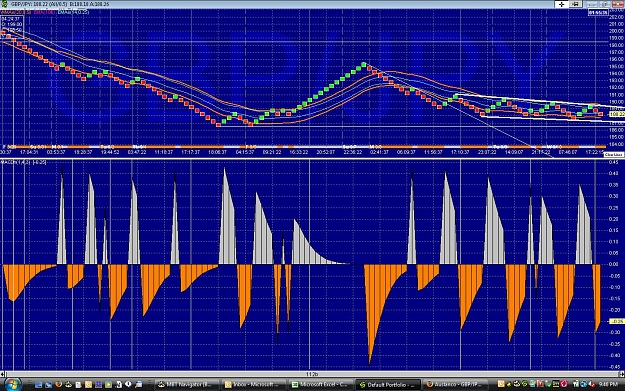
- fxslinger replied Nov 10, 2008
The channel on the 1 hour chart has turned up. The rsi, macd, and ergo agree.
Auslanco - GBP/JPY and GBP/USD (newstrade)
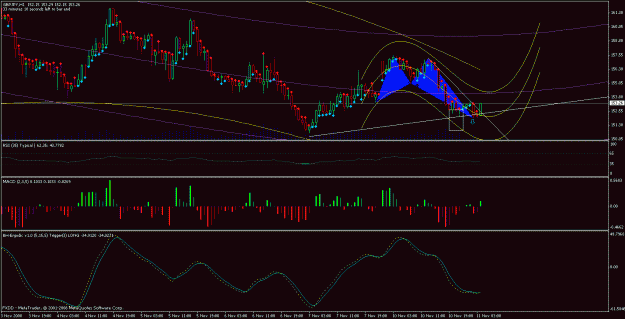
- fxslinger replied Nov 10, 2008
I think we're headed up later into the purple uptrending polychannel. The ergodic and macd on the 1 hour chart is agreeing also.
Auslanco - GBP/JPY and GBP/USD (newstrade)
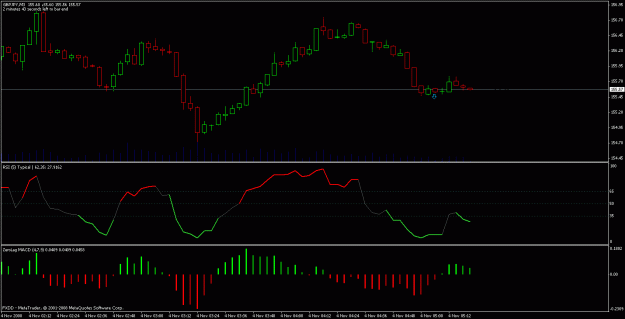
- fxslinger replied Nov 3, 2008
My 5 minute scalping chart struggled today. With Arezab's help, though, I figured out how to get the 3 minute chart going and it has worked awesome! I attached the template and indicators if you want to try it. Enter short when the RSI crosses down ...
Auslanco - GBP/JPY and GBP/USD (newstrade)
- fxslinger replied Oct 31, 2008
Choppy market, but you can still make money. Here's my 5 minute scalping chart. Last weekend I posted my 30 minute medium-term chart. I'm still an amateur, but hopefully someday I will be as good as some of the posters here. Anyway, I hope others ...
Auslanco - GBP/JPY and GBP/USD (newstrade)
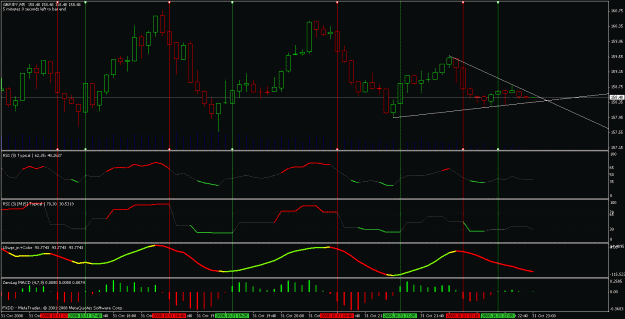
- fxslinger replied Oct 26, 2008
The LSWPR caught the moves this past week brilliantly. Check it out.
Auslanco - GBP/JPY and GBP/USD (newstrade)
- fxslinger replied Sep 12, 2008
We might be close to breaking out now, but the stochastic is pretty high, so it might take another dip first.
Auslanco - GBP/JPY and GBP/USD (newstrade)
- fxslinger replied Sep 10, 2008
GBPJPY daily wedge — What do you think about this wedge? It's on a Renko chart.
Auslanco - GBP/JPY and GBP/USD (newstrade)
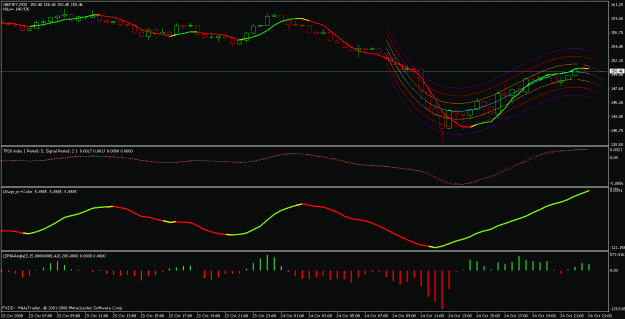
- fxslinger replied Nov 21, 2007
Your TRIX signals seem to be almost opposite mine. Here are my TRIX settings on MT4.
Auslanco - GBP/JPY and GBP/USD (newstrade)

- fxslinger replied Nov 21, 2007
Ok, I see what you mean now. My smoothing was set up to 5, but the 1, 5, and 60 were showing on the chart. Thank you for helping me set this up correctly. I fixed it now so the QQE is smoothed to 1 and 1, 5, and 60 are still showing on the chart. ...
Auslanco - GBP/JPY and GBP/USD (newstrade)
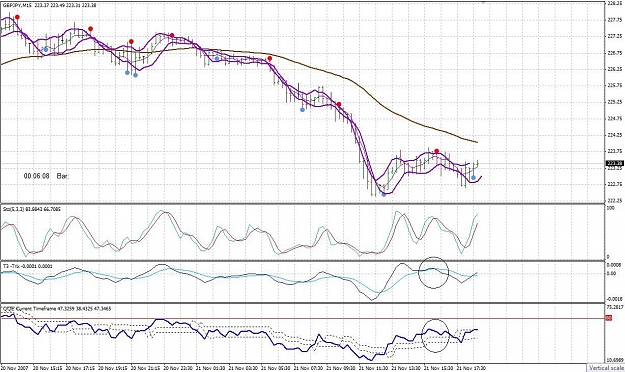
- fxslinger replied Nov 21, 2007
I have both QQE and TRIX on my chart, because the QQE doesn't crossdown sometimes and let me out of the trade in time while the TRIX does. You can see it in this example.
Auslanco - GBP/JPY and GBP/USD (newstrade)
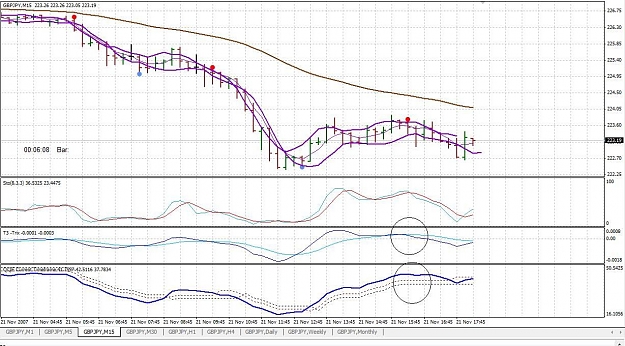
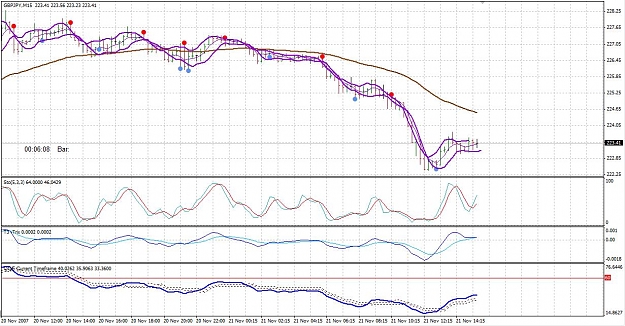
- fxslinger replied Nov 21, 2007
For the ones that get excited during these big down moves and have itchy trigger fingers to go long, slap a TRIX(18,10) on your 15 minute chart and enter the trade once it crosses up. This will minimize the risk of catching a falling knife. Check it ...
Auslanco - GBP/JPY and GBP/USD (newstrade)
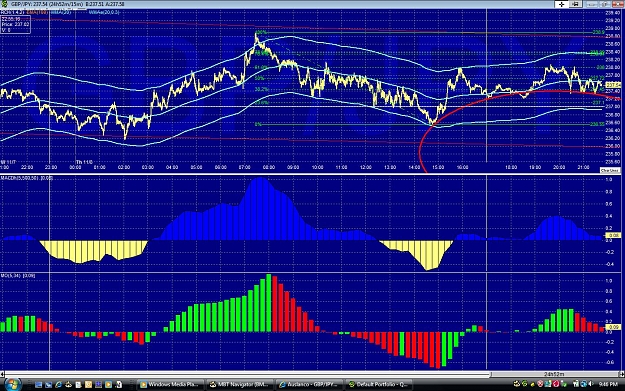
- fxslinger replied Nov 9, 2007
Once that resistance line is broken through, the retrace should pick up steam. The 38.2% fib level looks reachable (which is at 233.82).
Auslanco - GBP/JPY and GBP/USD (newstrade)
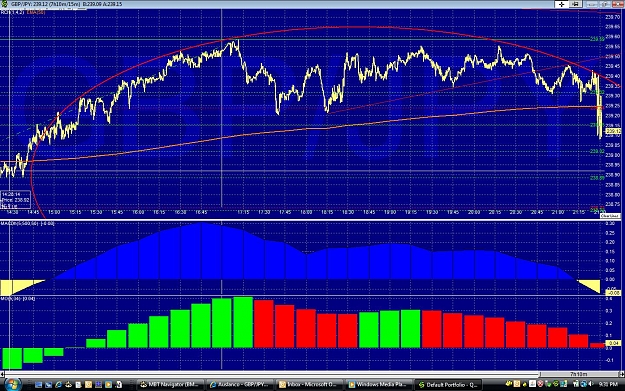
- fxslinger replied Nov 9, 2007
I think the elevator his hit the bottom floor. The SPX max pain is 1525 and it double-bottomed at 1450, so I think it will rise for the next week. We all know how GBPJPY follows the SPX during the US forex trading period...
Auslanco - GBP/JPY and GBP/USD (newstrade)
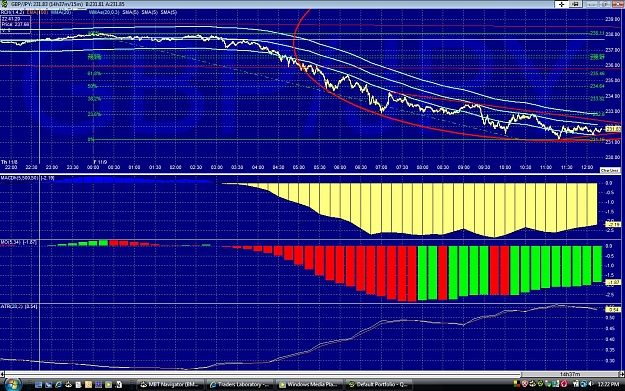
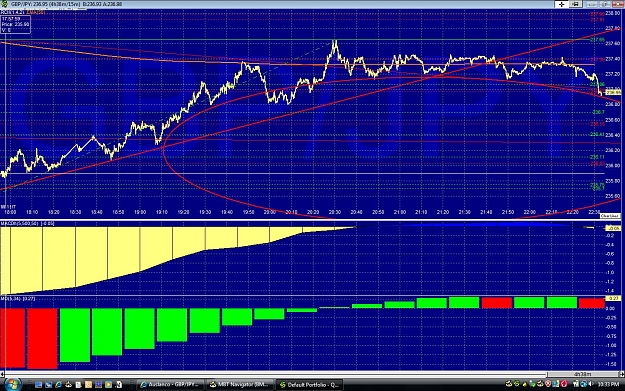
- fxslinger replied Nov 8, 2007
This chart shows the circle better. 236.50 should be reachable.
Auslanco - GBP/JPY and GBP/USD (newstrade)
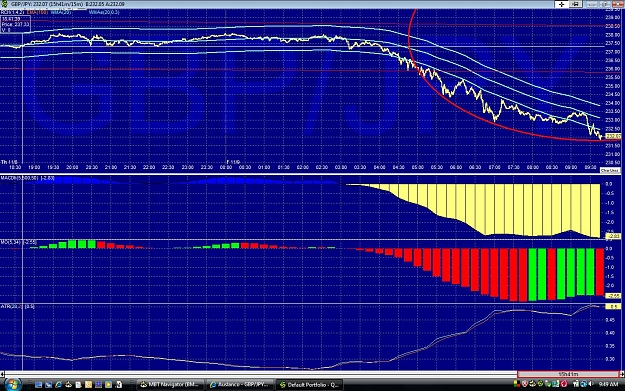
- fxslinger replied Nov 8, 2007
I think it's about to plummet down the right side of the circle. Let's watch...
Auslanco - GBP/JPY and GBP/USD (newstrade)
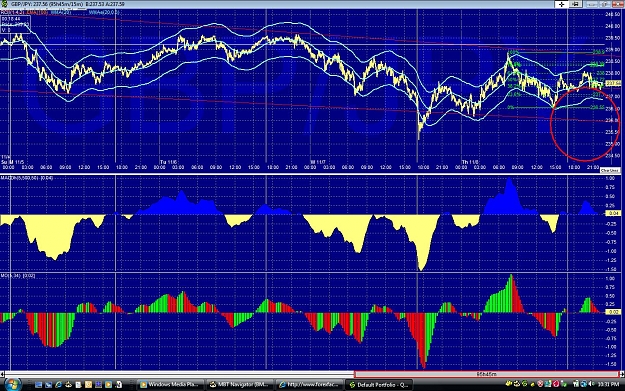
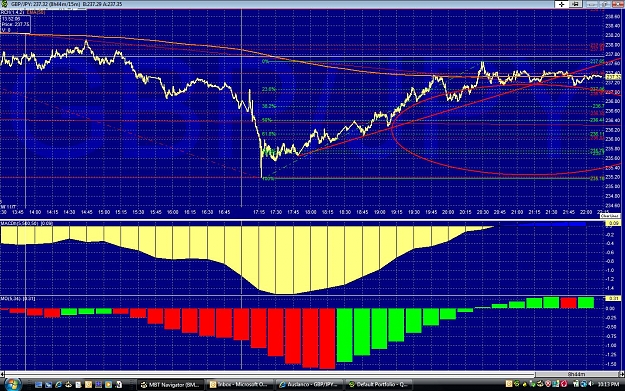
- fxslinger replied Nov 7, 2007
Nailed it. This is what it looks like now.
Auslanco - GBP/JPY and GBP/USD (newstrade)
- fxslinger replied Nov 7, 2007
We're getting ready to turn down the right side of the circular support in my opinion.
Auslanco - GBP/JPY and GBP/USD (newstrade)
- fxslinger replied Nov 6, 2007
Are we doing a 180 soon ? (resistance is top part of the circle)
Auslanco - GBP/JPY and GBP/USD (newstrade)