- Search Forex Factory
- 25 Results (1 Thread , 24 Replies )
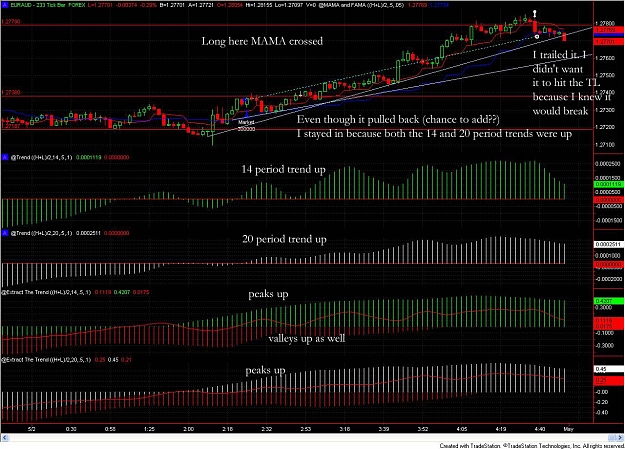
- daniel242 replied May 2, 2012
EURAUD 5/2. Good play on AUD/USD weakness and weak dollar. This chart is really funny because if you look at the EU session and the NY session it makes a big smile. I trailed this fairly hard because I knew that if it came back to the TL it would ...
Anyone know about MAMA/FAMA moving averages?
- daniel242 replied Apr 19, 2012
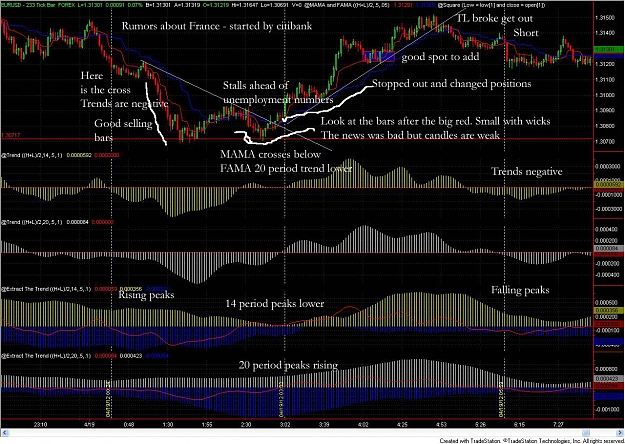
Today's EURUSD Not as exciting as I would like it for a Thursday. I guess it will take a country with rising debt costs, a new arms race, and bad economic data to move the markets. Oh, wait. That all happened today. I guess everyone is just waiting ...
Anyone know about MAMA/FAMA moving averages?
- daniel242 replied Apr 18, 2012
I'm not sure how I got placed in Platform Tech. I quess because I asked about codes and programming. oh well. My goal with this is and the indicators I am playing with is to quanify my trading and put what I have been doing (with success) in clearer ...
Anyone know about MAMA/FAMA moving averages?
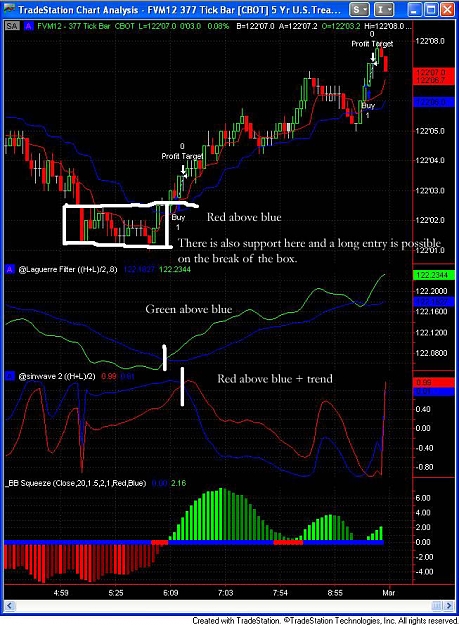
- daniel242 replied Apr 16, 2012
This shows why this system could fail and why it is not perfect. It doesn't adapt to the quick change in the market. This is the 5 year treasury futures. A really dull product to trade but it can be simple to trade at times and can create good cash ...
Anyone know about MAMA/FAMA moving averages?
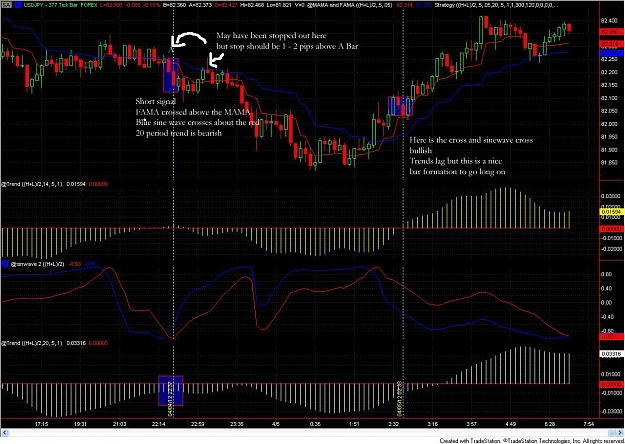
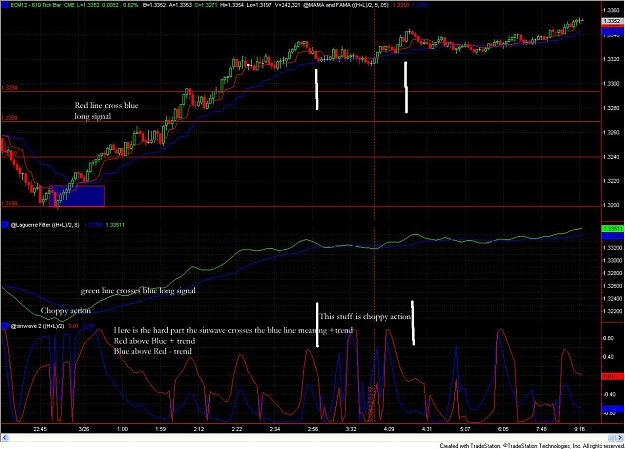
- daniel242 replied Apr 12, 2012
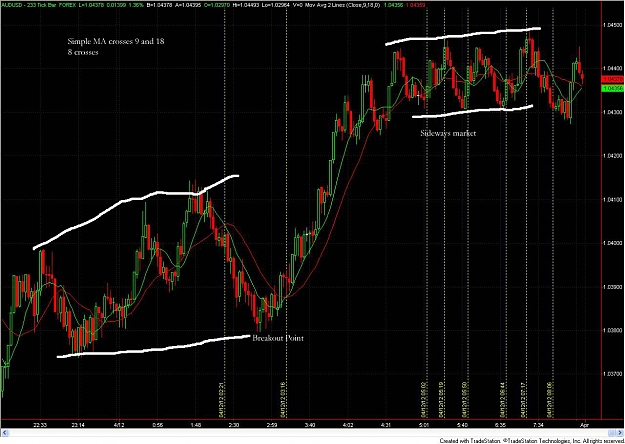
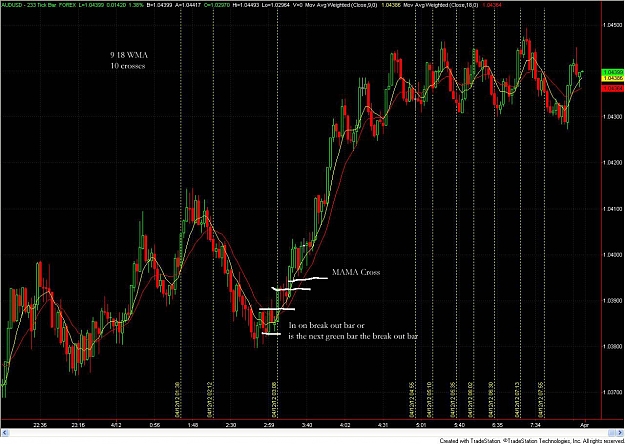
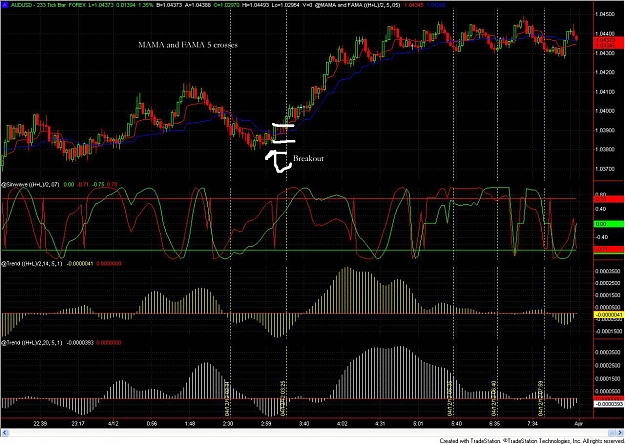
Thanks for the posts. Take a look at these charts. MAMA and FAMA, 9/18MA and 9/18WMA. Check out the number of crosses as the AUD goes sideways. Also, look at where the break out bar is and where the MA's cross. That break out might be hard to catch ...
Anyone know about MAMA/FAMA moving averages?
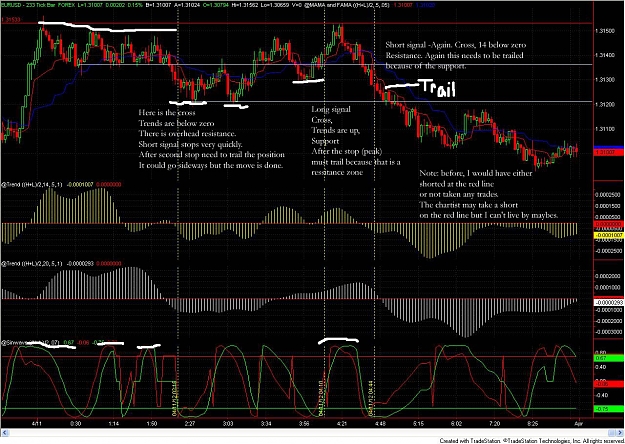
- daniel242 replied Apr 11, 2012
EURUSD today 4/11. Lots of signals. Do you trade them all or just 1 or 2?
Anyone know about MAMA/FAMA moving averages?
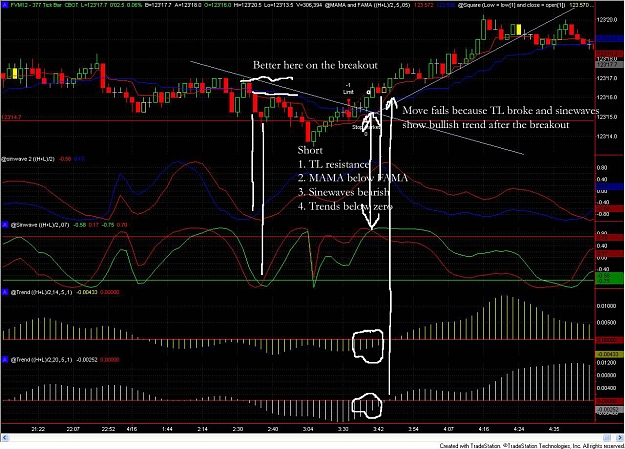
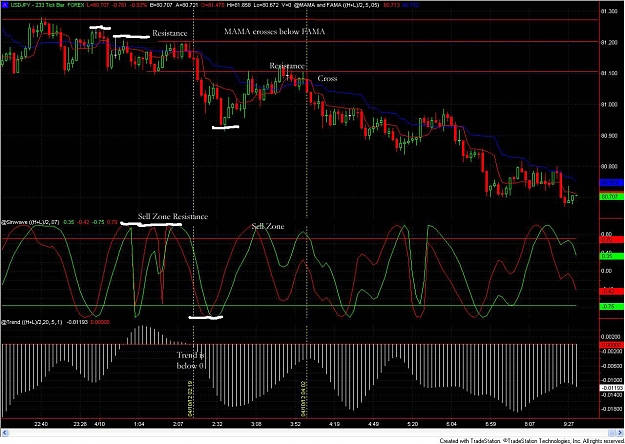
- daniel242 replied Apr 10, 2012
Here is the USDJPY today. Rules when the sinewave goes above 70 that is resistance - then look for the MAMA FAMA cross and trend line below 0. The yen has offered some really nice setups. I wonder how long it will last. It was really hard to trade ...
Anyone know about MAMA/FAMA moving averages?
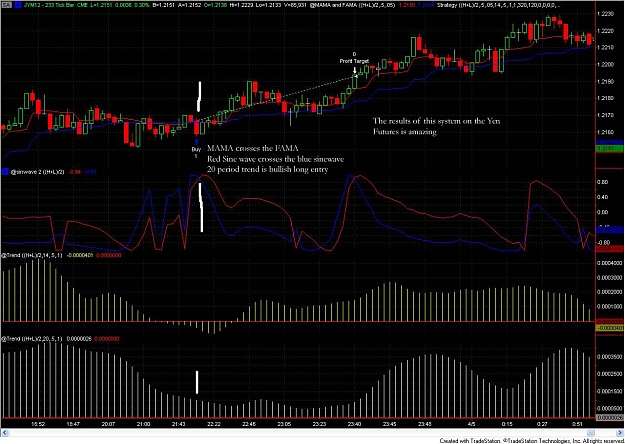
- daniel242 replied Apr 5, 2012
More MAMA FAMA — The MAMA FAMA work very well. I am using it with a sinewave oscillator and a trend oscillator. The rules are simple buy when the red MAMA crosses the blue FAMA and the RED sinewave crosses the blue sinewave and when the trend ...
Anyone know about MAMA/FAMA moving averages?
- daniel242 replied Mar 26, 2012
Another Chart — This is one of my favorite products to trade, the 5 year treasury note. It can be really dull at times, like watching gross grow, but it provides lots of low risk entries 3-5 days a week. The 10 year treasury note future is the ...
Anyone know about MAMA/FAMA moving averages?
- Anyone know about MAMA/FAMA moving averages?Started Mar 26, 2012|Platform Tech|19 replies
I apologize if a thread like this already exists. I did a search for it but couldn't find much. ...
- daniel242 replied Sep 28, 2010
I haven't posted a chart in a really long time. I have changed how a I am trading a little. I moved away from 1m charts to a 233tick chart. It takes less than a minute for a bar to print sometimes and sometimes it will take about 10 mintues. Usualy ...
Price Action System 1min charts
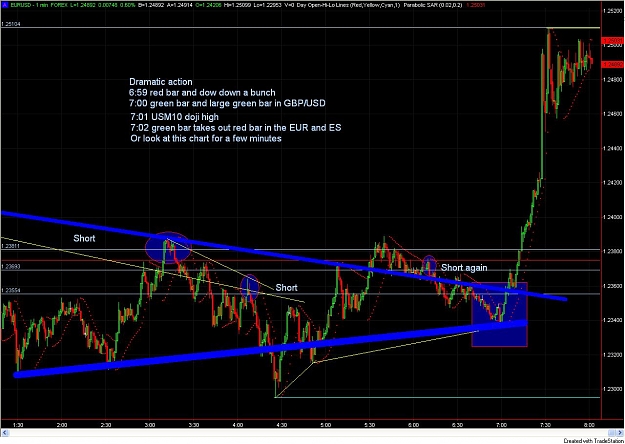
- daniel242 replied May 20, 2010
I can’t believe I missed this one. My notes are on the chart. I hope everyone can read it. I knew there was going to be a big move in the EUR/USD. With the DOW down 300 and ES almost falling off the chart, I knew something was going to happen. I was ...
Price Action System 1min charts
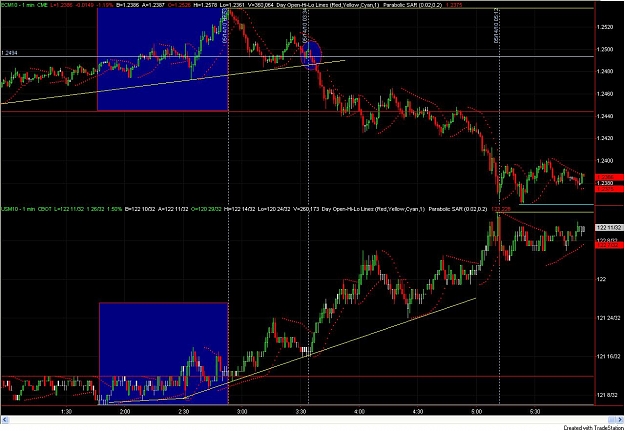
- daniel242 replied May 14, 2010
I wonder if this was an indicator that the EUR was going to sell off. Top chart is EC (futures EURO contract) and bottom chart is USM10 (30 year t-bill futures). The blue rectangles they are both rising in early New York market. The yellow line on ...
Price Action System 1min charts
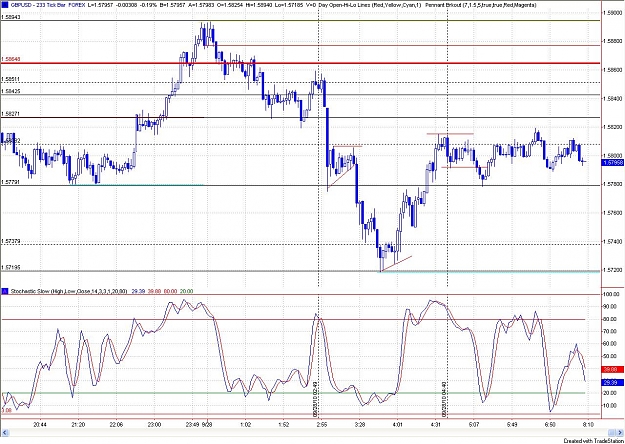
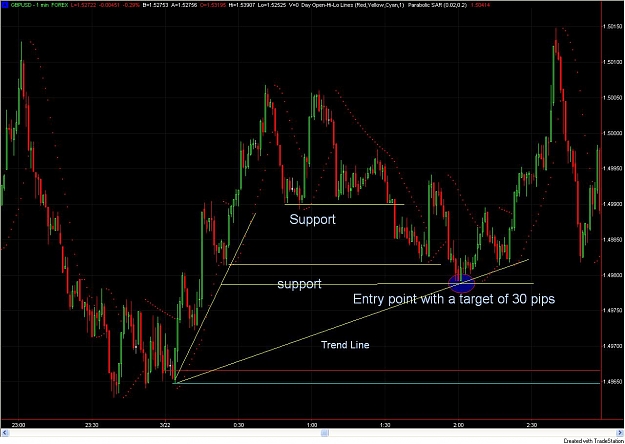
- daniel242 replied May 2, 2010
Here is an example of what I was talking about with midtrend lines. This is from the GBPUSD from March 22. Those yellow support lines tell me that there is going to be a long entry coming. I just have to wait for three of them or for three hits one ...
Price Action System 1min charts
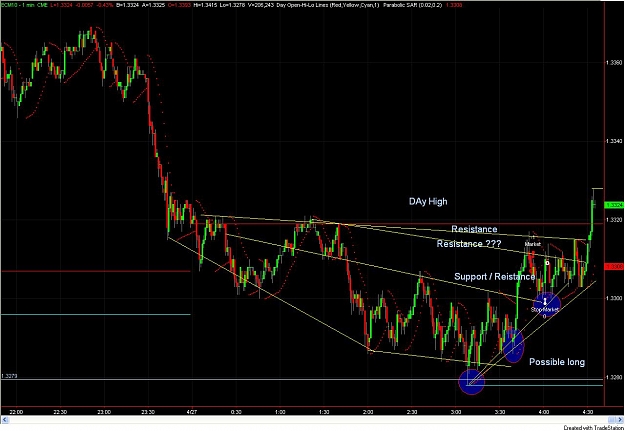
- daniel242 replied Apr 27, 2010
Thanks for the post. I hope you can see the chart. I saved it as a jpeg right from trade station. This is the ECM10 euro futures, it is the same as the FX Euro. The price is a few pips different but moves are the same. Around 3:00 my chart (9:00 ...
Price Action System 1min charts
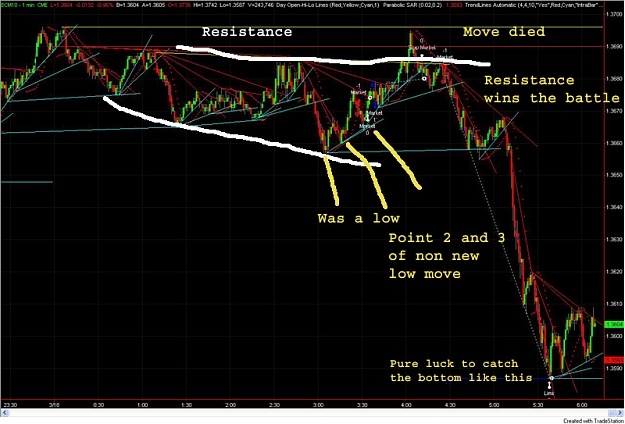
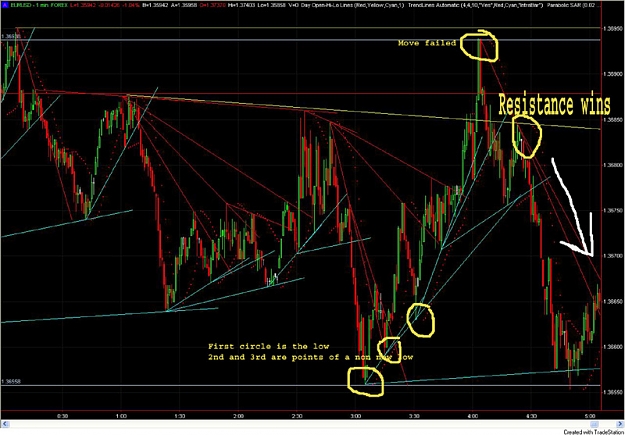
- daniel242 replied Mar 18, 2010
I'm slowly getting back on track. Today in the EUR/USD was a good example of the battle between support and resistance. Resistance formed after it made a high after 6am or after midnight my time. Around 3:00 a low is formed and a non new low pattern ...
Price Action System 1min charts
- daniel242 replied Feb 9, 2010
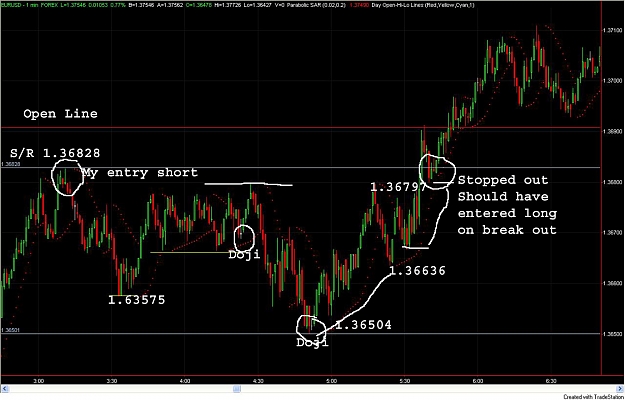
Yesterday was a dull day with a couple of bad trades. This is one from the EUR/USD. I entered short around 1.36828, the S/R Line. I sent my target a few pips below the low of the day. My stop 1.36900. It bounced around a little for like 45 minutes. ...
Price Action System 1min charts
- daniel242 replied Jan 31, 2010
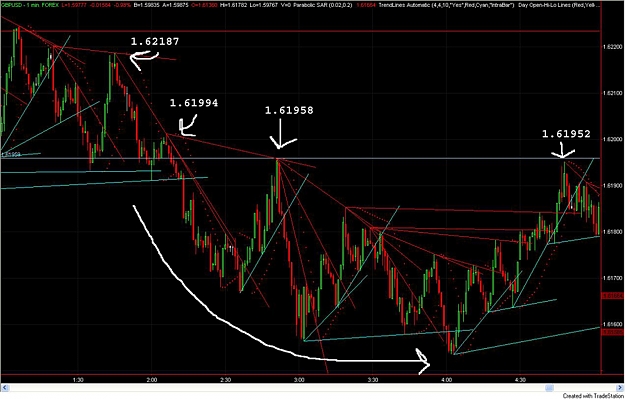
I'm curious, how would other people see this chart. I saw something similar to this, this week. The chart is 1m GBPUSD from 12/18/2009. As you can see it is making lower highs and lower lows but does start to turn. After my arrow there is a blue ...
Price Action System 1min charts
- daniel242 replied Jan 29, 2010
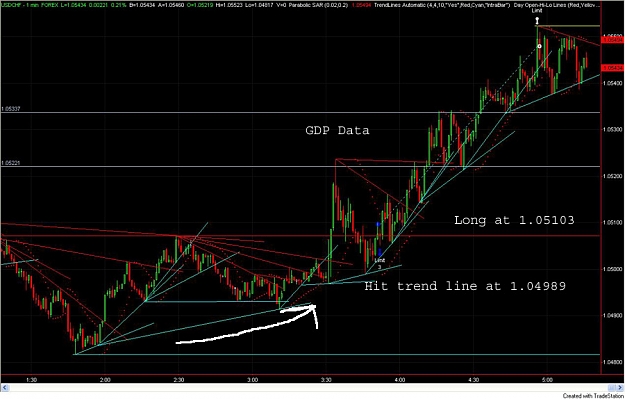
This is an example of how I play the news. I did the same move in the EUR/USD. I didn't get the best entry. This is the USD/CHF. I went long at 1.05103. News came out, spike up to 1.05237. Then came back to 1.04989. A few bars later I jumped in. I ...
Price Action System 1min charts
- daniel242 replied Jan 27, 2010
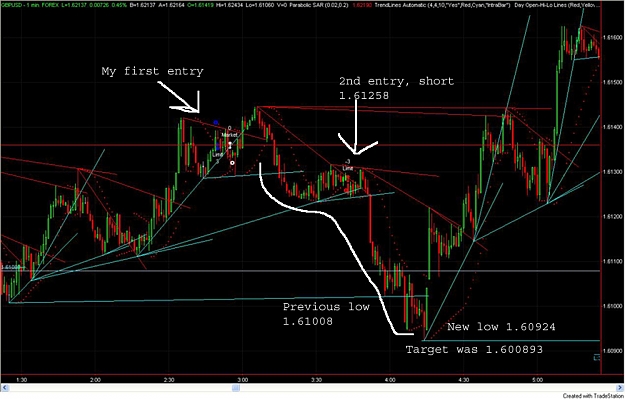
Taken to the cleaners . . . . GBP/USD This was a trade yesterday that was going really well and then. . . . This was premarket New York close to the open. My 1st entry was long and quickly stopped out. I put a short stop on that one. I thought it ...
Price Action System 1min charts