- Search Forex Factory
- 8 Results
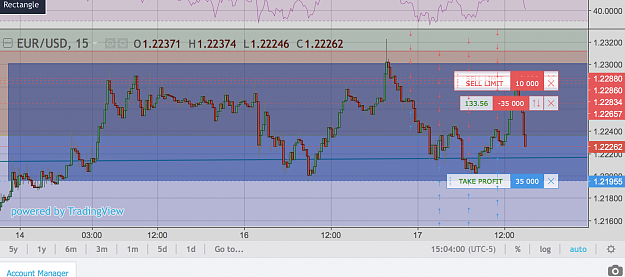
- carlosap1125 replied Jan 24, 2018
Something that personally helps me find success in trading is understanding that the eur/usd usually moves 80-110 pips in the day. I woke up late unfortunately but once I saw that the price had exited the rectangle and broke the pennant it was a ...
EURUSD only
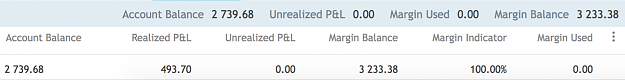
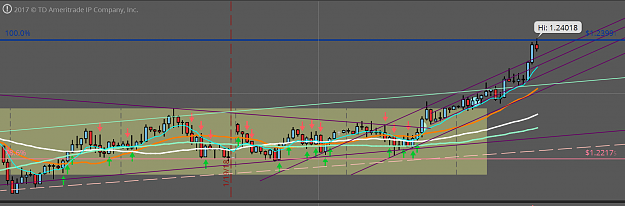
- carlosap1125 replied Jan 17, 2018
Ive been making a decent amount off this rectangle and I think 1.22 is where this run stops image Im waiting for a pullback to add more but man this thing kept running so I kinda regret not going in strong to begin with Edit: I still feel that the ...
EURUSD only
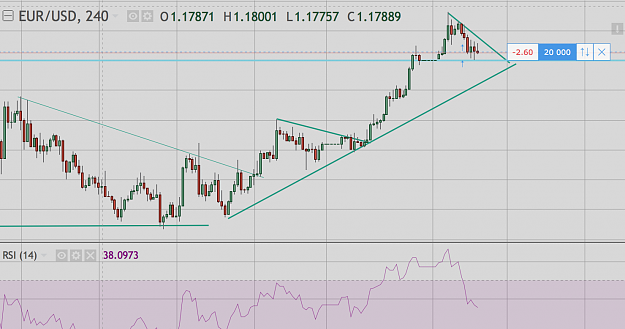
- carlosap1125 replied Jan 12, 2018
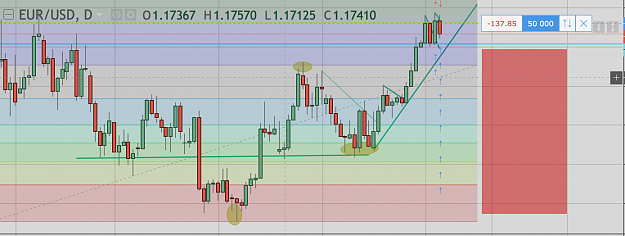
I think the trendline rejected the bulls plus the daily range might be maxed out. Im thinking the bears take it from here image
EURUSD only
- carlosap1125 replied Jan 12, 2018
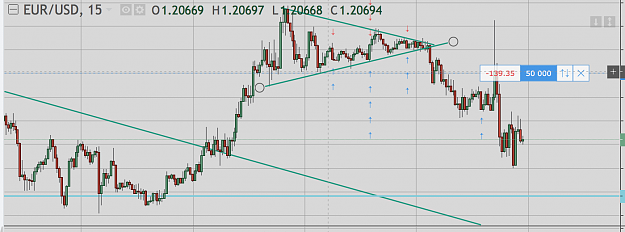
the reaches the fib 1.41 anyone else think it retraces? image
EURUSD only
- carlosap1125 replied Jan 10, 2018
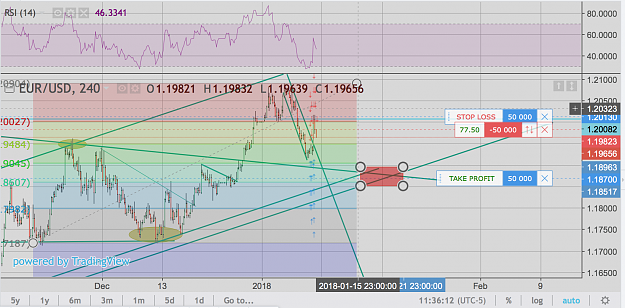
image It reached 1.2 and hit my took profit unfortunately I woke up too late and didn't get bet back immediately so my sell position is a bit lower than I wanted but next target is 1.88 possible lower. SL is 1.2
EURUSD only
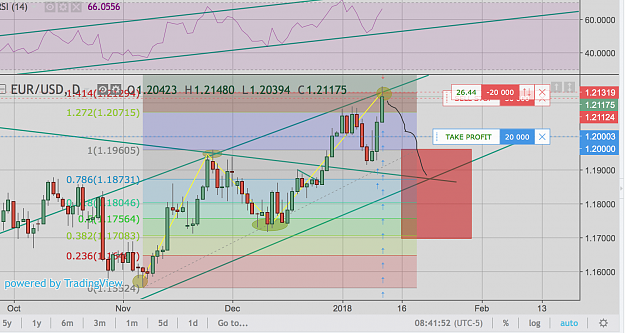
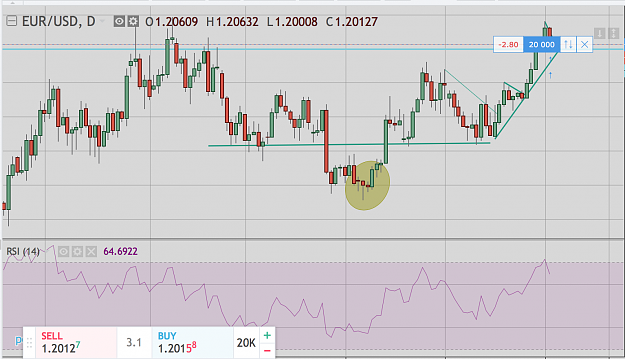
- carlosap1125 replied Jan 5, 2018
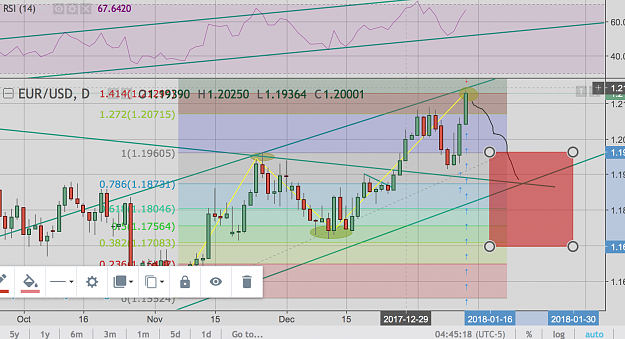
This isnt a traditional ABCD pattern but there could be a chance it retraces into the red area. I would switch to shorting if one of two things happen. The support at 1.2008 is broken or the trendline I have is broken. Unfortunately I was realllly ...
EURUSD only
- carlosap1125 replied Jan 3, 2018
I agree, like pipfu said though I don't think we should forget other deeper support lines The most recent high hit the 1.27 line of my previous fib retracements so I could see in retracing to the 1.0 retracement line At the same time Im trading ...
EURUSD only
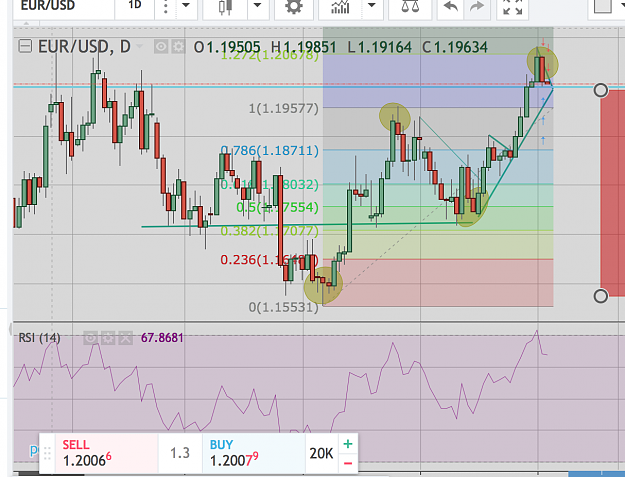
- carlosap1125 replied Jan 3, 2018
image image I haven't seen anyone mention the 1.199 region as a support, I have that as a support on the daily range. I normally trade trend lines, patterns and RSI. From what I see personally is the RSI is getting a breather after tapping out ...
EURUSD only
- Posts by Member Search: 'carlosap1125'