- Search Forex Factory
- 21 Results
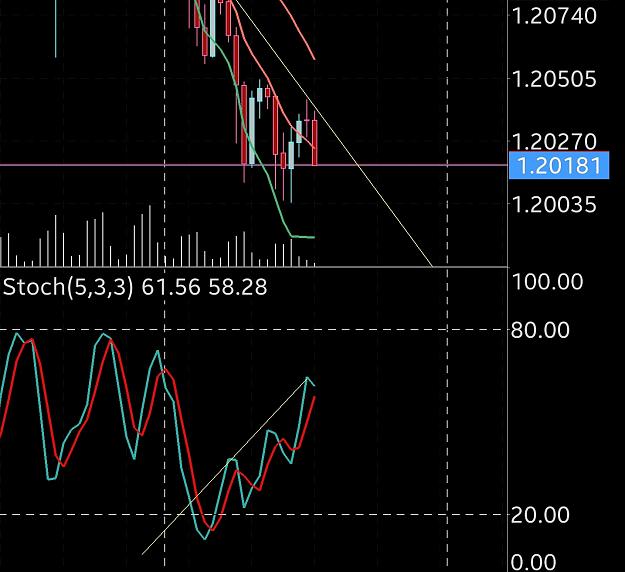
- bromanbdc replied Sep 20, 2021
This is what I see. Yes, this is monthly timeframe. I concur with Patience. The head and shoulders on the monthly Stochastic is signaling a drop to the 1.12 to 1.11 area. Should happen by the end of September. That does not mean that there will not ...
EURUSD
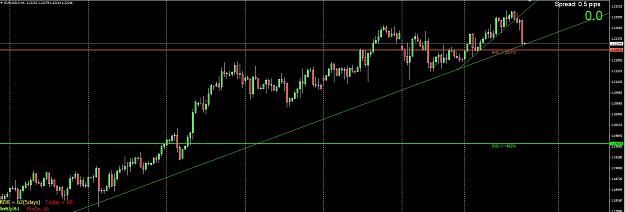
- bromanbdc replied Feb 8, 2021
Inverse head and shoulders on the4 hour time frame. Waiting for the break and close above 1.20545. If no break, I will reassess and take a sell. I don't see it happening today.
EURUSD only

- bromanbdc replied Feb 8, 2021
Inverse head and shoulders on the4 hour time frame. Waiting for the break and close above 1.20545. If no break, I will reassess and take a sell. I don't see it happening today.
EURUSD
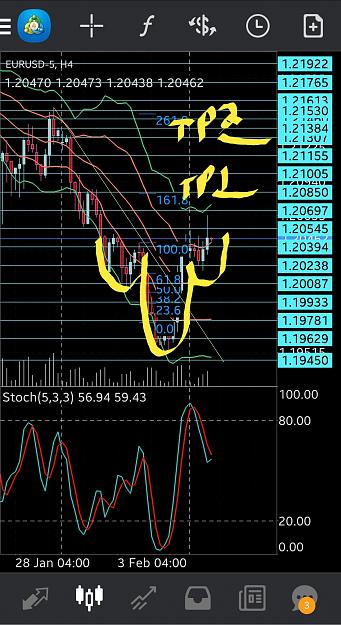
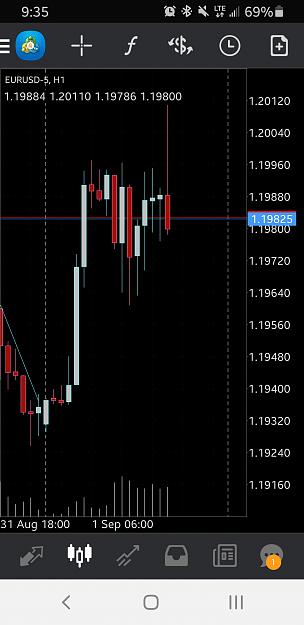
- bromanbdc replied Feb 3, 2021
I am not currently in a trade. I am seeing some divergence on the 4 hour chart. I will wait for price to break above the yellow trend line to take a buy. Having said that, it could fall to the 1.19800 area first, seeing as how this is a 4 hour ...
EURUSD

- bromanbdc replied Feb 3, 2021
I am not currently in a trade. I am seeing some divergence on the 4 hour chart. I will wait for price to break above the yellow trend line to take a buy. Having said that, it could fall to the 1.19800 area first, seeing as how this is a 4 hour ...
EURUSD only
- bromanbdc replied Dec 31, 2020
Watching this trend line. I will be on the sidelines until next week. Happy New Year all!
EURUSD only
- bromanbdc replied Dec 31, 2020
Watching how we deal with this trend line. I will be on the sidelines until next week.
EURUSD

- bromanbdc replied Sep 1, 2020
Time to see how the hr will close. Currently definitely not a bullish candle!
EURUSD
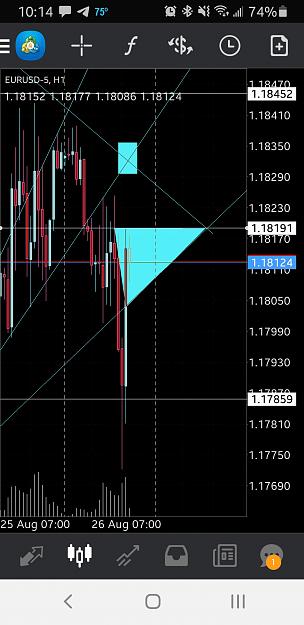
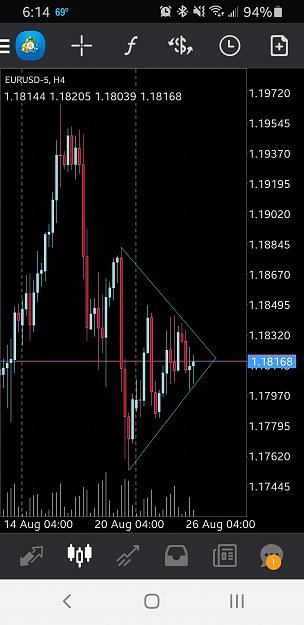
- bromanbdc replied Aug 26, 2020
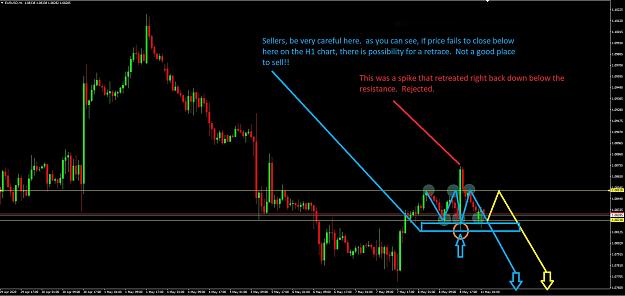
This is what I see. If price stays constricted between center line and lower triangle leg, I am looking for a break to the down side. Just my take.
EURUSD
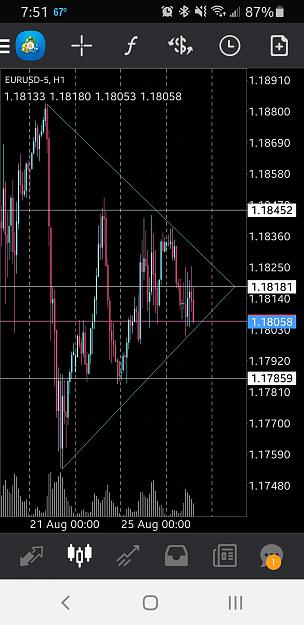
- bromanbdc replied Aug 13, 2020
image This is what I was talking about. I use all of these lines for retracement entries and confirmations.
EURUSD
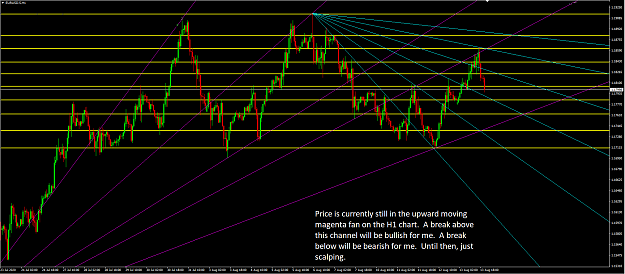
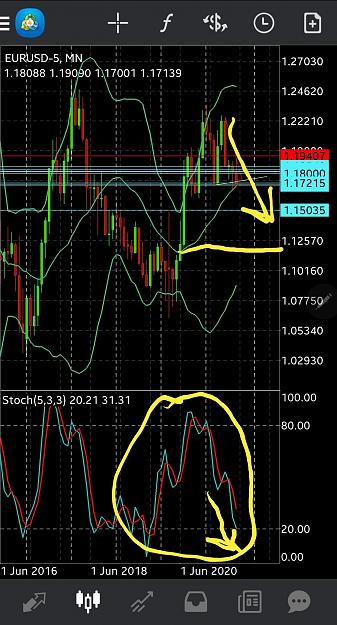
- bromanbdc replied May 10, 2020
This is my take on the pair. It is hard to say with the whole world going through a big mess, so anything could happen. And obviously waiting for price to break before making a decision. PA may not necessarily follow the blue line. It may retest the ...
EURUSD
- bromanbdc replied Nov 11, 2017
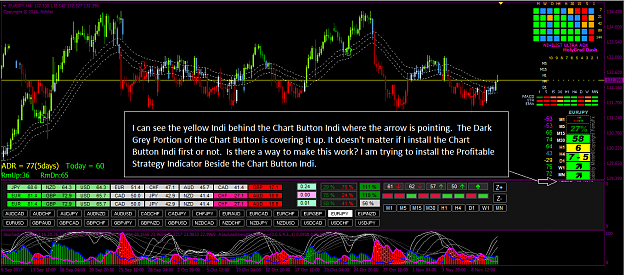
I do have a question about the chart button indicator. Is there any way to change the width of the indicator? I'll explain. On the right hand side, where the Ding Dong EA sits, I would like to put another indicator instead. However, when I do that, ...
Southern Cross Trader
- bromanbdc replied Nov 11, 2017
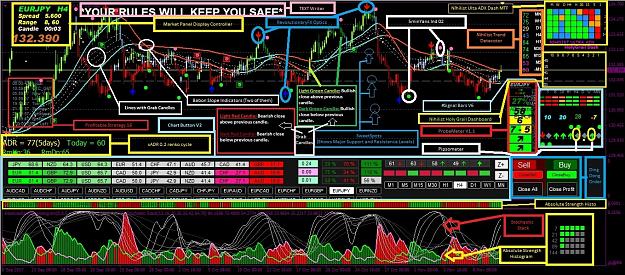
Found some problems. Fixed them. This should now be correct. image
Southern Cross Trader
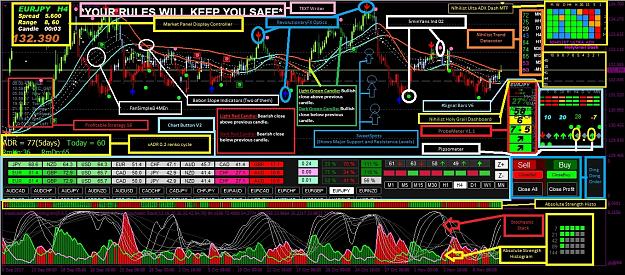
- bromanbdc replied Nov 11, 2017
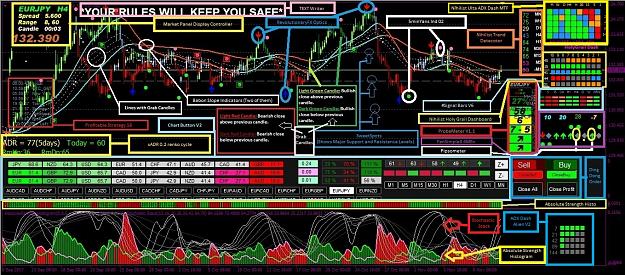
I know there are some newbies out there that don't know which indicators are which, so here is a screenshot with all of the indi's labeled. I apologize that it is a little tight, but not much space to work with. If someone notices a discrepancy, ...
Southern Cross Trader
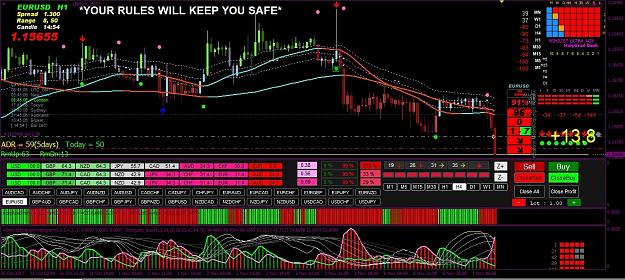
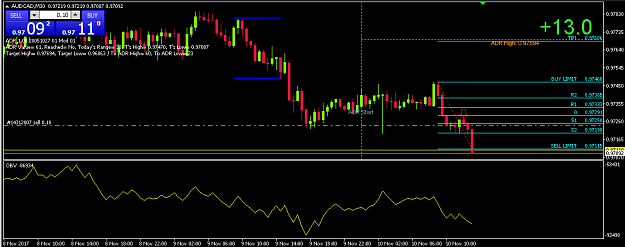
- bromanbdc replied Nov 10, 2017
image 13 pips and out. Template is on a different chart, so please disreguard the indis on the chart.
Southern Cross Trader
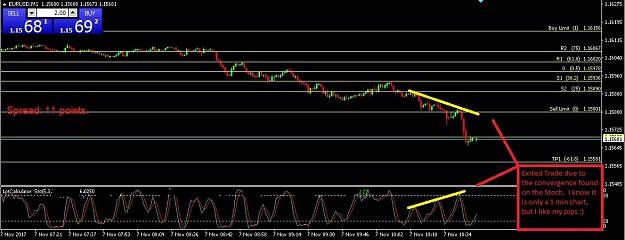
- bromanbdc replied Nov 7, 2017
image image First time using this system. So far, so good. I do have other entry criteria, but this is very helpful to complete my strategy! You all are amazing. I just found this thread about 2 days ago, and have read through it several times, ...
Southern Cross Trader