- Search Forex Factory
- 21 Results
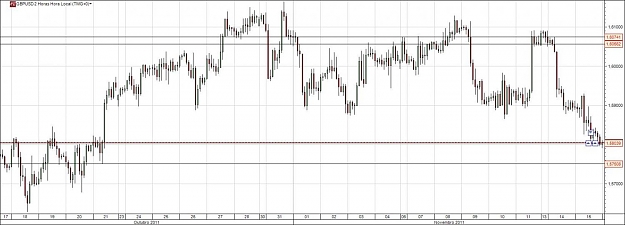
- branco replied Nov 15, 2011
I'm actually looking for some demand at these levels on cable. Positioned longed accordingly.
Price is everything
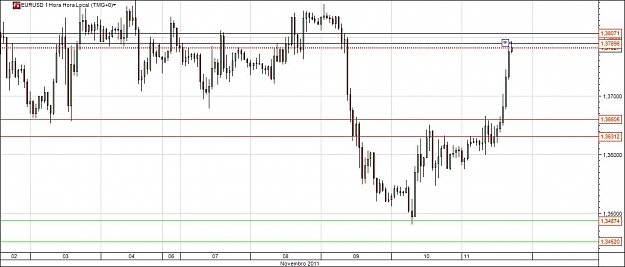
- branco replied Nov 11, 2011
EUR/USD — Short on EUR/USD @ 1.3791 Expecting some supply here, hoping it turns lower for the rest of the day.
Price is everything
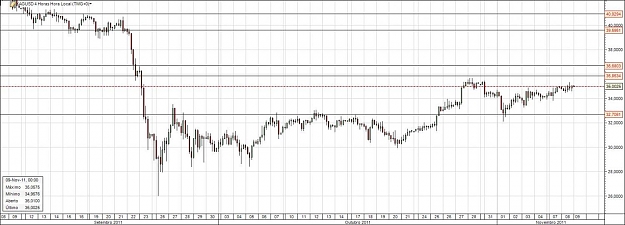
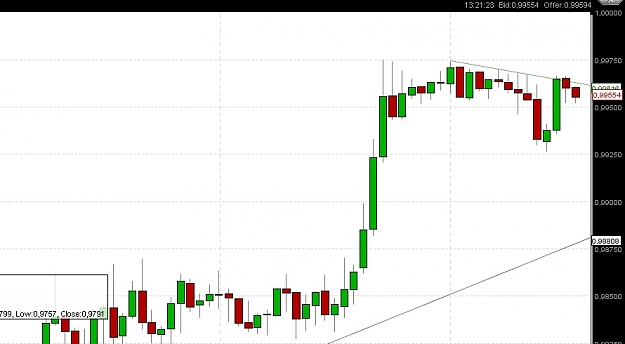
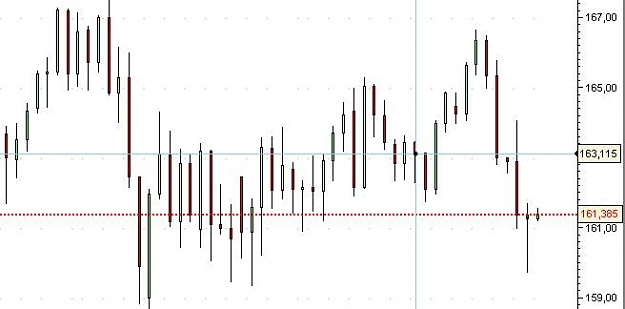
- branco replied Nov 8, 2011
XAG / USD — Preparing the market for tomorrow I came across this picture for XAG / USD, contemplating a possible short around 35.85 Would you guys call this latest upward leg a compression pattern?
Price is everything
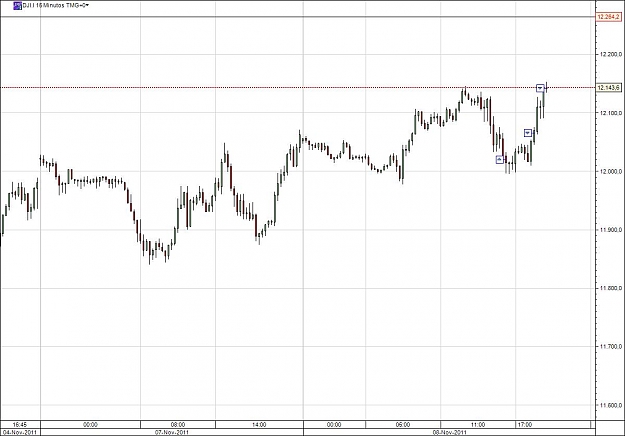
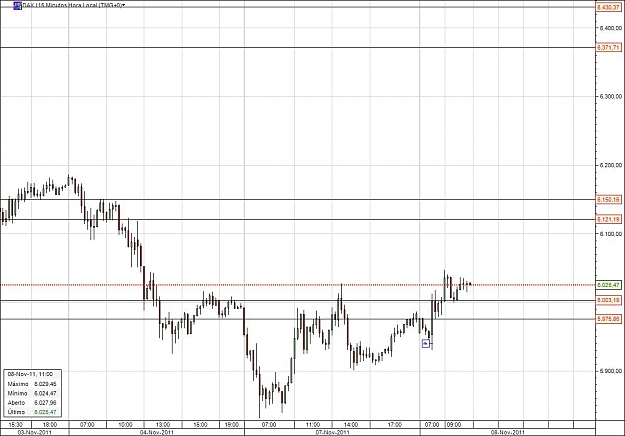
- branco replied Nov 8, 2011
Didn't enter the DAX again but caught a similar demand zone on the DJI for 120 points. Tomorrow I expect some supply over 12260 there and around 6150 for the DAX. It was a great day. Good luck for everyone still trading.
Price is everything
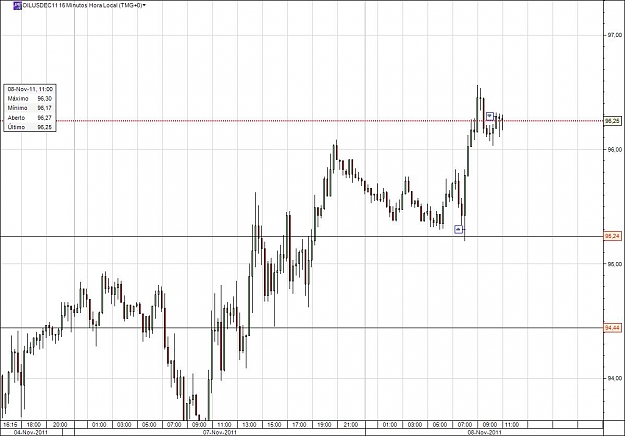
- branco replied Nov 8, 2011
Wanted just to share 2 trades that I had planned and I left with limit orders while I was sleeping. The first is in US Crude where the market was kind enough to give me back what was lost yesterday. After missing my target for 4 cents I closed it ...
Price is everything
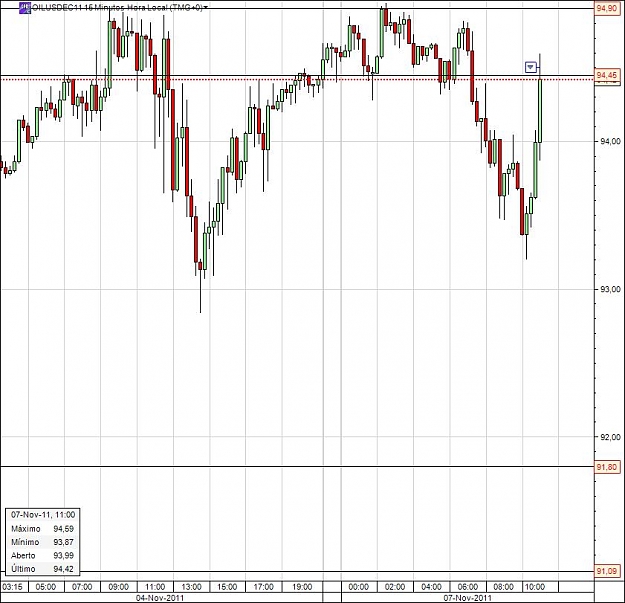
- branco replied Nov 7, 2011
I'm newcomer to this thread, hope I'm doing it right
Price is everything Shorted USCrude at 94.5: target @ 93 and 92 SL @ 95
- branco replied Nov 17, 2010
Hello, Been following this thread for a few days. What do you guys think of a short in USDCHF?
Trade What You See - Almost Naked Trading
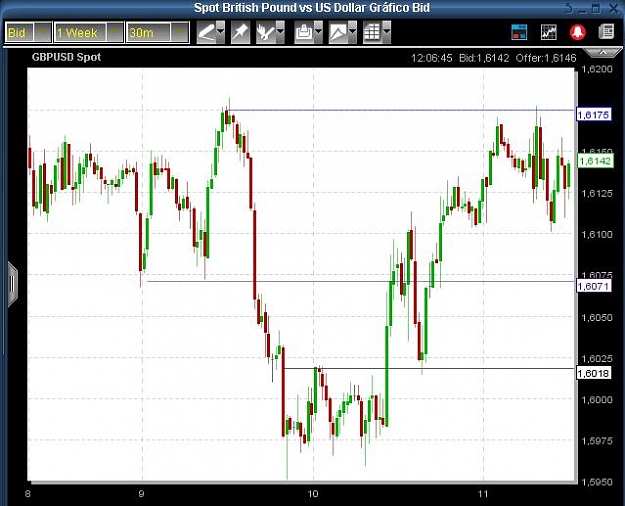
- branco replied Nov 11, 2010
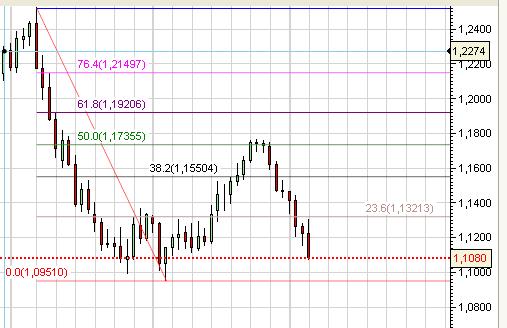
What do you think? — Hello everyone, Long time lurker, first time poster in this thread. Here is what I see: 1) The break of 1.6018 indicates a possible trend reversal (bullish) 2) Going above 1.6071 puts the price above the previous momentum ...
Cable Update (GBPUSD)
- branco replied Jul 28, 2008
What ranging?
GBP/JPY with Seaward22 218 seems like the top of the channel for now but I would not be surprised to see it closer to 220 where the next big resistance is. I'm riding this wave for over 3 months now and I probably my last buy in the recent dip to 208 and ...
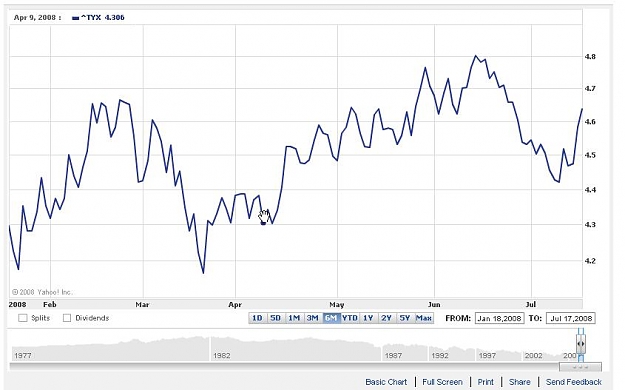
- branco replied Jul 18, 2008
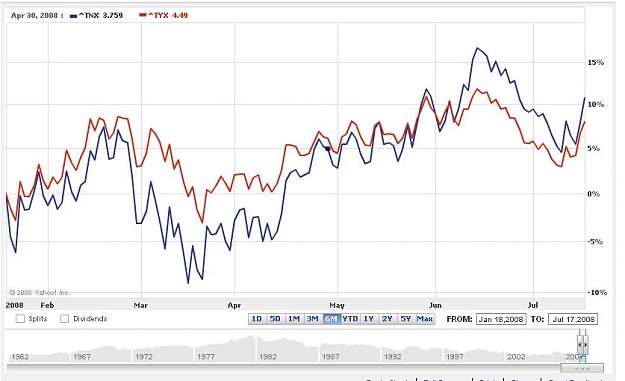
I did not find the chart for the shorter bonds so here I post the comparison between the 30 year note (red) and the 10 year note (blue). I think what you are seeing as "spread narrowing" is really the long term note heading down. Compare with the ...
USD/JPY Discussion
- branco replied Jul 18, 2008
To help you understand better I post here the graph of the 30 year treasury bond. Guess when was the bottom on that chart? Maybe around 17th March?
USD/JPY Discussion
- branco replied Feb 24, 2008
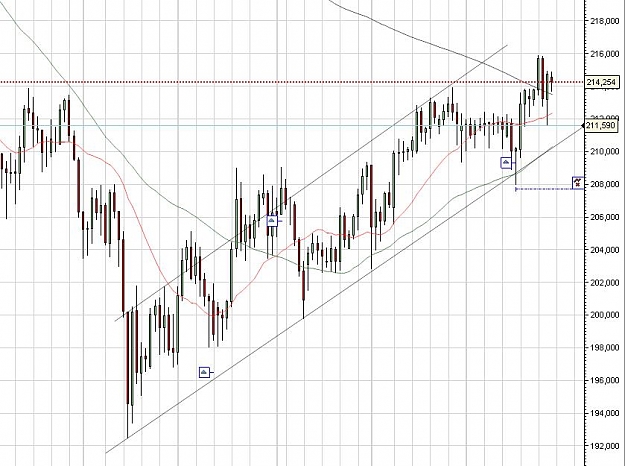
Hi guys, I know this is FX forum but I thought you guys would be interested since we spend all week making fun of the Dow
Cesarnc's market talk, gossips, rumours & fun If you see there is no interest in this let me know and i'll stop posting. But so far here is my reviewed analysis of the ...
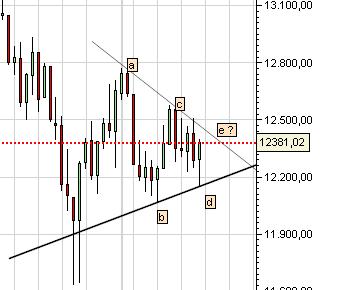
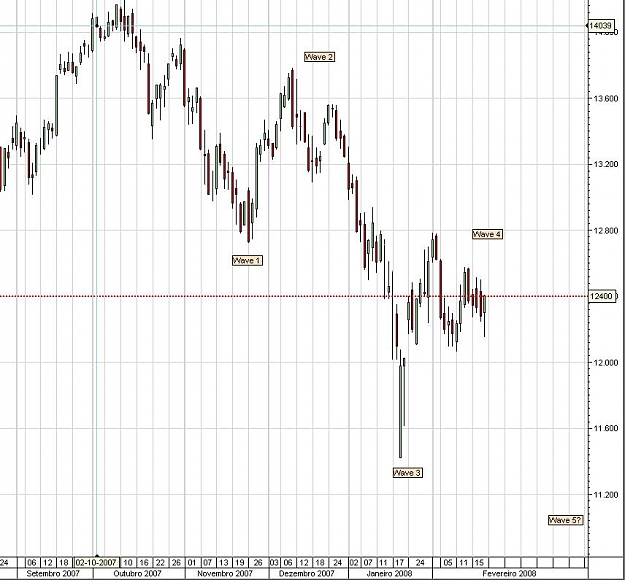
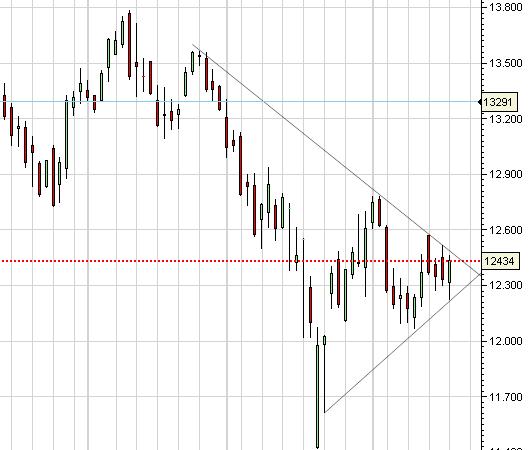
- branco replied Feb 21, 2008
I confess I'm expecting blood until the week is over... big blood bath! This is the daily chart for the Dow and I'm waiting to see that triangle broken down. Also my little knowledge of Elliot Waves tells me we're either in 5 of a bear market or in ...
Cesarnc's market talk, gossips, rumours & fun
- branco replied Jan 11, 2008
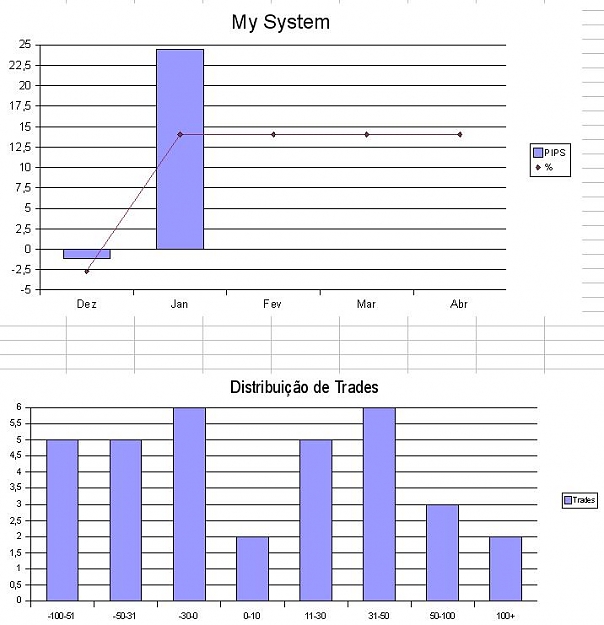
This week went better but still some things I don't like about my trading... lets see if it keeps improving...
Trades of newbie... we know how it started, where will it end? Need to trade less I think... #25 07-01-08 EUR/JPY CURTO 160,00 160,35 -35 #26 07-01-08 USD/JPY CURTO 109,07 109,64 -57 #27 08-01-08 ...
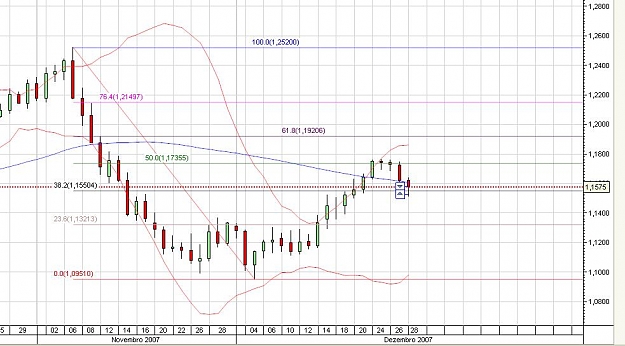
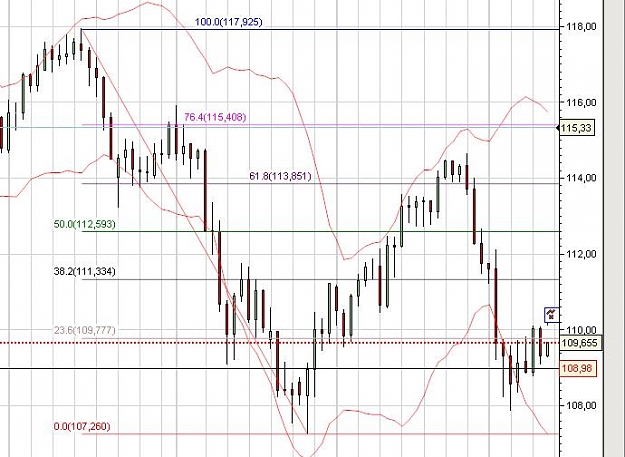
- branco replied Jan 10, 2008
Someone wants to comment on this daily USD/JPY chart? We're close to 23.6 fib retracement in my chart and in the previous days we've seen that level being rejected twice. Yesterday that level was broke but today we made a DBHLC. Should we consider a ...
Daily PIN Bars
- branco replied Jan 9, 2008
Actually I'm looking at the CFD, maybe the index itself doesn't do the pinbar. The CFD is traded since 9am to 9pm (GMT) so the pinbar might be because of the time before the market opens in the US. Picture below with fib levels.
Cesarnc's market talk, gossips, rumours & fun
- branco replied Jan 4, 2008
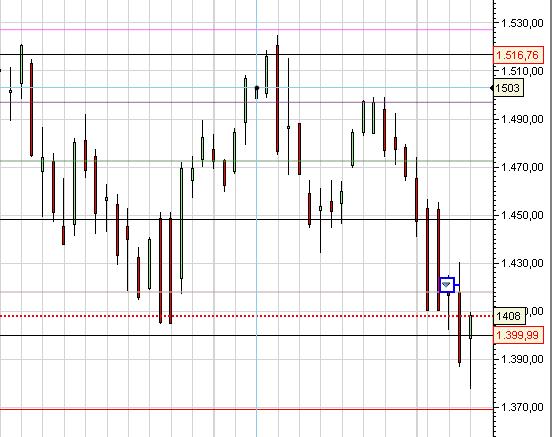
Well, CHF is also a "refuge" currency like JPY but it has bigger interest rate. Roll over on short positions (at my broker) isn't even 1 pip while I would pay 3 pips to short JPY. As for breaking... a picture is worth a thousand words (shame I ...
Cesarnc's market talk, gossips, rumours & fun
- branco replied Jan 3, 2008
My broker closes the daily chart at 20 GMT and the best looking PIN on that time is the EUR/JPY. I entered long at 161.31 due to the break of an intra-day PB. If you want to play safe you can play a break around 161.70
Daily PIN Bars
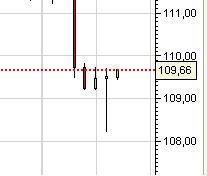
- branco replied Jan 3, 2008
Hi everyone. USD/JPY just made a big PB near a key support level (109) and now it is breaking the upside of the PB. This is 8H candles, daily will look similar (although day is not over yet).
Daily PIN Bars
- branco replied Dec 28, 2007
Hello again. I am a bit confused with this chart on CAD/CHF. Someone pointed in another thread that on the daily chart we made a Double Bar High with Lower Close. I took a look at it, seemed good, shorted it, nailed 50 pips and happy. 50 pips was ...
Daily PIN Bars