- Search Forex Factory
- 76 Results (3 Threads , 73 Replies )
-
 bobblong replied Jul 3, 2010
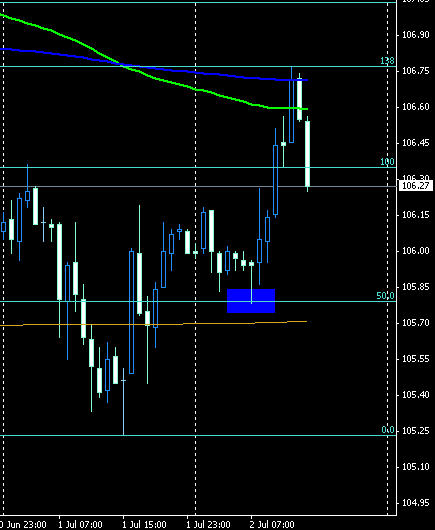
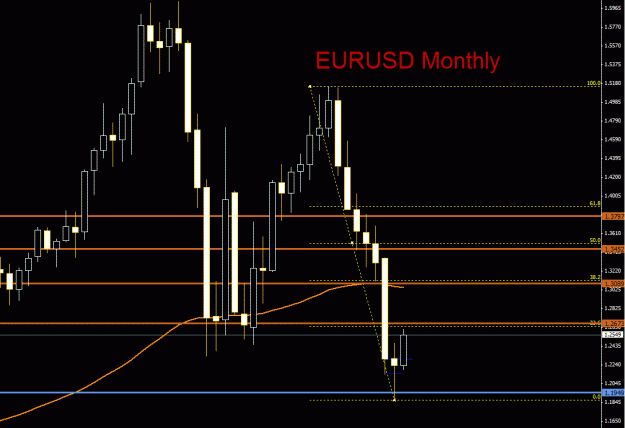
EUR Monthly Pin — Don't know if anybody's noticed but Euro monthly chart shows a pinbar. On july 1 price opened above the monthly pivot and shifted up quickly. Perhaps the tone is set for the 3rd quarter of the year and onwards? image image
james16 Chart Thread
- bobblong replied Oct 21, 2009
Greets to the very few who are following this thread
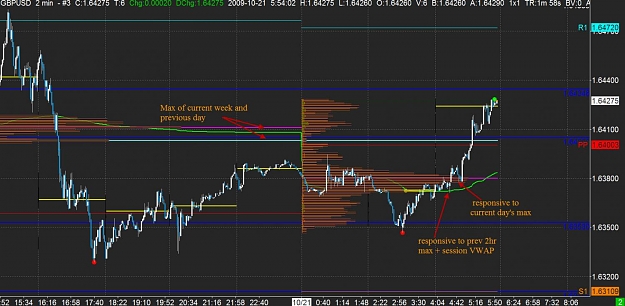
Principles of market movements Closed the GBP just after London. I am now waiting to find out if yesterday's action was just a shakeout before resumption. We'll find out soon enough. While I was ZzZ there was a bounce from ...
- bobblong replied Oct 20, 2009
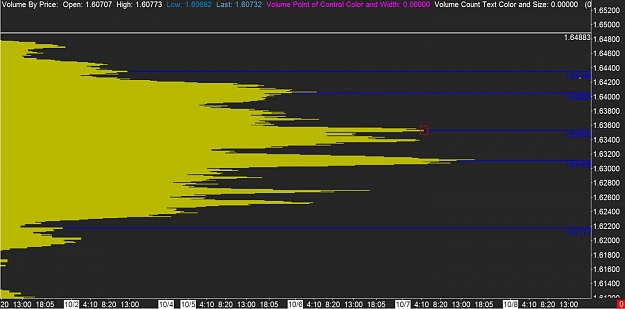
GBP Reached the max volume of the previous quarter @ 6488
Principles of market movements
- bobblong replied Oct 19, 2009
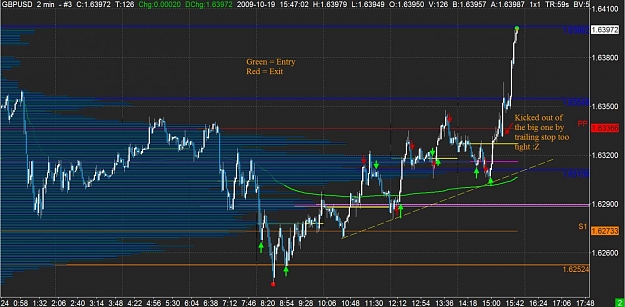
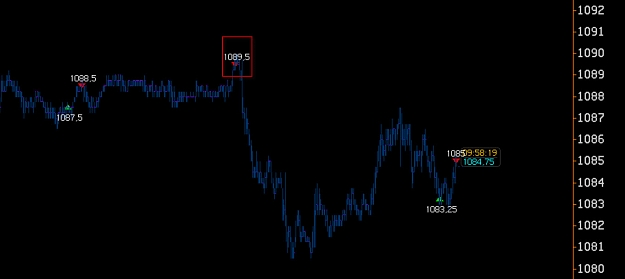
Well here is my activity for today. I am so pissed
Principles of market movements that I was kicked out of this cable rally prematurely. A couple of small negatives from early asia not shown in image. (Red and Green dots are just low and high of the day) PS Max volume ...
- bobblong replied Oct 15, 2009
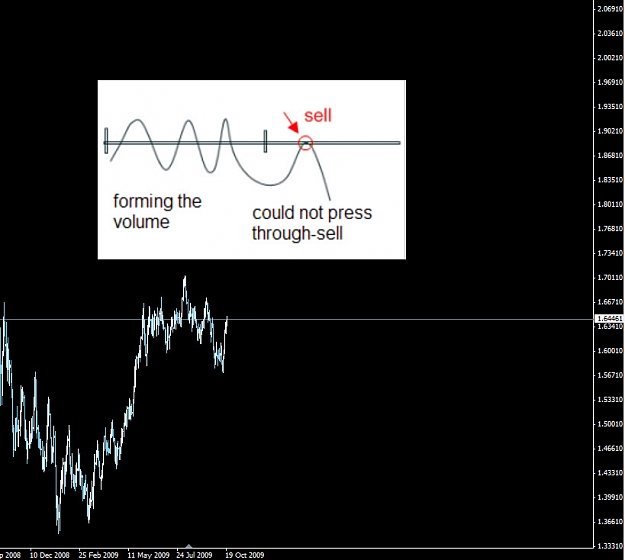
There is no benefit "seeing" it if it's not there yet, or even hinted. Saying that is like being awake in the middle of the night without knowing what time it is and saying "I see the sun rising, sooner or later!" It is inevitable, but it doesn't do ...
Next Crash on October 20, Tuesday?
- bobblong replied Oct 15, 2009
Ok, I will think some more about the short periods and how to use them
Principles of market movements . About the futures volume, I understand that might be better, but logic says that if the futures fx trading only accounts for 10% of all the volume in the fx market, ...
- bobblong replied Oct 15, 2009
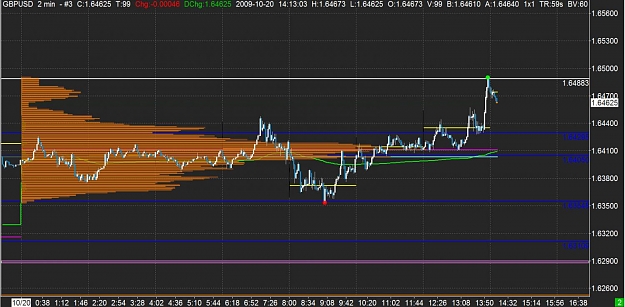
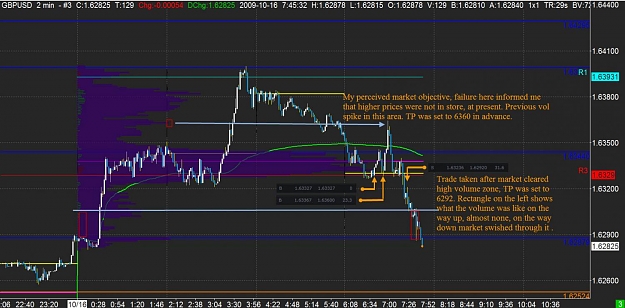
Here is GBP today after the big rally which started yesterday at the Max Quarterly Volume. The blue lines are also levels from the previous quarter's volume chart, and it still surprises me how accurate it is. The yellow is max 2hr volume. I find 1 ...
Principles of market movements
- bobblong replied Oct 15, 2009
Can you explain the rationale behind this trade/exit ? thx.
Principles of market movements
- bobblong replied Oct 13, 2009
Update
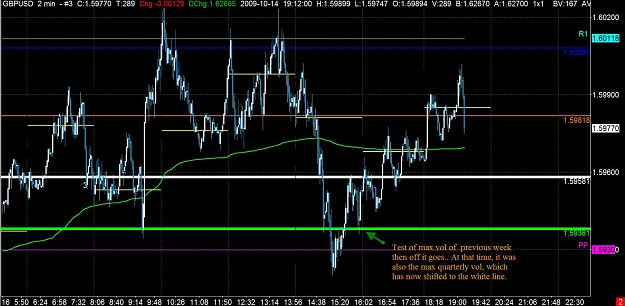
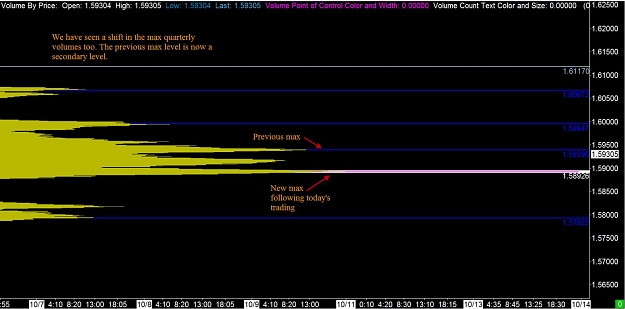
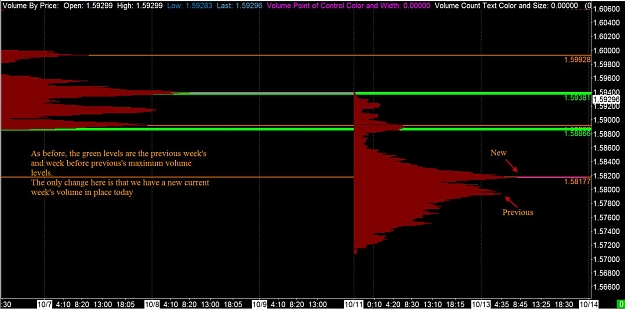
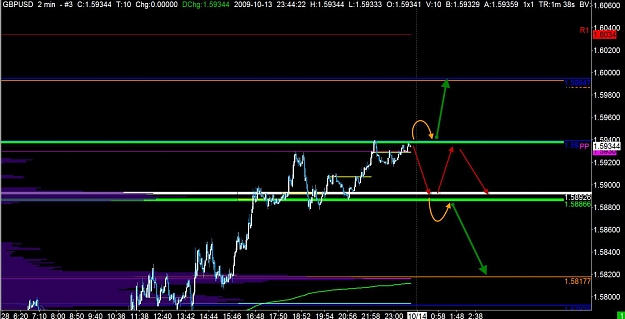
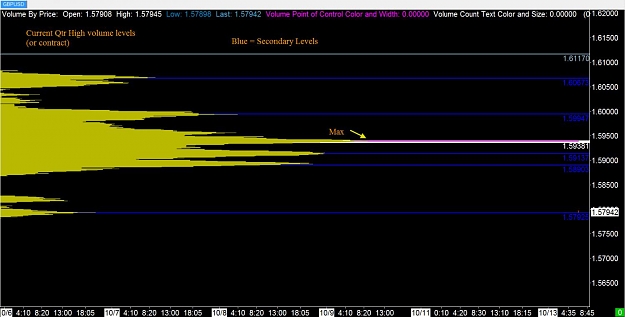
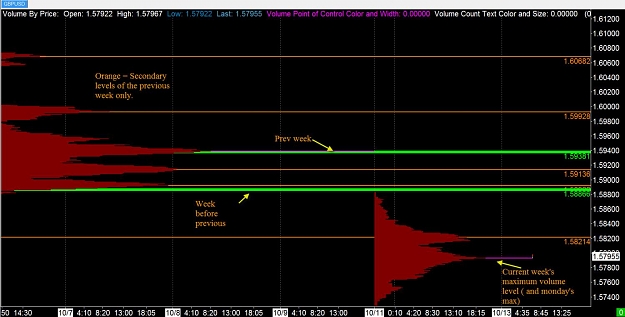
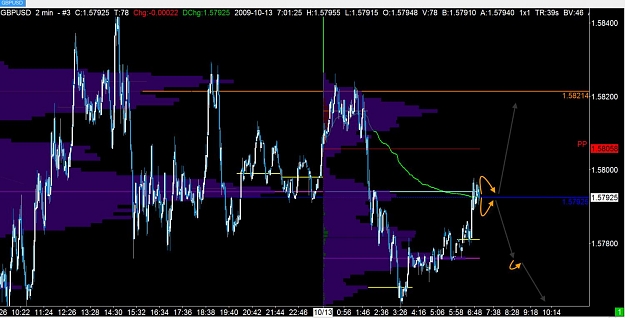
Principles of market movements — This was an interesting day for the pound, if I may say. Here below are the volume charts showing how things shifted. So we are now in a corridor between 1.5938(prev week max) and the new quarterly max which corresponds to the week ...
- bobblong replied Oct 13, 2009
Hi Aleksey, I've enjoyed reading this thread, please do continue. Here is what I have for the spot market. The volume comes from FXCM's feed which is fed from a collection of their liquidity providers. So far, it seems very accurate. So the images ...
Principles of market movements
- bobblong replied Oct 4, 2009
Yes exactly. Thanks all for taking a jab at this. There were no right answers. As I said before there is a catch and if you look below you can see what the timeframe is on this chart. The chart is actually two timeframes pasted together in a random ...
Name the Timeframe
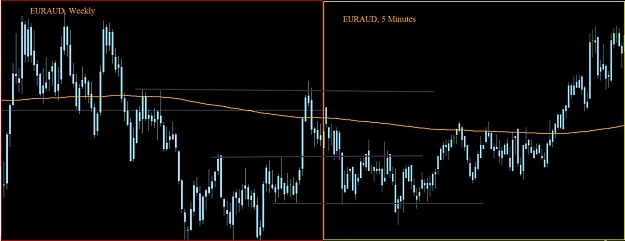
- bobblong replied Oct 1, 2009
EurAud — Excellent spot to get trading this pair, imho. BUOB.
james16 Chart Thread
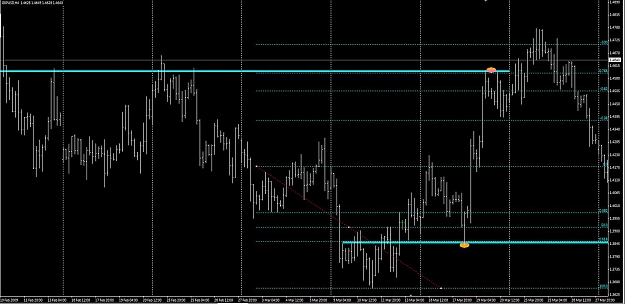
- bobblong replied Apr 10, 2009
The high and the low of the previous week/month/day are common points of s/r obviously but the retraces and extensions of the above are good points of confluence.
james16 Chart Thread
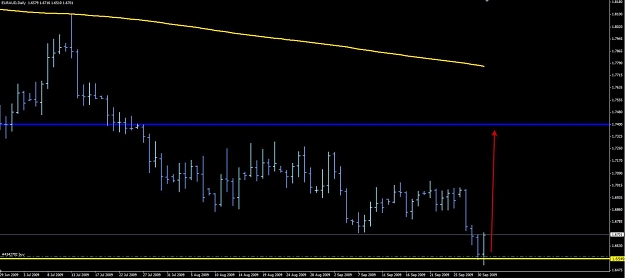
- bobblong replied Aug 6, 2008
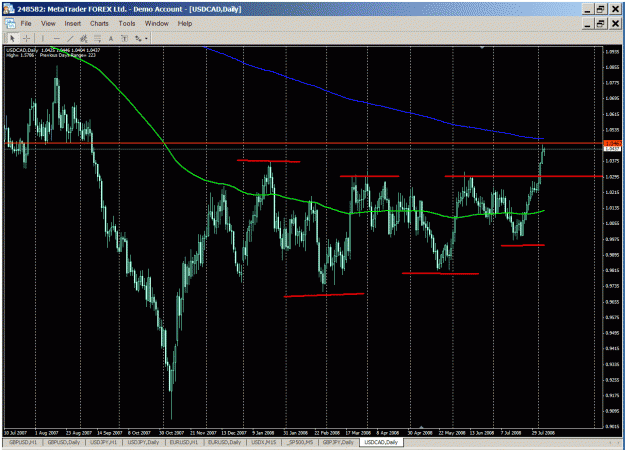
Clouds, why such a debilitating bias? You're only seeing what you want to see, respectfully. Here's what is actually happening.
USDCAD trend reversal?
- bobblong replied Aug 4, 2008
I saw this new indicator recently on another website, perhaps it would be useful for you
Can anyone recommend a good daily indicator
- bobblong replied Jul 28, 2008
I think the best use for Stochastics is as Stoch. Compost. Just dump it in a bin like this one and in about 2 weeks you will have compost ready to use for your garden. Now tell me, what does stochastics show that is invisible to the naked eye?
Best use of Stochastics please

- bobblong replied Jul 2, 2008
It is quite simple in concept. Some people apply a measurement to legs of price movement, regardless of time. I apply it to fixed intervals such as 1 day, week, month etc. The "theory" is that a bounce of unknown extent is likely here. Why? I don't ...
basis for 50% retraction rule