- Search Forex Factory
- 17 Results
-
 acetrader replied Dec 19, 2023
Hi Parisboy, Here is a chart with the 200 EMA containing 4 levels ABOVE & BELOW the Centered 200 EMA. In addition to the 200 EMA with the varying levels the chart also contains a 20 EMA FLD. Now you say how do I trade using this. Actually, I don't ...
Analysis and Trading based on Envelopes, Waves, Cycles

- acetrader replied Feb 22, 2023
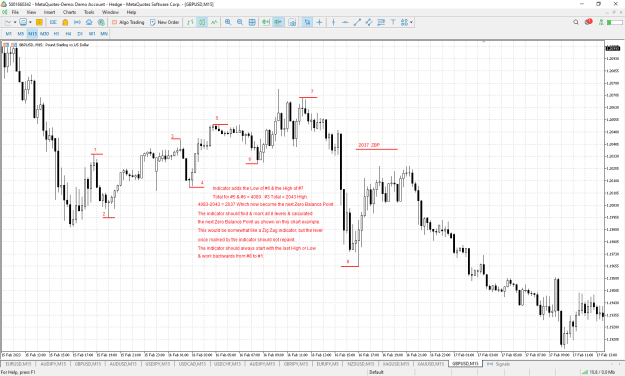
Hi hdn, Thank you for your willingness to help with this indicator. the indicator will find the last High or Low level & mark that candle with the #8, then the indicator will go backwards on the chart looking for the next candle after the #8. If #8 ...
I will code your EAs and Indicators for no charge
- acetrader replied Apr 23, 2022
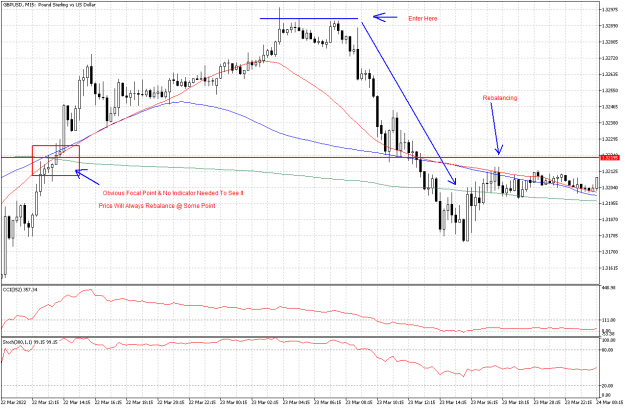
Here is a chart. Take a look at this chart, then observe other charts of your choosing & try to locate what you see here. A warning......this is NOT 100% a nothing is in this business, but with enough chart time you will get the hang of it. If you ...
Analysis and Trading based on Envelopes, Waves, Cycles
- acetrader replied Apr 13, 2022
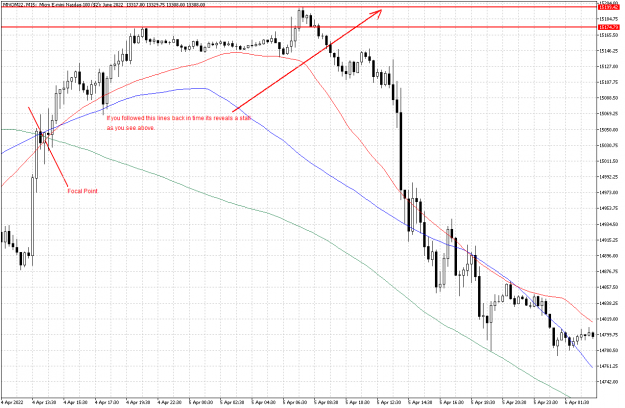
Hi parisboy, Hope all is well for you. Want to share a chart for your comments, advise & review. As I have stated many times, I trade a totally different way from what is shared on your great thread, but I do use the focal points as a great ...
Analysis and Trading based on Envelopes, Waves, Cycles
- acetrader replied May 24, 2021
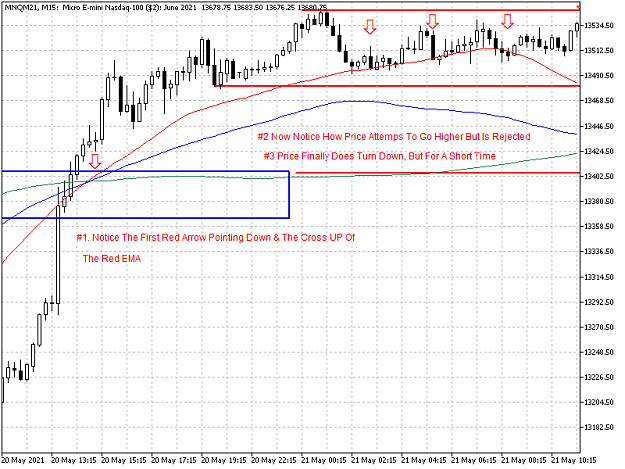
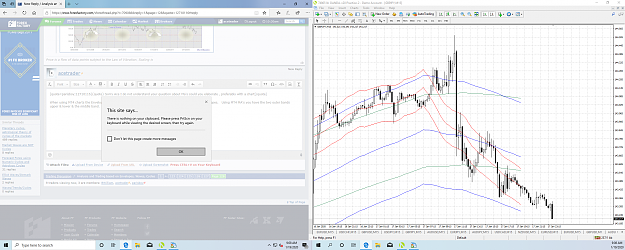
image Here Is a chart example. From what I see when the 49 EMA Red crosses ABOVE EMA 199 & 99 its just a matter of time before Price will turn DOWN. These moves will only last for a short time sometime & sometimes the move will go on for many ...
Analysis and Trading based on Envelopes, Waves, Cycles
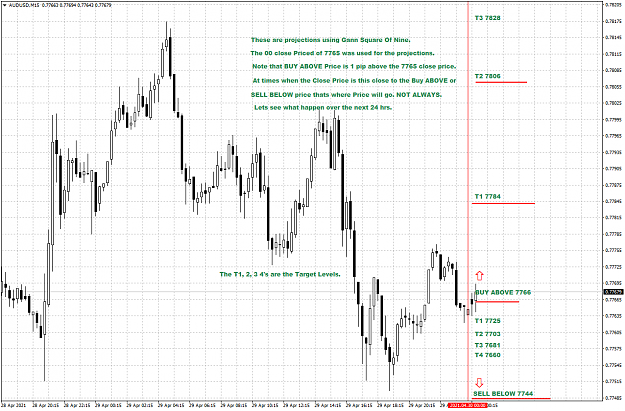
- acetrader replied Apr 29, 2021
Parisboy & All Others This is a another Gann Square of Nine projections...if it loads. The chart along with the comments should explain all. From reading on how to use the Square of Nine from sites that post their Square of Nine calculators the ...
Analysis and Trading based on Envelopes, Waves, Cycles
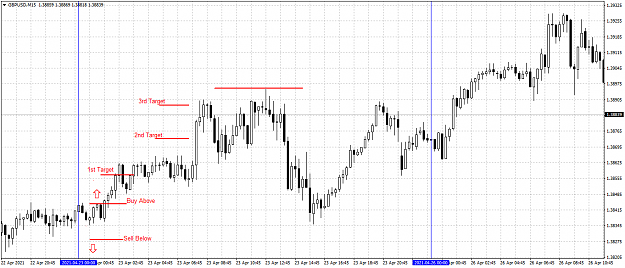
- acetrader replied Apr 26, 2021
Parisboy & Others Interested In The Square of Nine This what I've put together from memory so far using an excel version of the Gann Square of Nine. These levels are the projections from the Square. Closed or the current price can be used, but I ...
Analysis and Trading based on Envelopes, Waves, Cycles
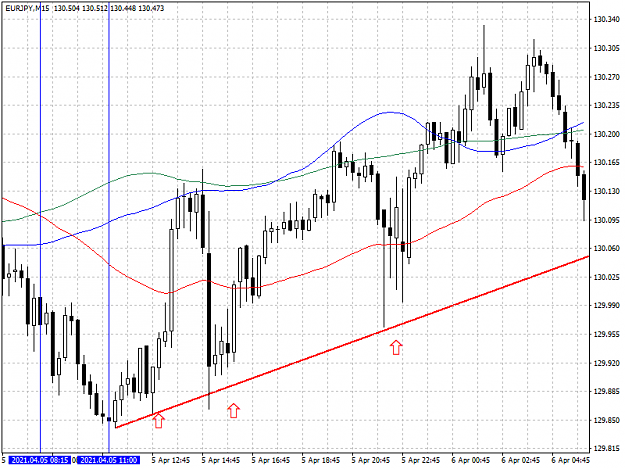
- acetrader replied Apr 11, 2021
image Another chart same pair. Last trading day. Does this work every time? NO. Roughly a 90 pip move before showing signs of turning. Hurst was no doubt far ahead of most others in his day. I traded DMA's long ago, but for some reason moved on to ...
Analysis and Trading based on Envelopes, Waves, Cycles
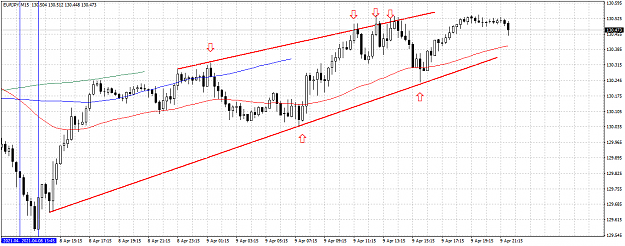
- acetrader replied Apr 11, 2021
Parisboy & Everyone, Going to attempt to post a chart of Displaced MA's which I believe is part of Hurst methods. Discovered this long ago, but found it while flipping through old trading notes. Setups …EMA 199 Shift -99, Green, EMA 99 Shift -59 ...
Analysis and Trading based on Envelopes, Waves, Cycles
- acetrader replied Sep 30, 2020
Here is what I see with method from SilentFather. I enjoy his thoughts & ideas. Thought provoking. A level that is passed can be passed again, but not always in the near future. Views a comments welcome & I will then share the indicator used. Thank ...
The riddle... If You solve this, we will be rich
- acetrader replied Aug 11, 2020
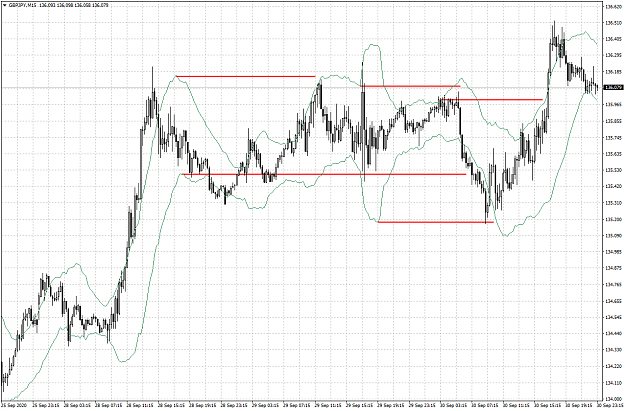
image Parisboy, Dave & Others, Your views on this chart please. It is amazing to me how well the envelopes show you what is happening or about to possibly happen. With everyday that I use the envelopes I am starting to realize their value in ...
Analysis and Trading based on Envelopes, Waves, Cycles
- acetrader replied Aug 4, 2020
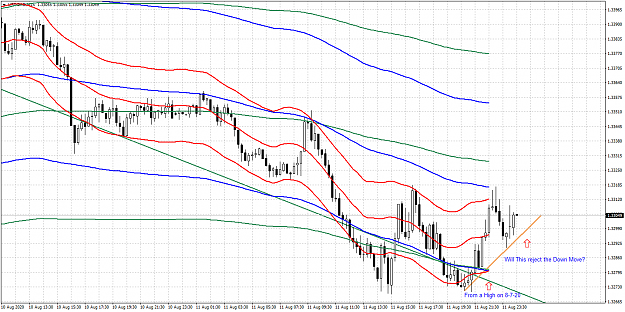
Parisboy & Dave, Your views on this chart if it loads. This is with the Envelopes. Did quick short & out on this one. Shorted when the 256, 128 & 32 lower bands connected. All views, comments & schooling much appreciated.
Analysis and Trading based on Envelopes, Waves, Cycles
- acetrader replied Jul 23, 2020
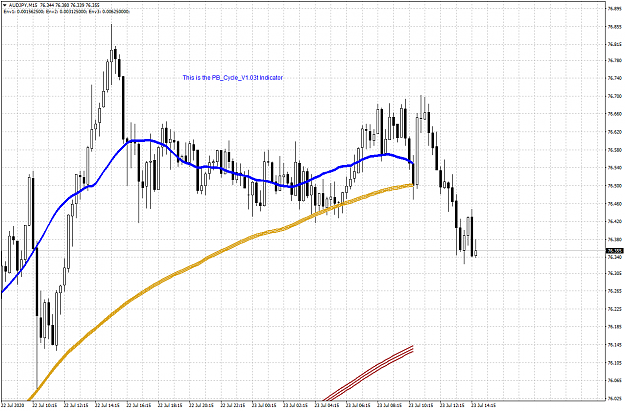
Hi Sohocool, Here is the chart with image PB Cycle_V1.03t. On other pairs the lines all expand & turn into envelopes.
Analysis and Trading based on Envelopes, Waves, Cycles
- acetrader replied Mar 24, 2020
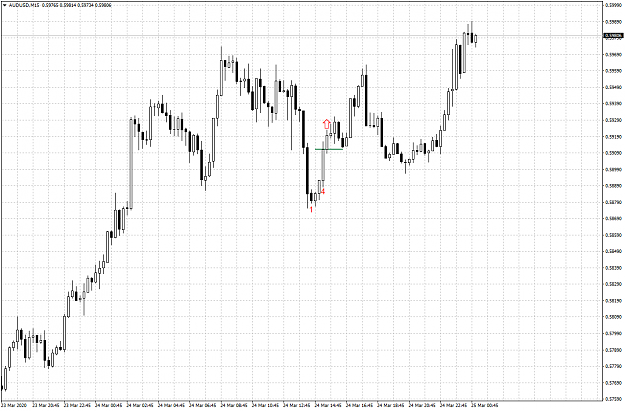
Took this trade earlier today. Just returned & found my limit hit & out with a few pips. These are everywhere, but it a matter of which ones will work. I traded this one from the 15M only. Typically use the 5M & 15M.
3 Bar Fractal Break
- acetrader replied Mar 18, 2020
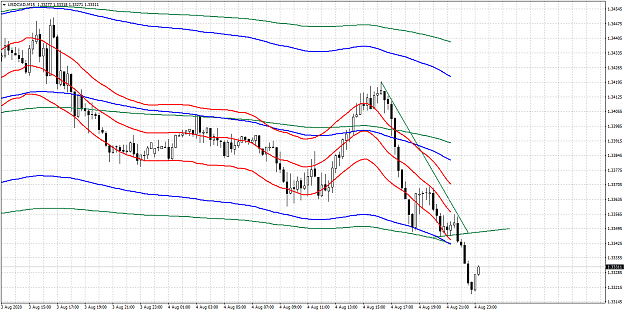
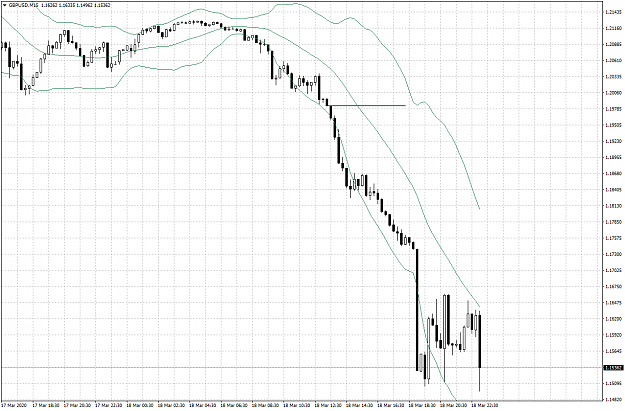
Dazjw2311, Here is the GBP/USD 15M time frame with one short trade marked on the 5th candle closing lower than the 4th one. There is another short trade at the top on the chart just before the area where the bands squeeze together. Not sure if this ...
3 Bar Fractal Break
- acetrader replied Jan 19, 2020
Parisboy try this one. Frst attempt to send a chart failed.
Analysis and Trading based on Envelopes, Waves, Cycles
- acetrader replied Jan 24, 2017
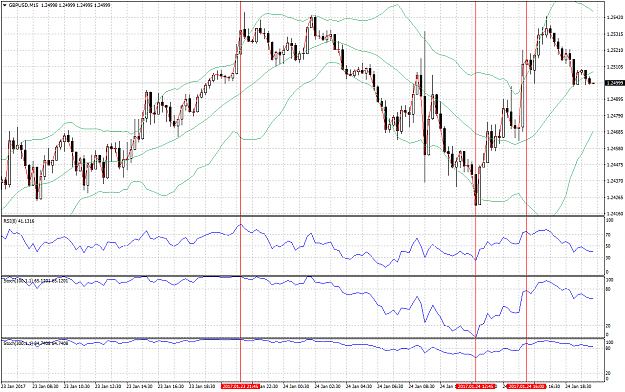
Take a look at this chart if it uploads. Notice the first signal from the left side of chart price took off immediately. The second took off off immediately & the third signal price was slow to turn. Now on each of these signals notice where ...
Similarity Present Day
- Posts by Member Search: 'acetrader'