- Search Forex Factory
- 343 Results
-
 Wab replied Mar 27, 2021
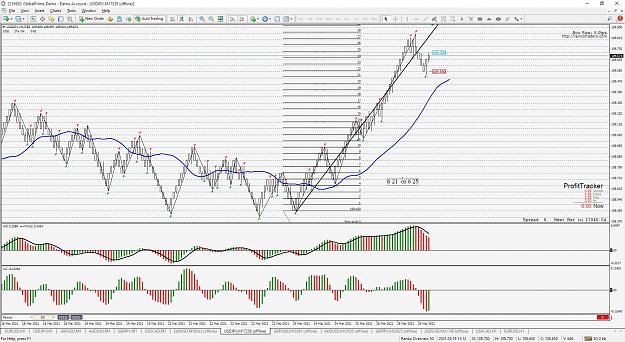
Here is a 100 point GBPJPY chart with 1000 point Tipu Renko superimposed on it, to aid in counting the 100 pip bricks. The trade is entered on the 100 point Renko SETUP E line. The P U (or first E S trade) only has two bricks for brick stacking. The ...
Renkology
- Wab replied Mar 27, 2021
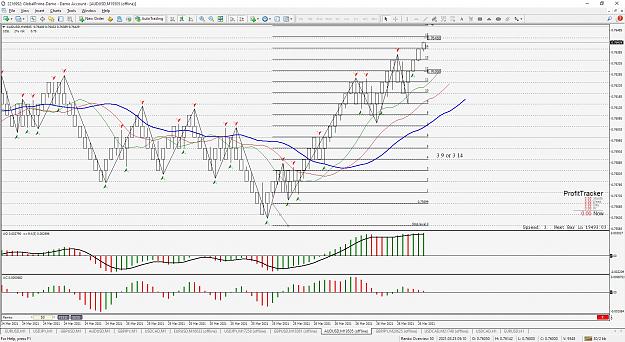
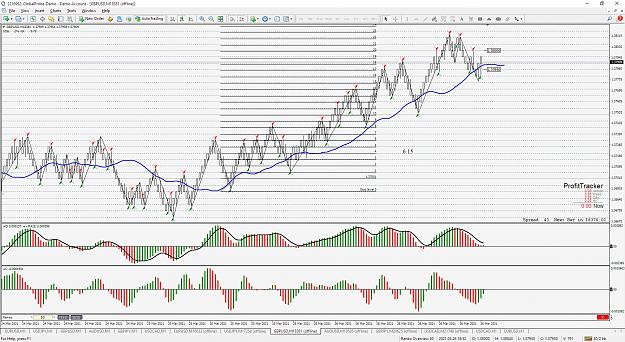
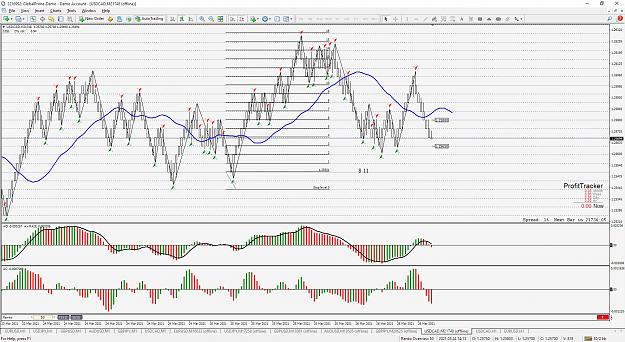
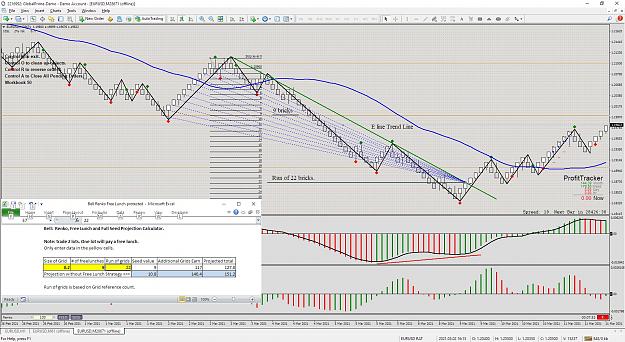
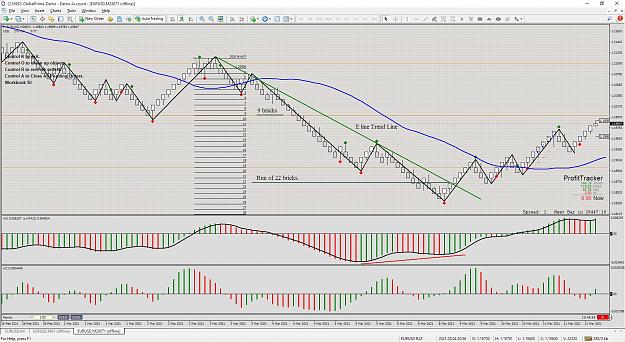
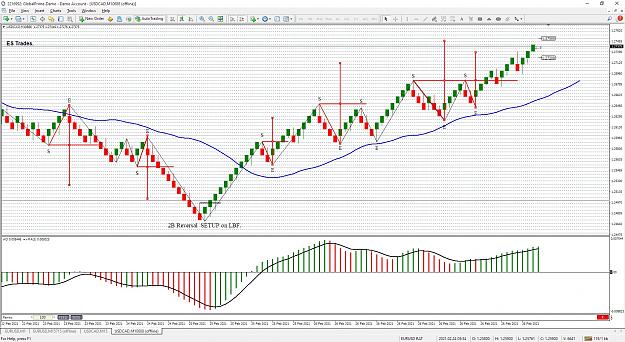
Here are some charts with the Fib ladder in place on E S trades. Some of them are still in play and you can either calculate the potential profits using the potential E line as a stop or the E trend line break, if it has happened. Of course you will ...
Renkology
- Wab replied Mar 17, 2021
Here is a Ger30 chart, showing 10 pip bricks with a 100 pip brick overlay from Tipu. The overlay helps with counting the 10 pip bricks. Using our SETUP and E line we have some nice entries on the 2nd pass past E and the U breakout. Look at the ...
Renkology
- Wab replied Mar 11, 2021
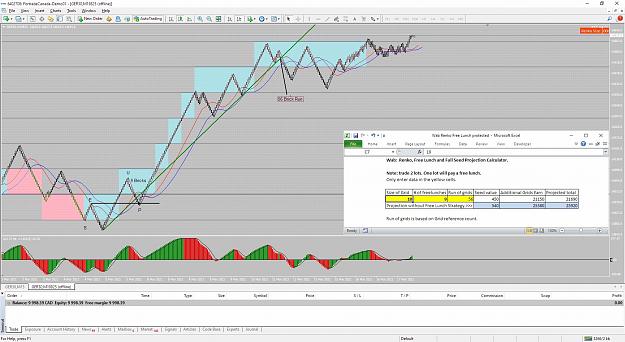
Brick Run Strategy: (Warning. not for the faint of heart.) How do we load up an E S leg for the best results? I have two ideas on that. (You may follow this with relish, or you may hate it. If you can manage it, don't skip to the end. You could ...
Renkology
- Wab replied Mar 11, 2021
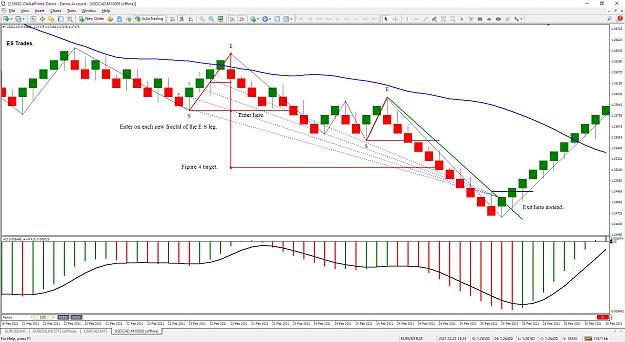
Using the previous chart I have drawn in all the trades that were available from the E S leg. In reality they would have been entered on the bricks to the right instead of from the E S bricks as shown, but I want to get across the idea of where the ...
Renkology

- Wab replied Mar 11, 2021
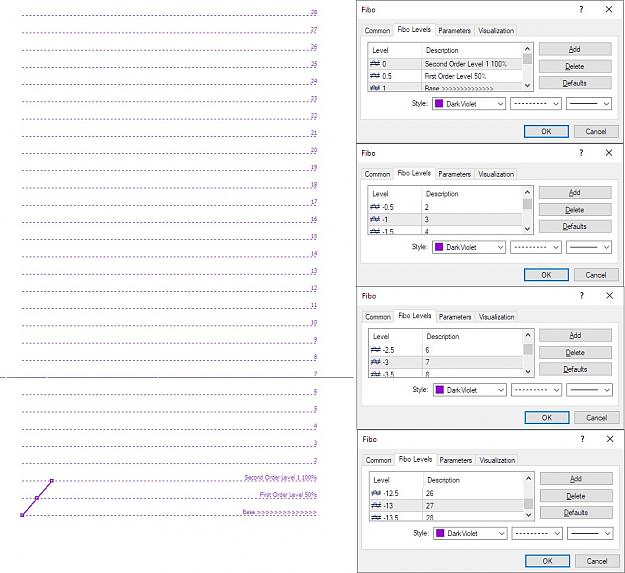
Once you have your Fib Retracement Tool programmed, you can place it on any chart and start looking for places where the E S structure was begging to be traded. You should be able to pick those out quite easily by now, if you have patiently worked ...
Renkology
- Wab replied Mar 11, 2021
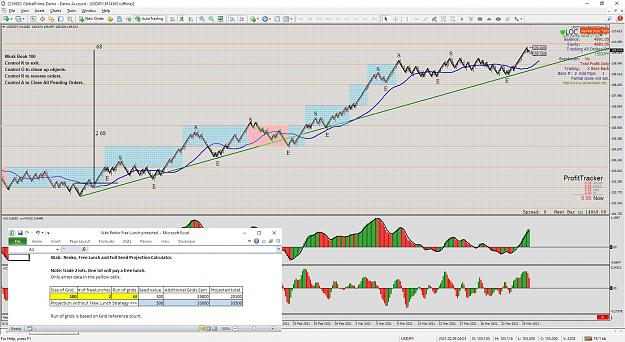
We need some tools to help us with this new approach to multiple brick trades. I am going to introduce what I believe is a unique use of the Fibonacci Retracement Tool. That will be followed up by a calculator that will assist us in thinking about ...
Renkology
- Wab replied Mar 11, 2021
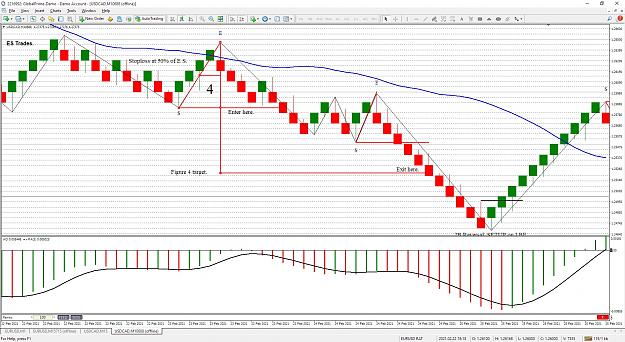
Now, let's take our current knowledge of the green wick trend line along the Renko Wicks and get a bit more aggressive. We can still take the Fig 4 entry at the fractal breakout but instead of taking a conservative profit at the 1:1 level, we can ...
Renkology
- Wab replied Mar 11, 2021
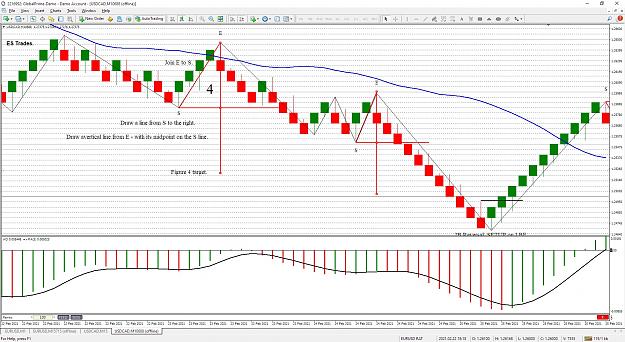
The simplest target on a Fig 4 trade is determined by the vertical line. Basically, as price moves past the S point (fractal) we can reasonably expect it to move up the depth of the 4 pattern. If we place a stop at E, we can try for a 1:1 risk ...
Renkology
- Wab replied Mar 11, 2021
In Animal Farm, I talked about a trade that I called a Figure Four Trade. You can review those trades there for additional thoughts on the topic. Basically a Fig 4 trade is a trade on a fractal breakout. We follow our S E labels, and look for an ebb ...
Renkology
- Wab replied Mar 11, 2021
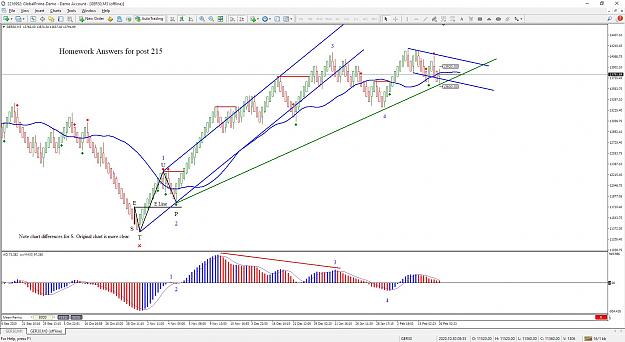
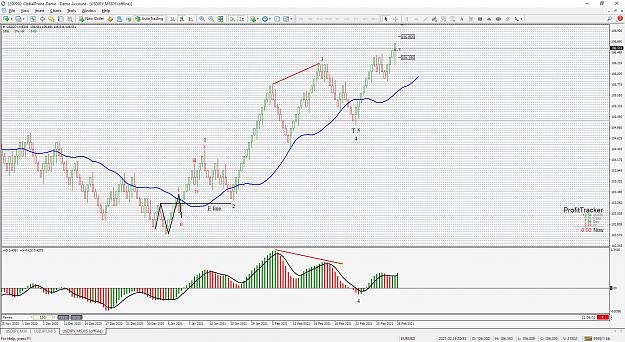
Here are the homework answers: image Been a very busy week for me. Looking at your chart Go5 I think you have a good grasp on it, just don't get too hung up on the Elliott Wave stuff. Main thing there is to be aware of the momentum in the AO and ...
Renkology
- Wab replied Feb 26, 2021
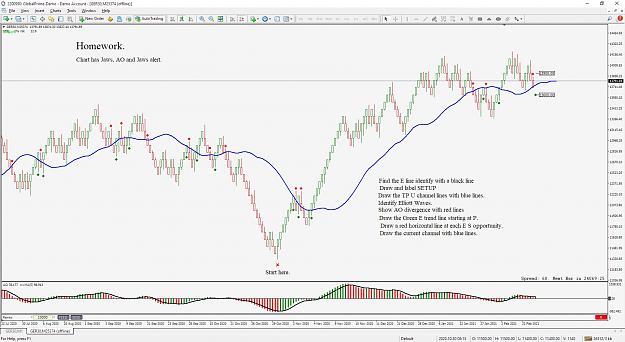
Here is your homework. You can print out the Ger30 chart or if you are in sync do the work on your current chart. Let's see how you do. Perhaps we should do one or two of these a week? Let me know your thoughts. image
Renkology
- Wab replied Feb 26, 2021
Lets wrap this part up now with a final zoom out to a higher brick frame. At a glance, you can find the SETUP and identify the larger EW structure, some pretty big waves. image You can even identify waves within waves (example inside wave 1) or ...
Renkology
- Wab replied Feb 26, 2021
Here is our offline Renko Chart starting at the same T5 . I added the current T PU Channel. image
Renkology
- Wab replied Feb 26, 2021
Here is the same chart with the Tipu Renko on it. Note that you gain some information from the wide bricks, where time passes slowly. image The price bar data is also a great help if you are good at analyzing it. The detail of the price bar dat a ...
Renkology
- Wab replied Feb 26, 2021
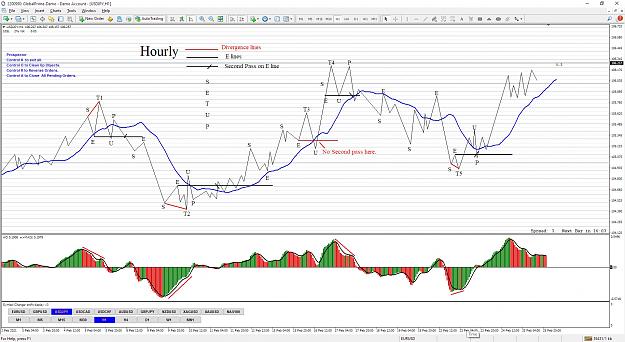
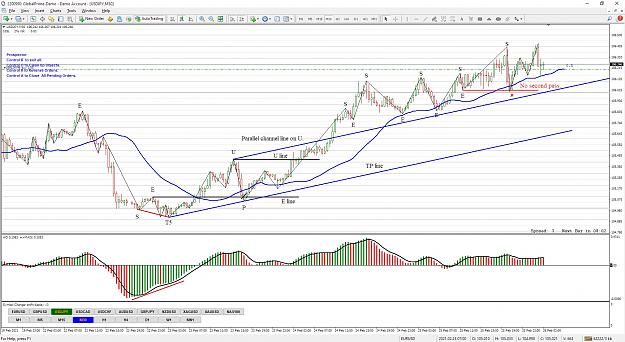
Thank you. The second pass rule saves our bacon again. The M5 E line was broken on a second pass but we need to remember what time fame we are trading in, in this case H1 with M30 help. If we get too far down into the structure we can get caught up ...
Renkology
- Wab replied Feb 25, 2021
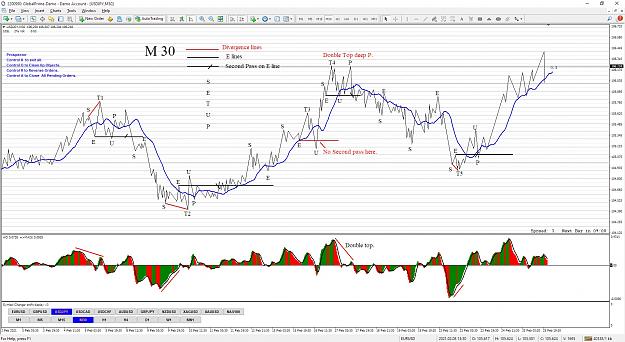
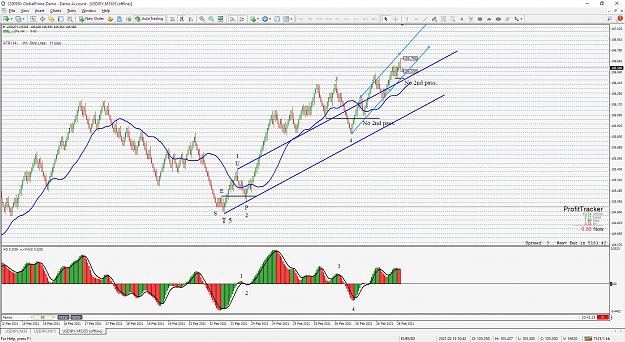
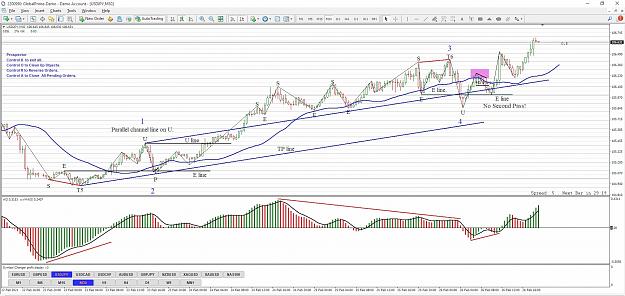
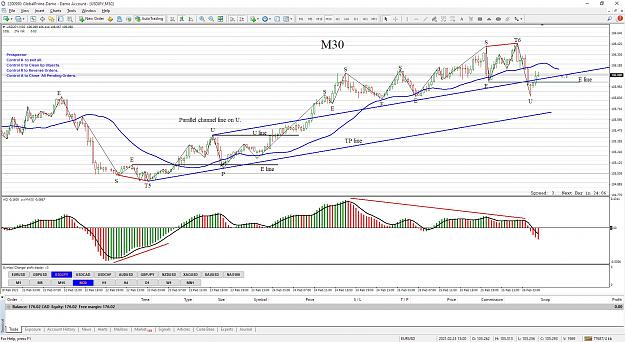
Back to M30. Price has broken out of the TP U channel. We have an E line (waiting on the second pass) and a dip below the Jaws line. Also note that the AO has dipped below zero after a big divergence. Lots happening. If you have the Jaws alert on ...
Renkology
- Wab replied Feb 25, 2021
TP U channel. SETUP, E line and Jaws all busy at the same time. If you have the Jaws alert on your charts or Trend line break, you can see (actually hear) when it is time to pay attention to those lines. image So, next? We wait for a second pass ...
Renkology
- Wab replied Feb 25, 2021
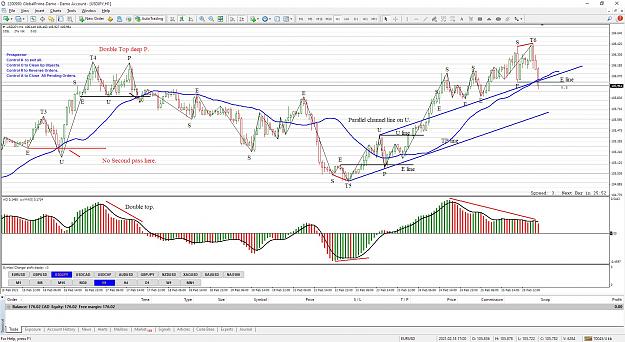
Carrying on with our chart as it evolves: Here is the M30 view, another failed SETUP and we are again saved from losses with the second pass rule. Drilling down to M15 reveals why, but I will let you do that. You need to get into the habit of ...
Renkology
- Wab replied Feb 25, 2021
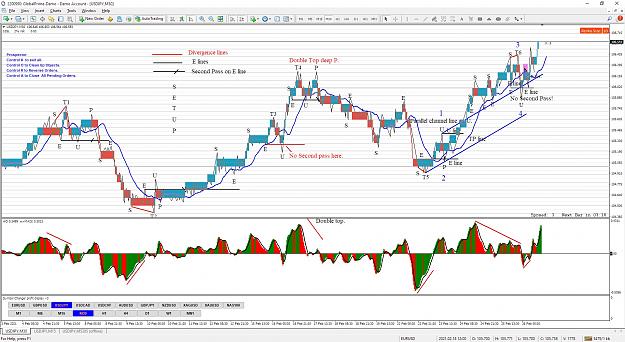
The chart is basically a slightly modified Prospector template. Price is made invisible and ZIGZAG FRACTALS are a proxy for S end E analysis. I placed a list of the letters for SETUP on the screen and I can select any one of those and use the ...
Renkology