- Search Forex Factory
- 24 Results
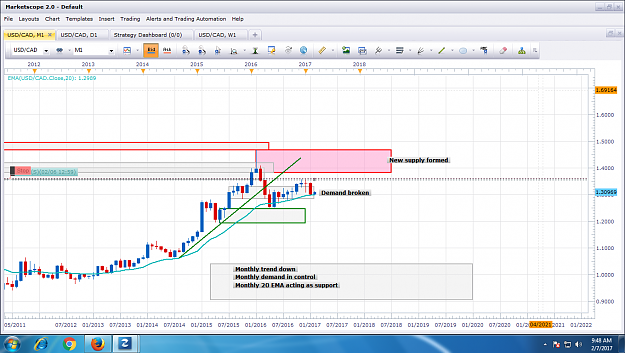
- Vsm replied Feb 6, 2017
Hi Alfonso & other senior members Attached please find USDCAD Monthly chart 20 EMA is working against short bias on Monthly chart. How to deal with this?
Supply and demand in a nutshell by Alfonso Moreno
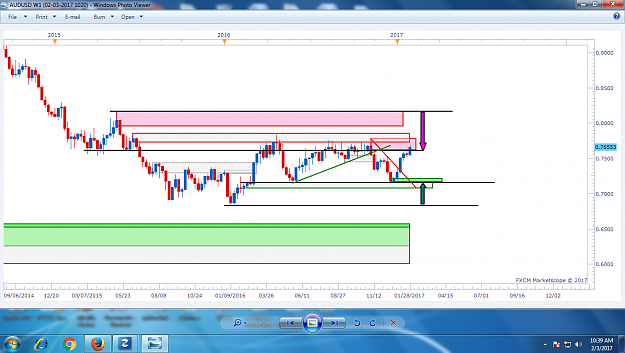
- Vsm replied Feb 3, 2017
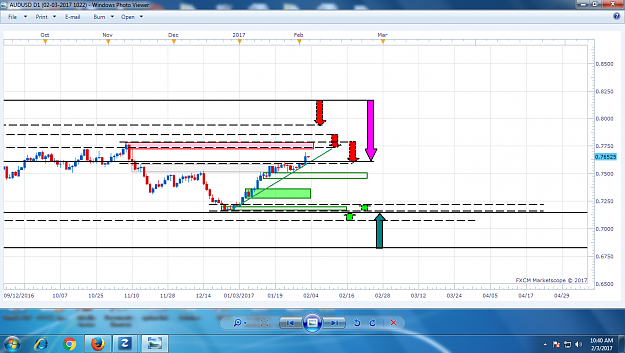
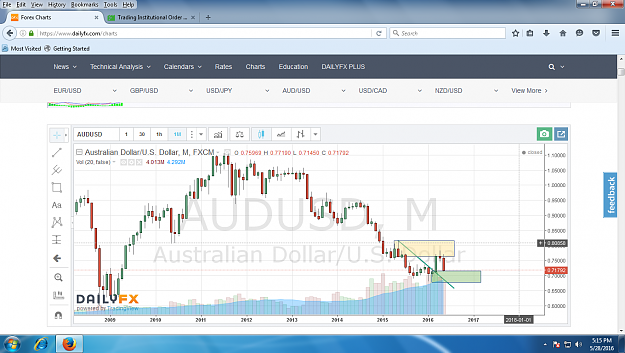
Analysis for AUD/USD Monthly 1) trend :- Bearish consolidation 2) Supply level not fresh, testing third time Weekly 1) trend :- Bearish consolidation 2) Price at Monthly high curve & fresh weekly supply. As monthly trend is in bearish consolidation ...
Supply and demand in a nutshell by Alfonso Moreno

- Vsm replied Aug 14, 2016
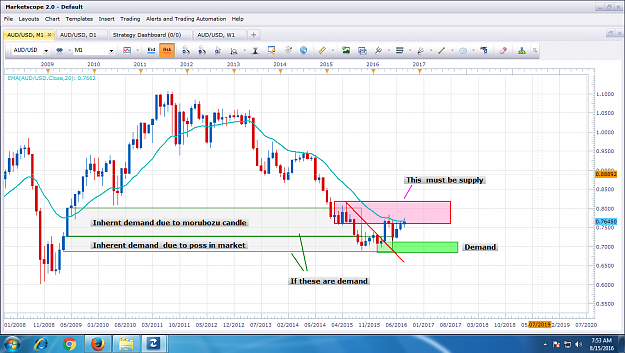
Hi, Referring to following Monthly AUD/USD chart Why we are not considering zones marked on left of current price as demand? 1) Lower zone:- although it is not a perfect 50% candle it is the poss in market as compared to succeeding & preceding ...
Supply and demand in a nutshell by Alfonso Moreno
- Vsm replied Jul 24, 2016
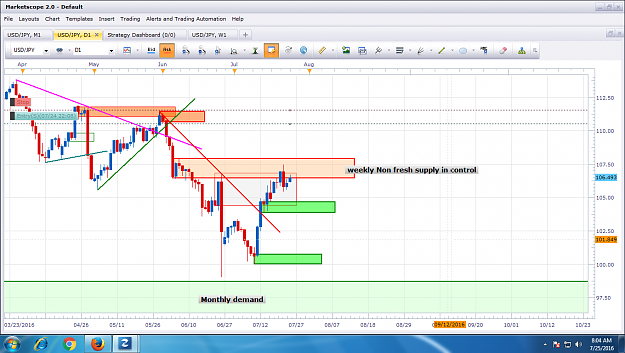
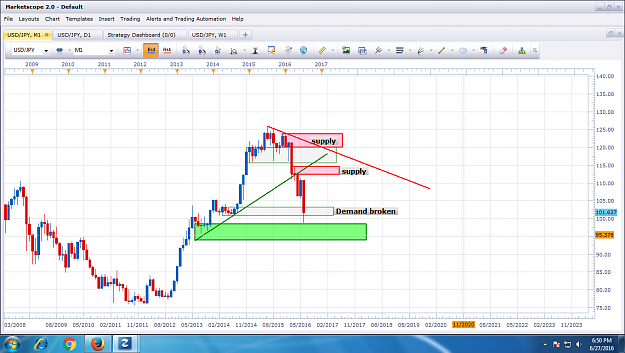
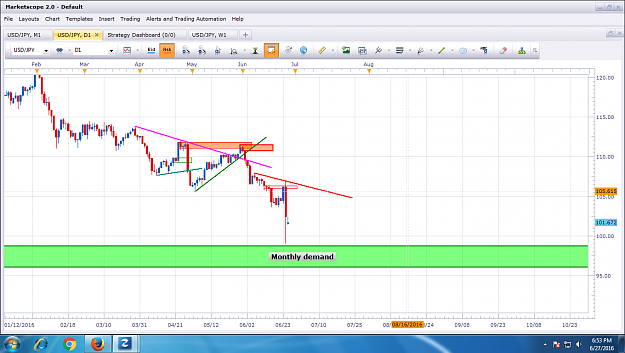
Can not short sell on H4 at current situation as daily time frame is not in our favor. Once daily demand at 104.7 is broken we can consider short sell on H4. ( No longs on daily as weekly non fresh supply is in control) We are in wait & watch ...
Supply and demand in a nutshell by Alfonso Moreno
- Vsm replied Jul 14, 2016
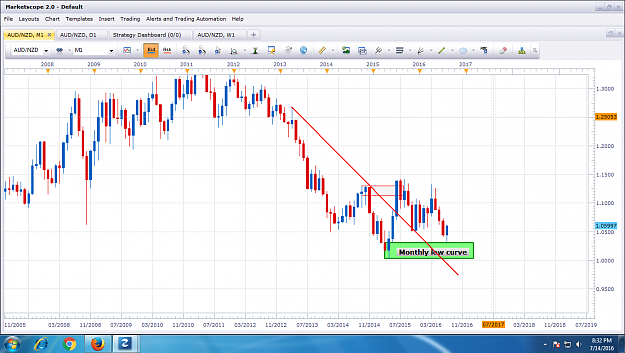
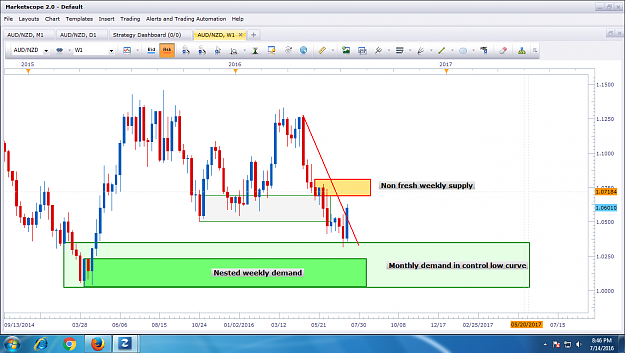
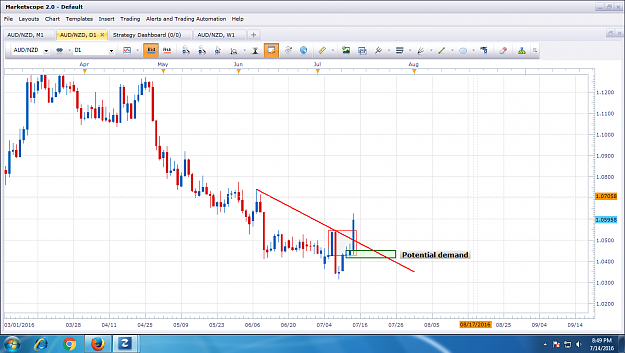
Monthly demand in control, low in curve no short sell allowed on daily, counter trend buy on daily new demand levels formed till weekly supply is reached
Supply and demand in a nutshell by Alfonso Moreno
- Vsm replied Jun 28, 2016
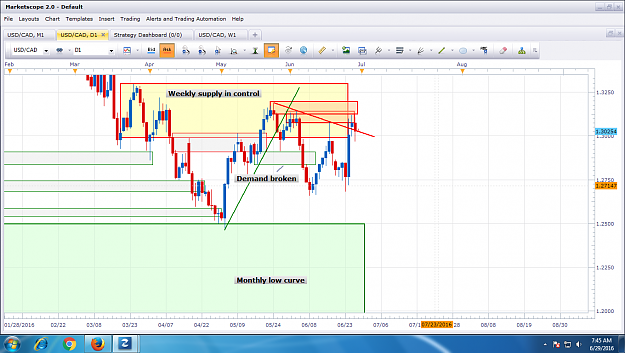
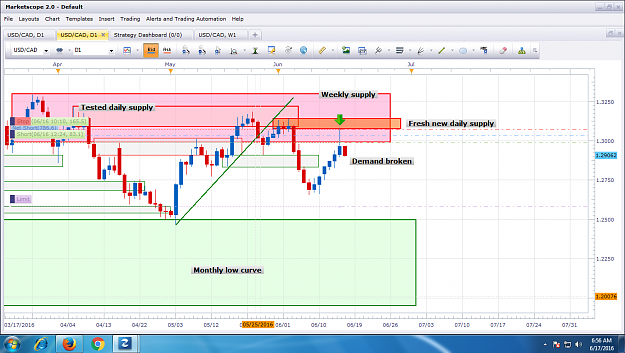
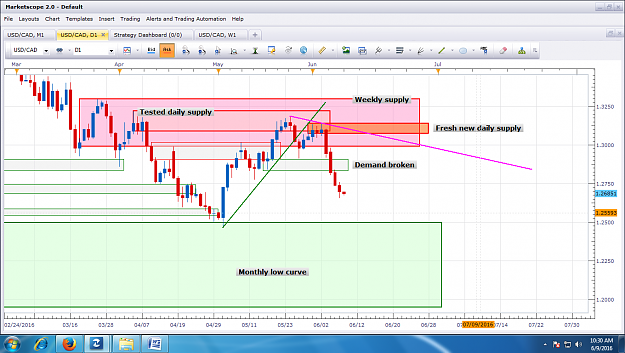
Hi AKT nicely spotted H6 set up at daily high curve. I would like to add a supply level to your daily chart at 1.3080
Trading Institutional Order Flow
- Vsm replied Jun 24, 2016
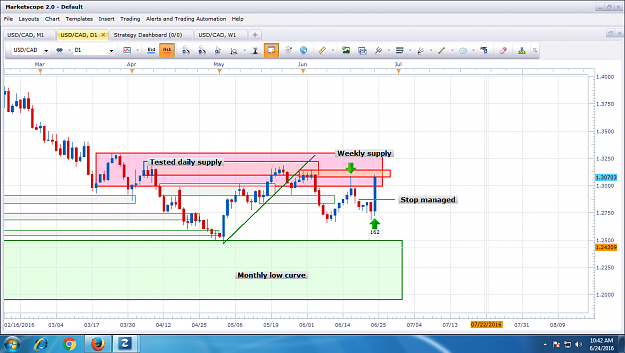
[quote=Vsm;8988172] Exited at managed stop [email protected]. Price could not reach my profit target of 1:5
Supply and demand in a nutshell by Alfonso Moreno
- Vsm replied Jun 16, 2016
USDCAD we discussed triggered
Supply and demand in a nutshell by Alfonso Moreno
- Vsm replied Jun 15, 2016
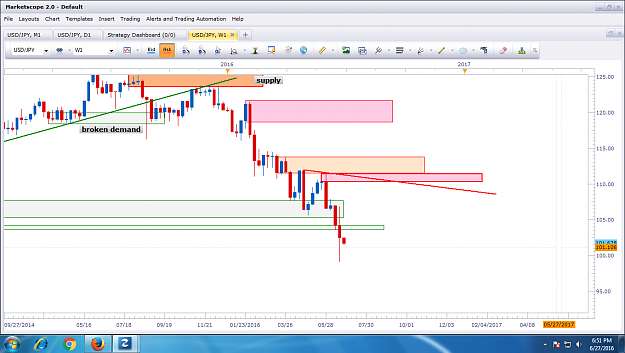
Monthly down. weekly down, daily down only short sell. Long position will be counter trend trading that will be possible Only when 1 )Once Price hit Monthly low curve at 101.00 look for confirmation type entry on daily ( Break of descending momentum ...
Supply and demand in a nutshell by Alfonso Moreno
- Vsm replied Jun 15, 2016
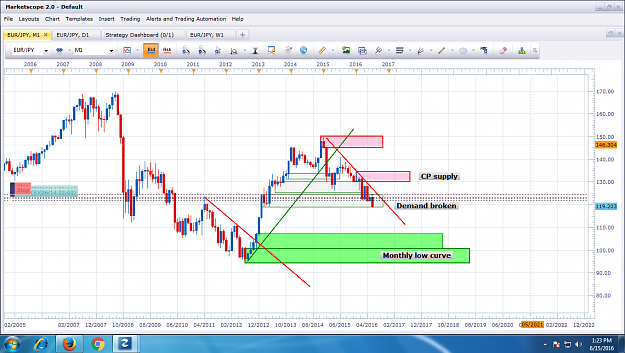
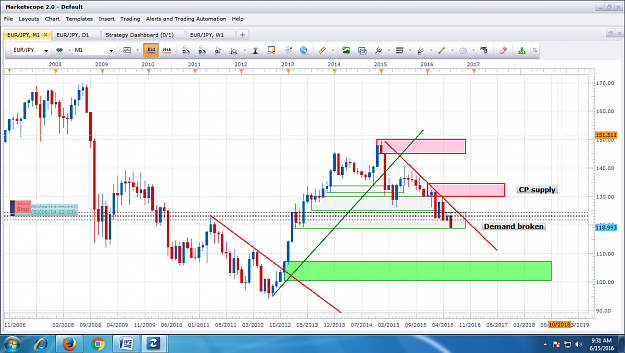
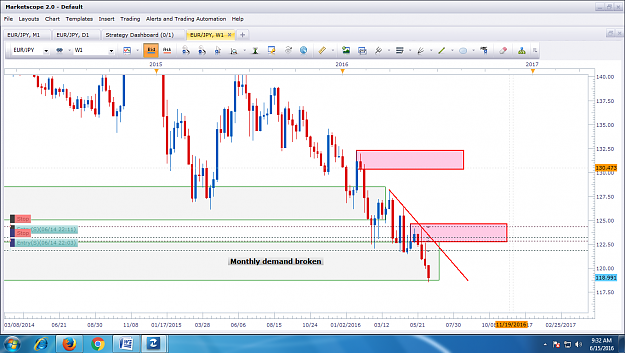
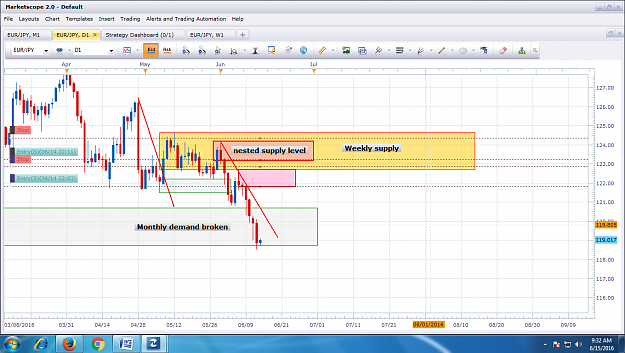
EURJPY broken the monthly demand @118.7 Analysis for the same is as follows Monthly:- Observations:- 1) Price within descending momentum line. 2) Demand taken out 3) New level of supply formed Conclusion: - Clear down trend as price momentum & trend ...
Supply and demand in a nutshell by Alfonso Moreno
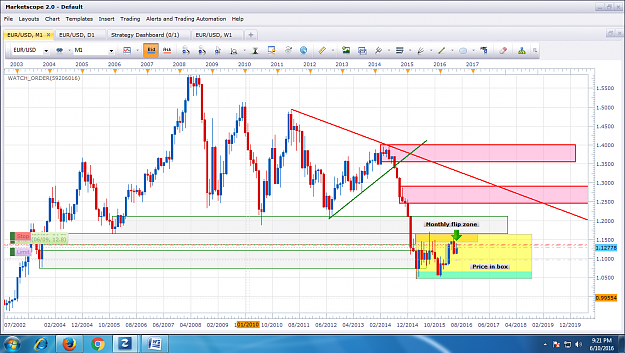
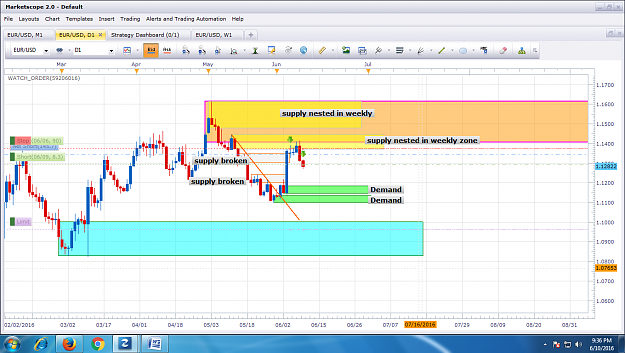
- Vsm replied Jun 10, 2016
EURUSD Short sell playing out nicely Analysis for the same is as follows Monthly:- Observations:- 1) Overall trend is down as new levels of supply are formed & old demands are taken out 2) Possibility of drawing Descending trend line 3) Currently ...
Supply and demand in a nutshell by Alfonso Moreno

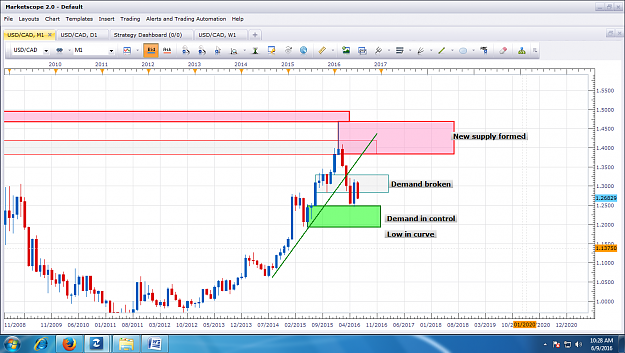
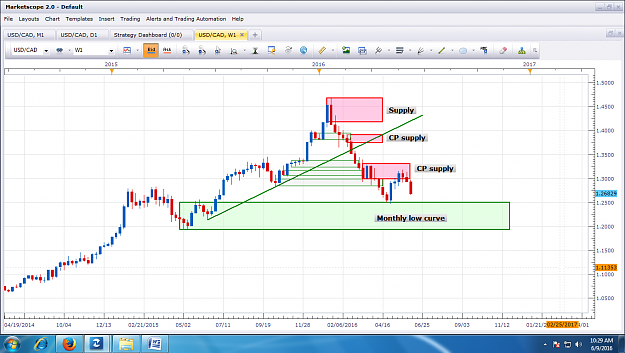
- Vsm replied Jun 9, 2016
Monthly:- Observations :- 1) Ascending trend line broken. 2) Demand taken out 3) No possibility of drawing descending trend line. 4) Monthly demand in control & price low in the monthly curve. 5) New supply zone formed at break of trend line @ ...
Supply and demand in a nutshell by Alfonso Moreno
- Vsm replied Jun 6, 2016
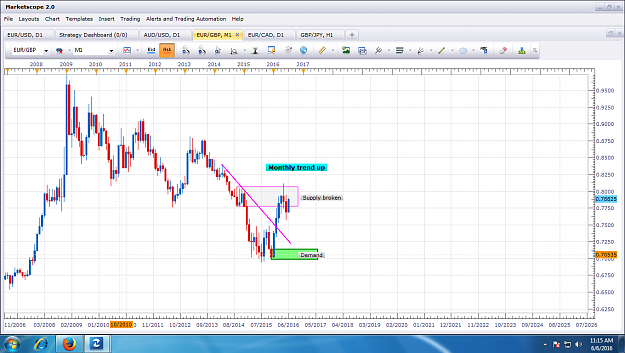
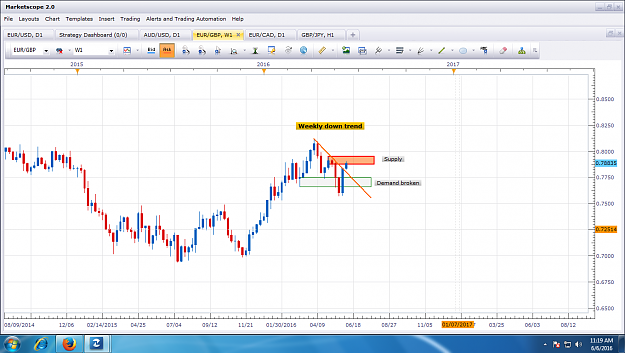
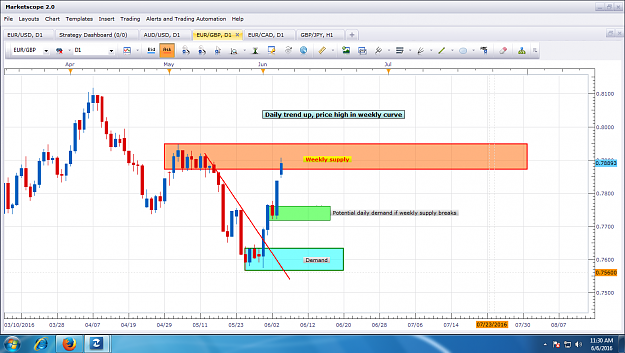
I have different perspective for EURGBP Two options I have on entry the daily time frame 1) Wait for weekly supply to be taken out for long 2) Wait for daily trend to change from up to down with new supply formed on daily time frame ( Confirmation ...
Supply and demand in a nutshell by Alfonso Moreno
- Vsm replied May 28, 2016
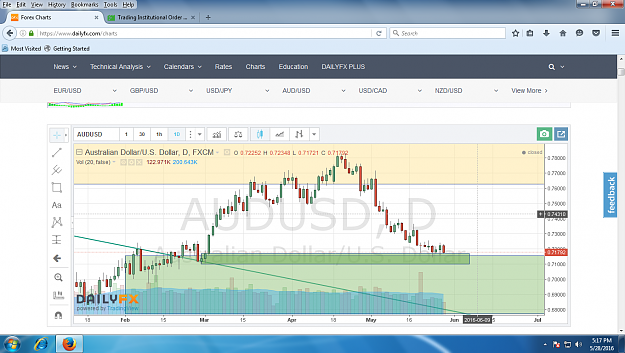
Thanks AKT for distinguishing thee two terminologies Demand zone & Demand area, I will refer Demand area as a buying area to avoid the further confusion. Please also analyze the AUDUSD pair at current price level. Price is at daily demand level ...
Trading Institutional Order Flow
- Vsm replied May 2, 2016
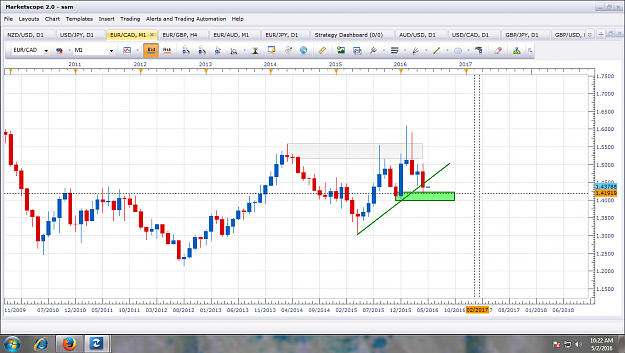
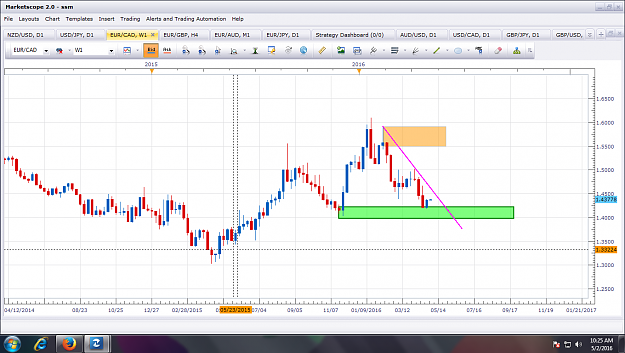
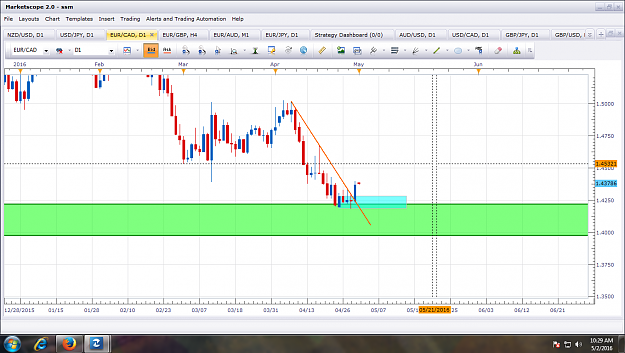
EURCAD Monthly :- Trend is up, price at monthly demand zone ( Low in curve). Stop is around 250 pips which is huge for me, waiting for imbalance to form on daily Weekly:- Out of alignment from monthly hence ignored, weekly supply too far from ...
Supply and demand in a nutshell by Alfonso Moreno
- Vsm replied May 1, 2016
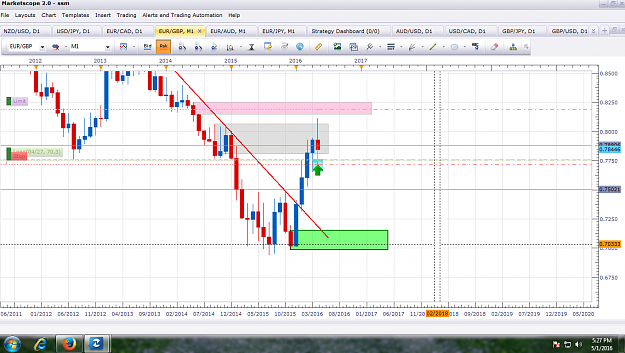
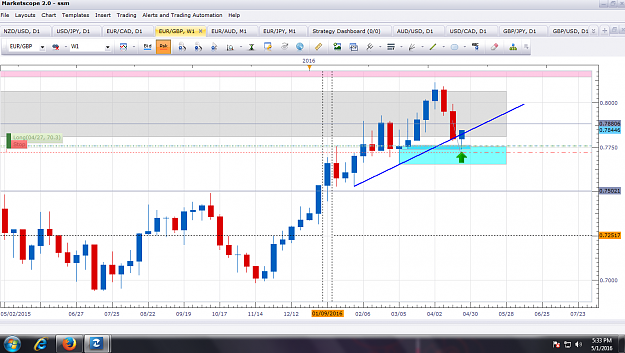
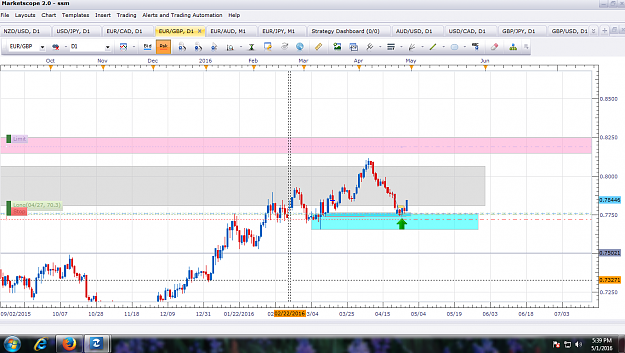
EURGBP Monthly:- trend UP, Price has taken out Monthly supply zone ( Shaded in gray) Weekly & daily time frame close above that area hence no fake out Weekly:- Weekly trend up, No monthly supply in control, Looking to go long at weekly demand zone ...
Supply and demand in a nutshell by Alfonso Moreno
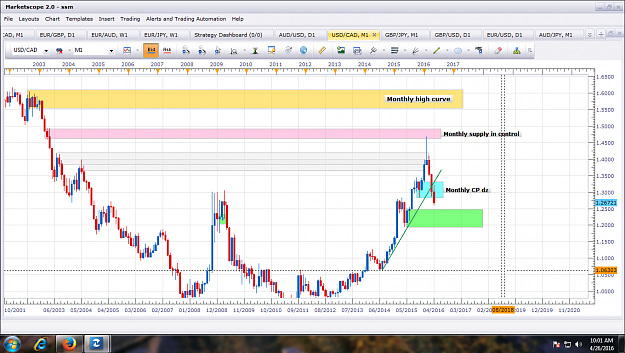
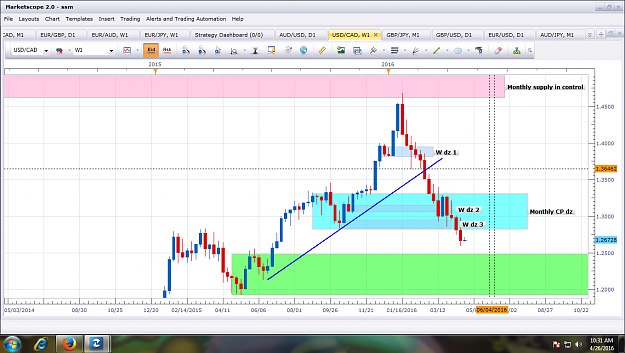
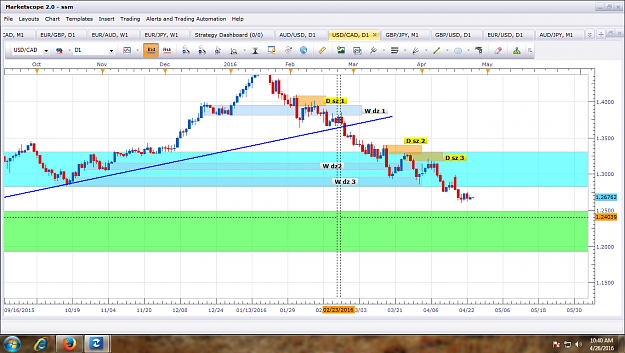
- Vsm replied Apr 26, 2016
Thanks AKT I request you to review my analysis for USDCAD till it break 1.2830 on 12.04.2016, to day it may be hindsight but it will help me to confirm my thinking process is correct. Monthly 1) New demand zones created & earlier supply zones were ...
USD/JPY Discussion
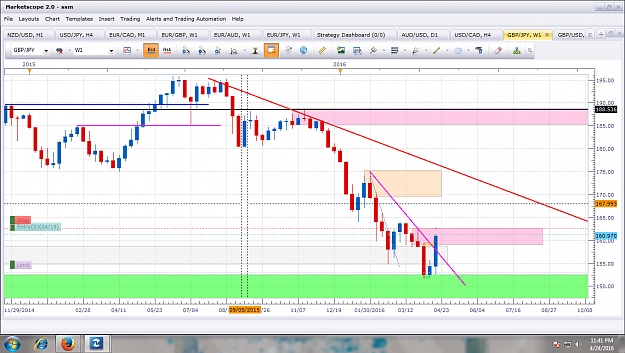
- Vsm replied Apr 24, 2016
Hi AKT The decision for GBPJPY is based on monthly & daily time frame, how ever what should be action when price reaches to weekly supply zone, as Monthly is down which will be best time to sell this pair. I also request you to post the set of rules ...
USD/JPY Discussion
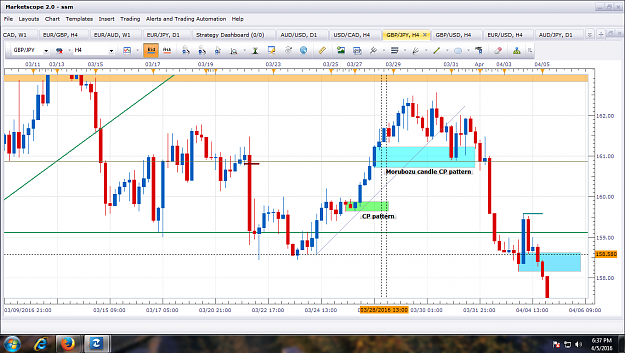
- Vsm replied Apr 5, 2016
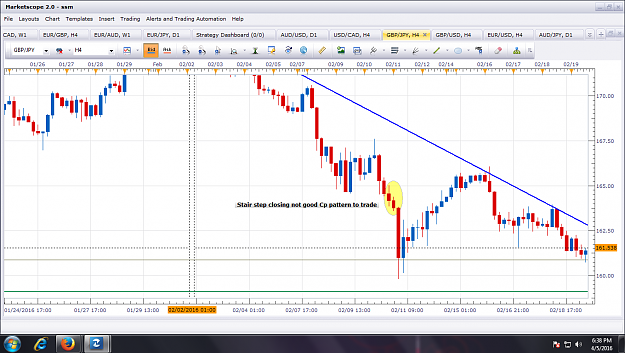
Hi frshaikh please go through following charts for the information you required 1) CP pattern is the pause in the market before the impulse, Normally there are 50 % body candles in base 2) Marubozu candle is also important valid CP pattern 3) Stair ...
Supply and demand in a nutshell by Alfonso Moreno