- Search Forex Factory
- 43 Results (2 Threads , 41 Replies )
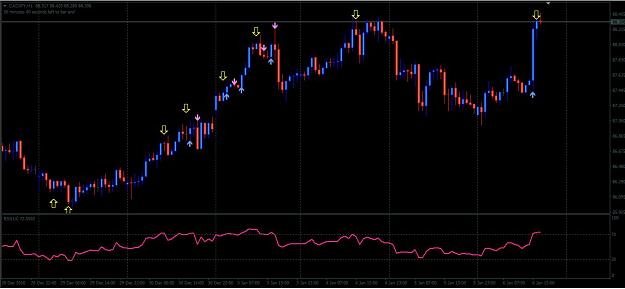
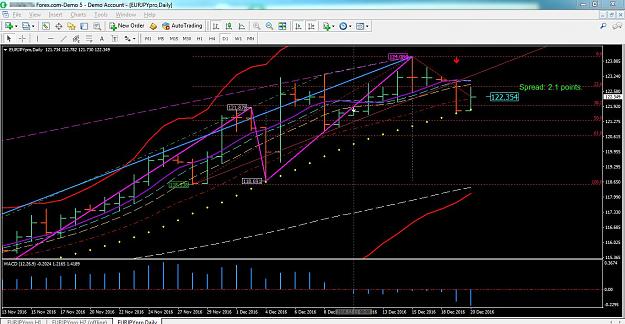
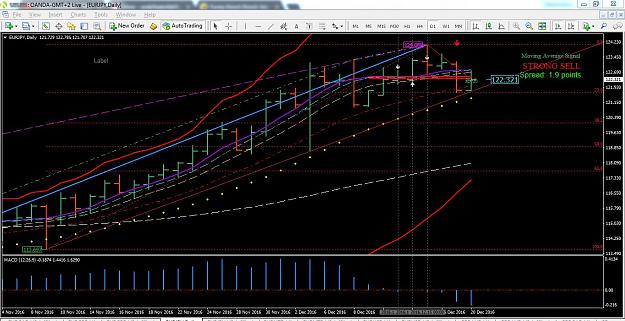
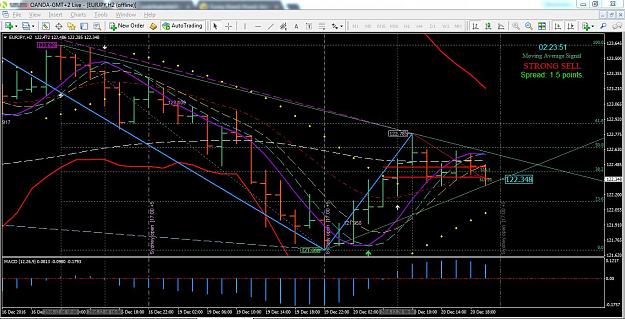
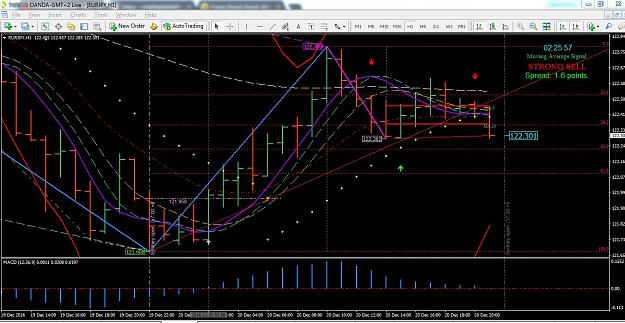
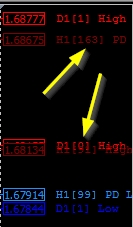
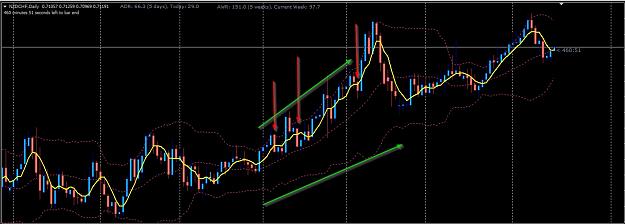
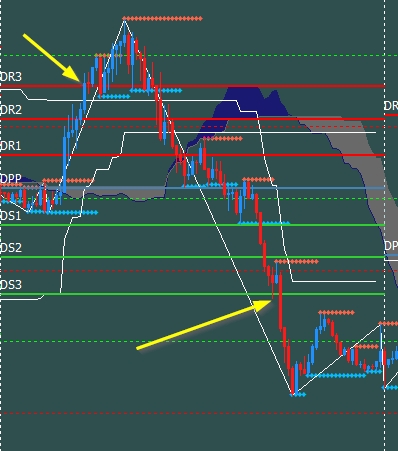
- TrueStoryfx replied Jan 6, 2017
Still does not work. I attached a pic with RSI 14 on 60 min chart. I put yellow candles where indicator should put arrows. The blue and pink arrows is what indicator made which is all over place. Can the arrows that are yellow be made also with push ...
- TrueStoryfx replied Dec 20, 2016
I am not sure if mine is correct? This is the max resolution. in Him.
- TrueStoryfx replied Dec 20, 2016
I downloaded the link my friend. Here is what it looks like now. in Him.
- TrueStoryfx replied Dec 20, 2016
Blessing my friend. Can someone verify if my charts are correct? I am able to see great setups but wants to make sure I am able to see what you guys are seeing. I am using Oanda which is +2 I believe. in Him.
- TrueStoryfx replied Dec 8, 2016
Can someone help me. I am trying to just put the fib numbers in but when i enter they don't give me anything but 0.0. Am I entering the numbers wrong? Fibonacci extension tool with the values: 0, -5, 38, 83
- TrueStoryfx replied Nov 25, 2016
The numbers mean after the time frame such as D1 [01] or H1[163] mean how many bars came after the one, correct? Whats the difference between D1[01] and D1[1]?
- Trading Divergences
I have noticed a lot of divergences with a custom indicator I have had. Does anyone trade ...
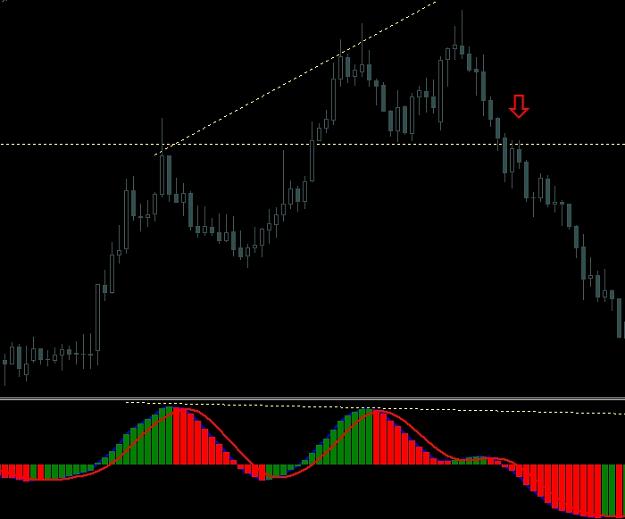
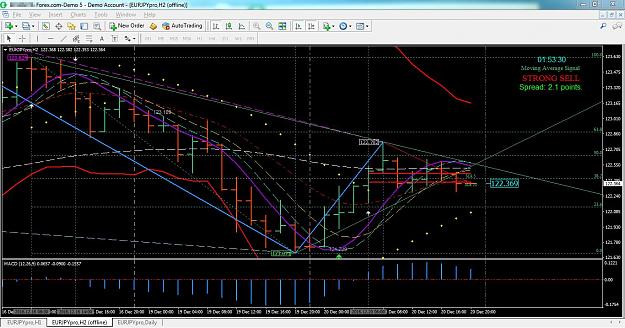
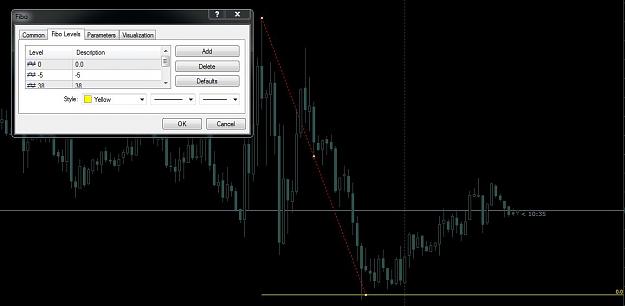
- TrueStoryfx replied Nov 21, 2016
Here are 2 examples.
- MACD Histogram in Bars?
Anyone know where I can find a MACD that looks like the attached picture? All I need to know if it ...
- TrueStoryfx replied Nov 8, 2016
Hi friend, I do not want to make trouble only to show before and after this indicator does repaint, and it repaints heavily. Everyone can try and will see. Before and After on nzd/jpy After shows many dots missing, maybe we take trade here, but now ...
- TrueStoryfx replied Nov 8, 2016
Ok I got it. So does anyone know how to read the Fibo chart?If I see three green arrows do I only look for buys? I see 3 green arrows for aud/chf and aud/jpy, but Tykhev indicator says not same thing. Anyone know if I am reading these together? If ...
- TrueStoryfx replied Nov 8, 2016
I keep trying to upload the indicator, but keeps getting removed. Anyone know why?
- TrueStoryfx replied Sep 16, 2016
I do not want to take away from this great system, I think its great as is. Only playing devils advocate to see the what if scenarios. Price action tells us there were 3 sells that this system would give us, all failed 3x in a row. (red arrow) Has ...
- TrueStoryfx replied Sep 13, 2016
Inception 09-13-2016 Performance (09-13-2016) = $49.78 Current Balance = $450.22 Starting Balance = $500.00 Totals 0.10 = 2 0.20 = 22 0.30 = 23
- TrueStoryfx replied Sep 13, 2016
250,000.00 USD Needed To Go Full Time Starting Balance = $500.00 USD Inception 09-13-2016
- TrueStoryfx replied Sep 8, 2016
Inception 09-07-2016 Performance (09-08-2016) = $56.64 Current Balance = $324.11 Starting Balance = $250.00 Total Points 0.10 = 74
- TrueStoryfx replied Sep 8, 2016
Inception 09-07-2016 Performance (09-07-2016) = $130.75 Current Balance = $380.75 Starting Balance = $250.00 Total Points 0.10 = 130
- TrueStoryfx replied Sep 7, 2016
September 7th, 2016 image
- TrueStoryfx replied Sep 6, 2016
Performance (09-06-2016) = -22 Level 1 = +136 Since Inception (09-01-2016) = +136 Starting Balance = $200.00 Current Balance = $336.28
- TrueStoryfx replied Sep 5, 2016
Performance (09-05-2016) = +109 Level 1 = +158 Since Inception (09-01-2016) = +158 Starting Balance = $200.00 Current Balance = $358.62