- Search Forex Factory
- 13 Results
- Traderdesk replied Jun 17, 2014
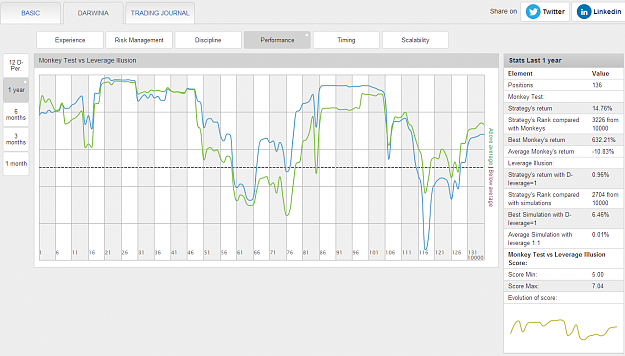
Monkey Test vs. Leverage Illusion Chart How does a good trader prove that luck contributes nothing to his trading the right asset, at the right time, in the right direction? Easy! All it takes is to beat strategies that trade the same assets, at the ...
Is your trading performance good enough for investors?
- Traderdesk replied Oct 1, 2010
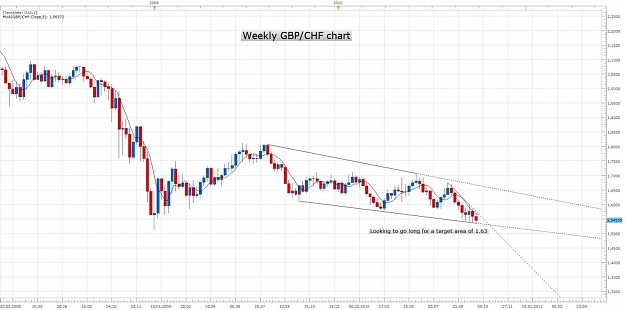
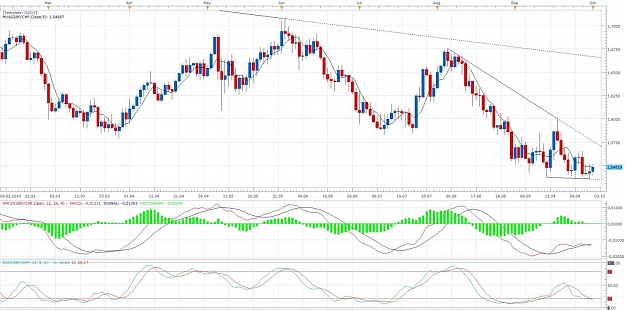
Looking at the GBPCHF setup to go long for one leg. Weekly chart shows price action is at the bottom channel. My buy area is around 1.5410-30 area with stop around 1.5380 for a target price of 1.63 for this leg... I will open up more legs looking to ...
Building an equity millipede
- Traderdesk replied May 19, 2010
Well that was fun for some good pips....
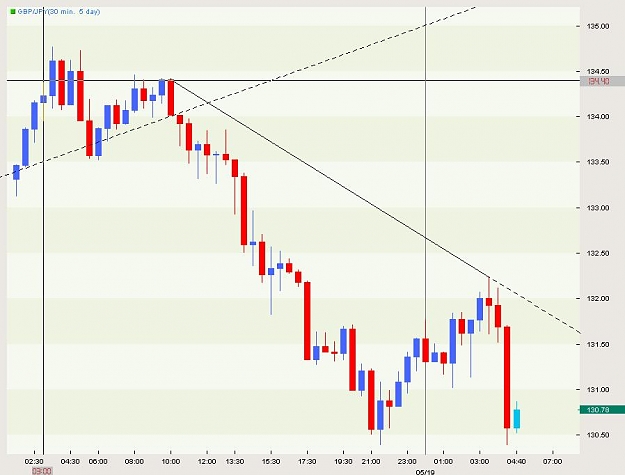
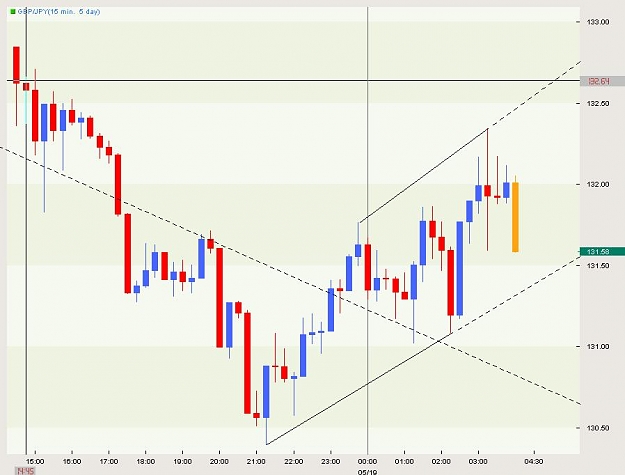
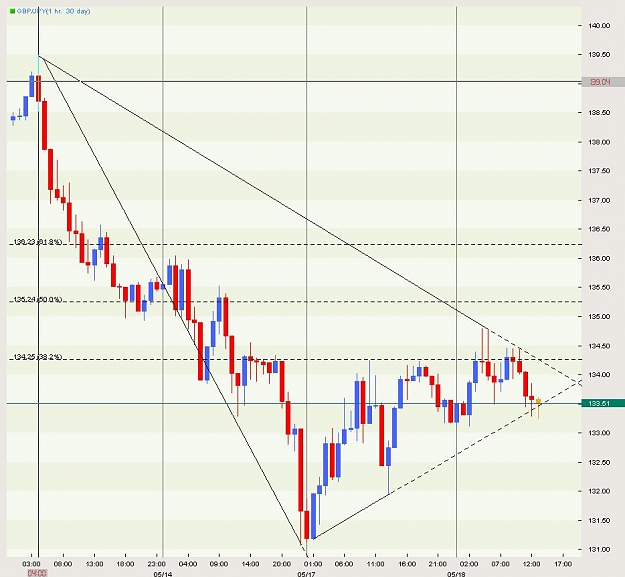
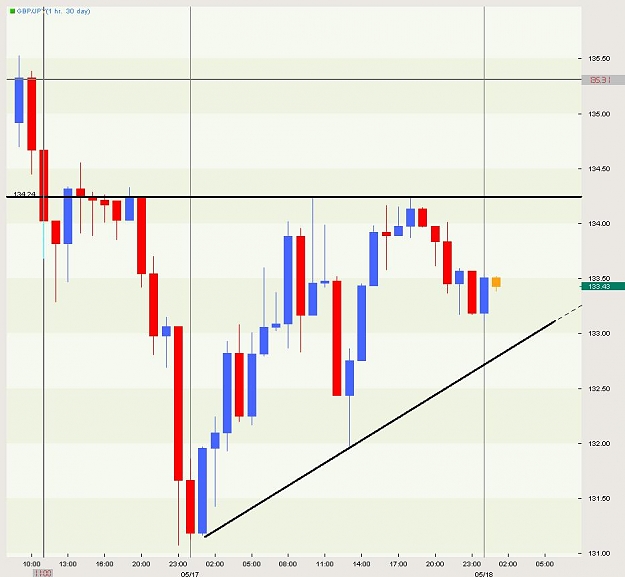
Auslanco - GBP/JPY and GBP/USD (newstrade) Now I would look at adding at 130.85 but even better as you can see on the 30 min. chart we can add at around 131.40-50 for a better R/R...
- Traderdesk replied May 19, 2010
Here is another 15 minute bull channel for this morning... We need to see it break to start our downward journey...
Auslanco - GBP/JPY and GBP/USD (newstrade)
- Traderdesk replied May 19, 2010
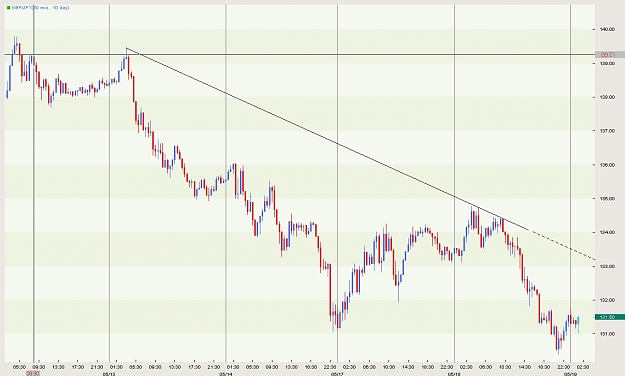
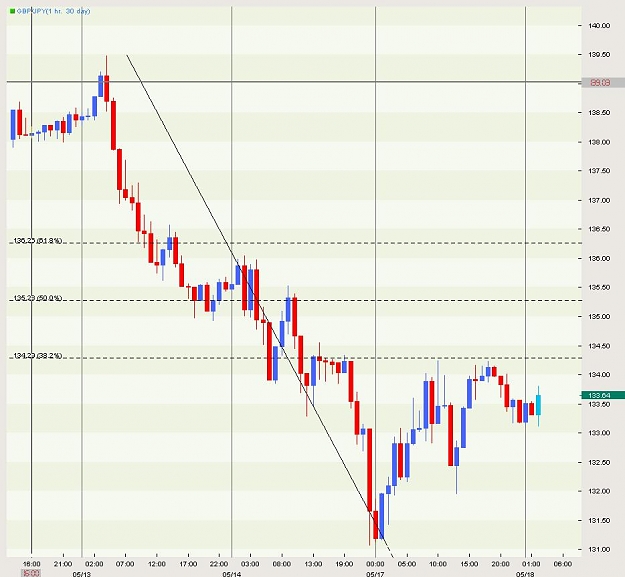
Well here is a 30 minute chart that shows a UTL at around 133 so I would imagine that a few traders are looking for PA to reach near that level before shorting heavily...
Auslanco - GBP/JPY and GBP/USD (newstrade)
- Traderdesk replied May 19, 2010
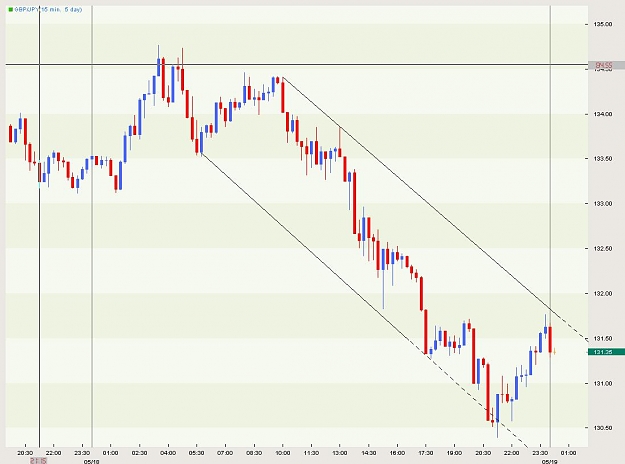
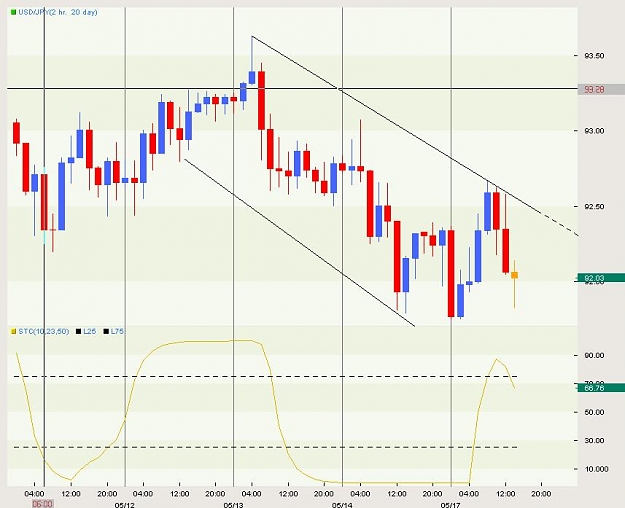
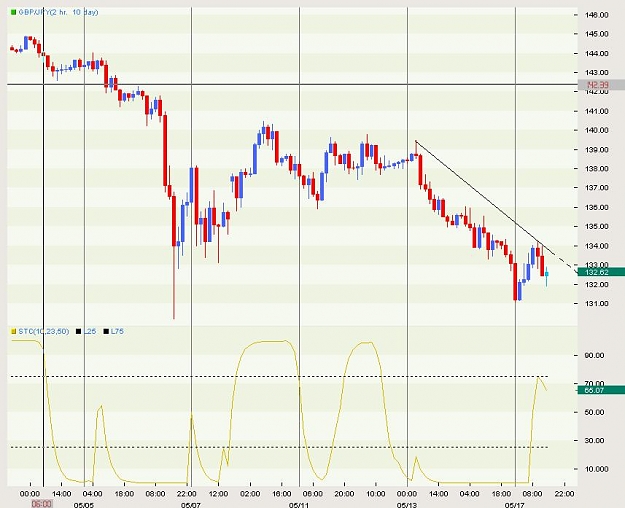
Good morning.... Taking a look at the charts this morning I see we are still on track for shorting later on today...Different area's I would look at would be 131.80 and 132.70 primarily.... The reason why is both are bear channels on the 15 minute ...
Auslanco - GBP/JPY and GBP/USD (newstrade)
- Traderdesk replied May 18, 2010
Well we first have a bearish channel on the hourly chart to take care of. We will need to break the UTL at around 134.20 this time around... Also 133 must hold to help validate this...
Auslanco - GBP/JPY and GBP/USD (newstrade)
- Traderdesk replied May 18, 2010
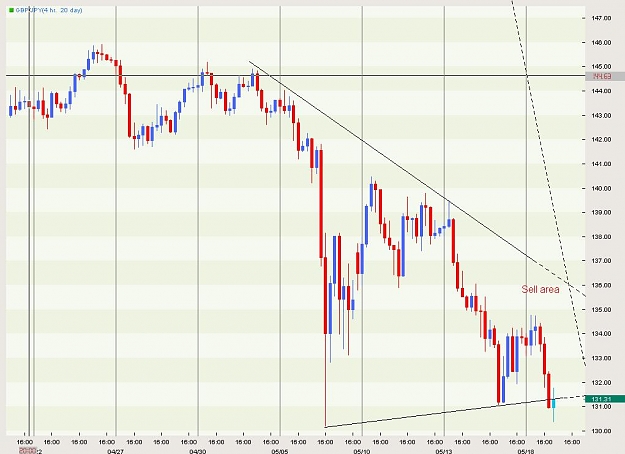
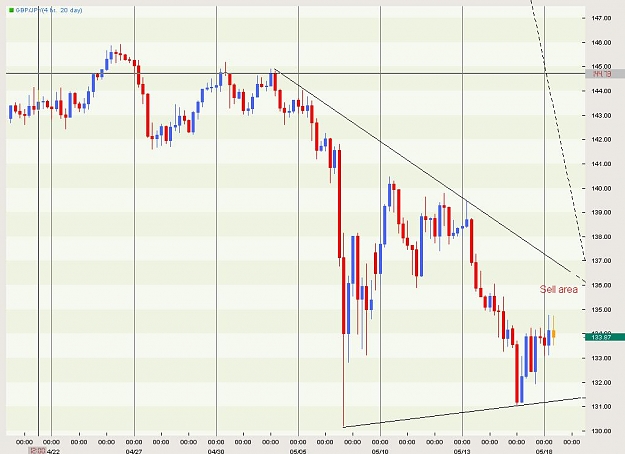
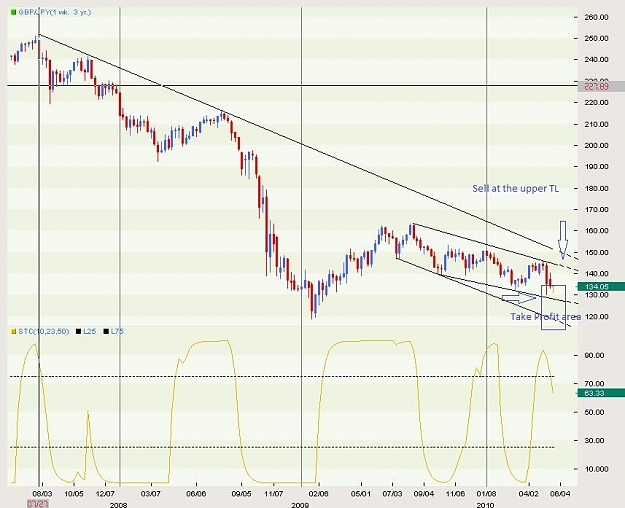
One more observation on the larger time frame using the 4 hour chart. The reasoning for looking at a resumption of the weekly down trend at around 136 level is on the 4 hour chart there is a triangle formed with support at the 131 level and ...
Auslanco - GBP/JPY and GBP/USD (newstrade)
- Traderdesk replied May 18, 2010
Well the way I see it if 133.15 is today's low then I would see a high based on daily pip high/low average for this pair to be around 200 pips... That would give us a high for the day around 135.15 average... Looking at the chart 135.28 would be a ...
Auslanco - GBP/JPY and GBP/USD (newstrade)
- Traderdesk replied May 18, 2010
Well this morning I see that we have an ascending triangle so if we go with the notion that price action will break this top in a bull run then we should see that in the beginning of the London's session....hmm...looking at other pairs I see ...
Auslanco - GBP/JPY and GBP/USD (newstrade)
- Traderdesk replied May 17, 2010
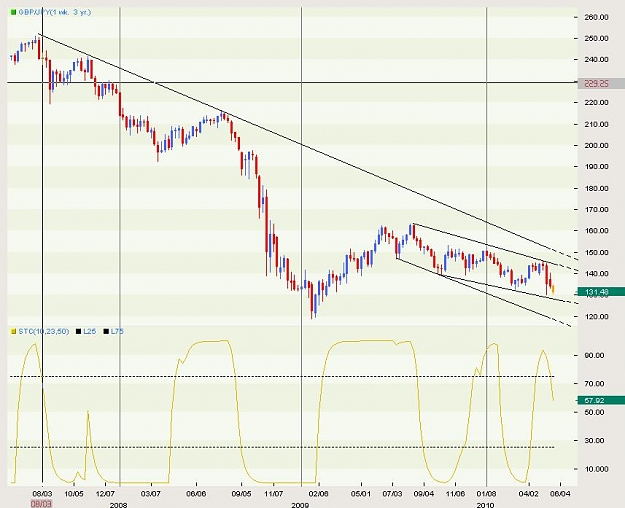
Weekly picture is quite clear on support and resistance areas....
Auslanco - GBP/JPY and GBP/USD (newstrade)
- Traderdesk replied May 17, 2010
Hey you could of waited until my last portion of my long to close at 134.90
Auslanco - GBP/JPY and GBP/USD (newstrade) before allowing the bears out  Well at least I covered 90% of my long for profit... I am looking though to go long for a weekly retracement at 1.30 or 1.25 depending on ...
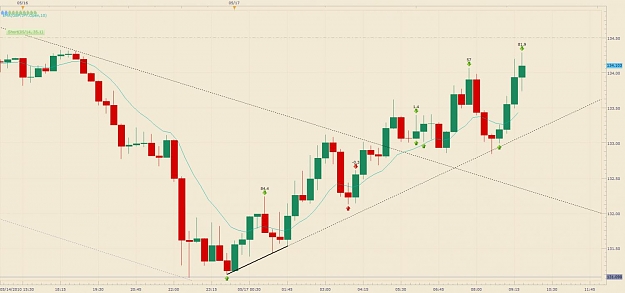
- Traderdesk replied May 17, 2010
Well PA has broken a flag setup on the 15 minute chart that has been in play this morning... Now looking for my target of 134.90... By the way I like direct-trade call longer term...
Auslanco - GBP/JPY and GBP/USD (newstrade)
- Posts by Member Search: 'Traderdesk'