- Search Forex Factory
- 47 Results (1 Thread , 46 Replies )
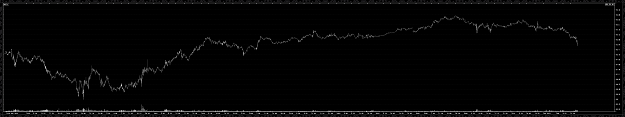
- Charting π (PI)Started Jul 3, 2015|Trading Discussion|14 replies

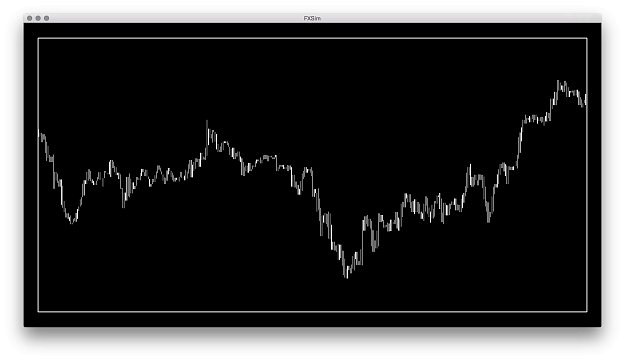
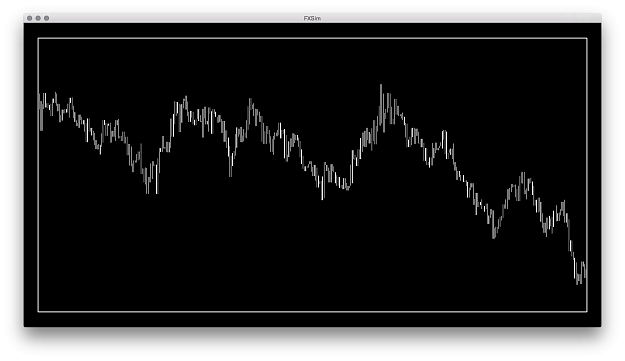
Chart A: {image} {image} Chart B: {image} {image} Either Charts A, or Charts B are PI, can you tell ...
-
 Tavurth replied Jun 29, 2015
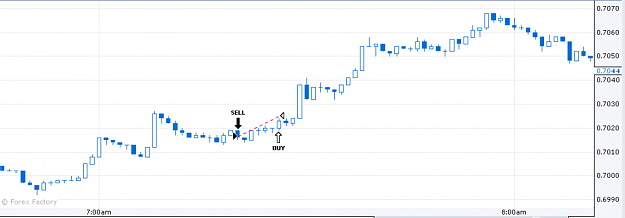
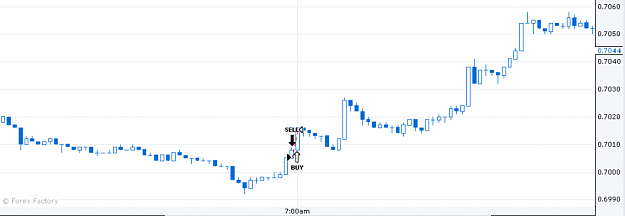
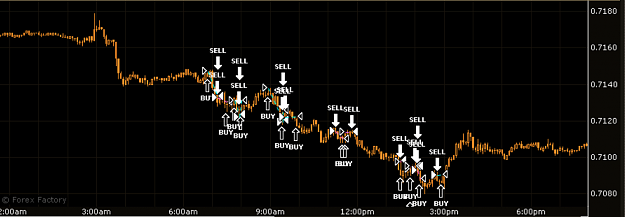
It looks like you are trading against the trend quite often. image image Have you backtested your strategy? When you backtest, and see that in perfect conditions you have an edge, trading becomes much less involving emotionally.
Want to know how to get rich?
- Tavurth replied Jun 23, 2015
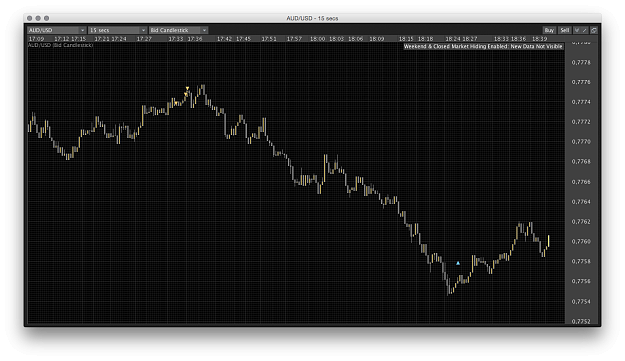
For one days chart, it's a litter of dead trades. What timeframe chart do you trade from? image
Want to know how to get rich?
- Tavurth replied Jun 15, 2015
It was a nice one: image
Forex Dream Chasers - The 90% rule of randomness
- Tavurth replied Jun 11, 2015
Here is a nice trade coming in the same instrument. Perhaps try your money management on this, you can see I've posted ~10pip stop, but feel free to use 20 if it helps you. image
Why Can't I Trade?!
- Tavurth replied Jun 10, 2015
I'm not sure about your system, but as long as you took the trailing 20pip stop at about 0.7665 then It's a good trade. If you're not using trailing stops while sleeping on a trade, then I suggest changing something. image
Why Can't I Trade?!
- Tavurth replied Jan 2, 2015
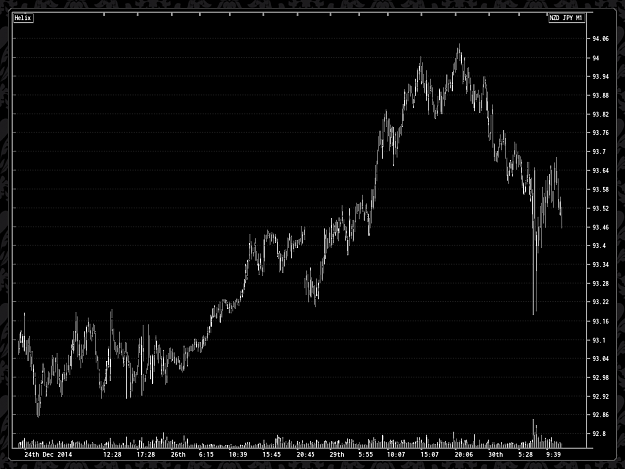
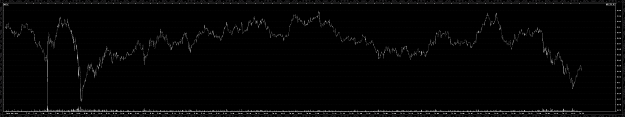
NZDJPY: Chart: Stopped out image Review: I got stopped out in the kiwis fiery plunge. The opposite direction for each of my trades, would have produced a handsome profit. Effect: No edge. V Because: Tendency to change system. V Because: Incomplete ...
MarketProfile and momentum
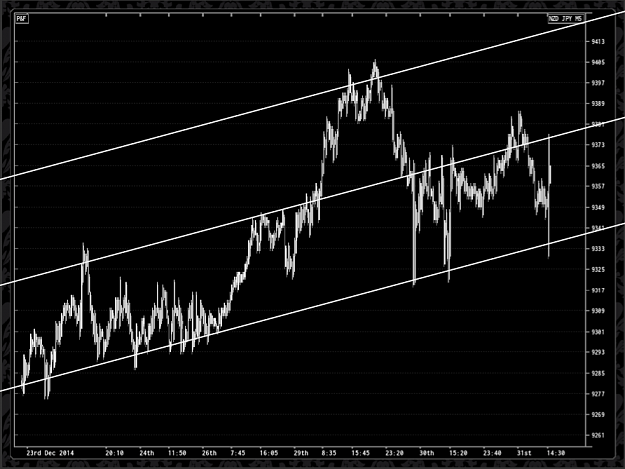
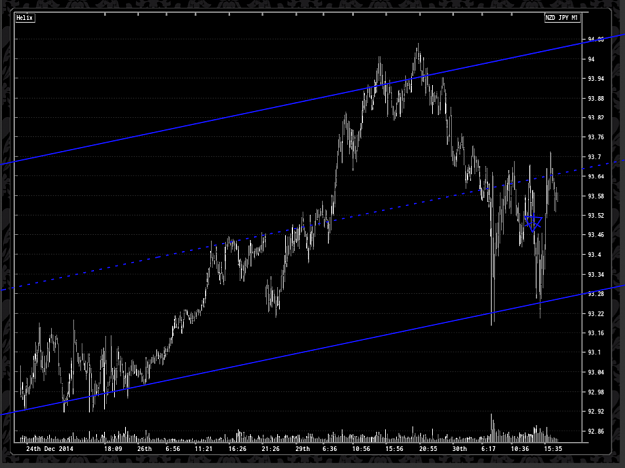
- Tavurth replied Dec 31, 2014
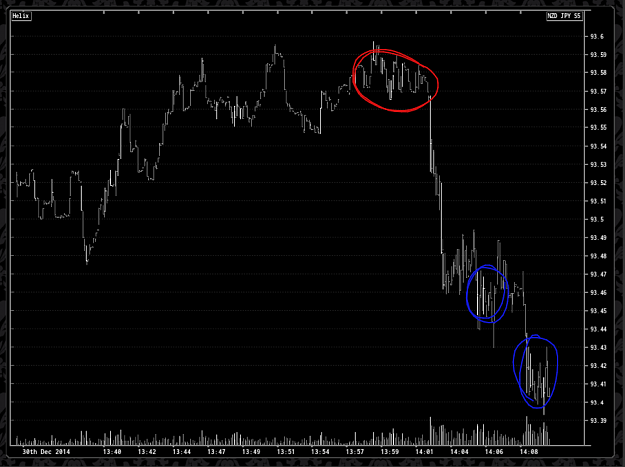
NZDJPY: So lets take a look at what seems to be happening to our position. image There seems to be a declining short interest below 93.4 Stop losses below 93.5 when triggered release coerced liquidity into the market. Demand absorbs this supply ...
MarketProfile and momentum
- Tavurth replied Dec 31, 2014
NZDJPY: Chart: Recorrection of trend error in previous post. image
MarketProfile and momentum
- Tavurth replied Dec 31, 2014
NZDJPY: Chart: Overnight supply at midline. image
MarketProfile and momentum
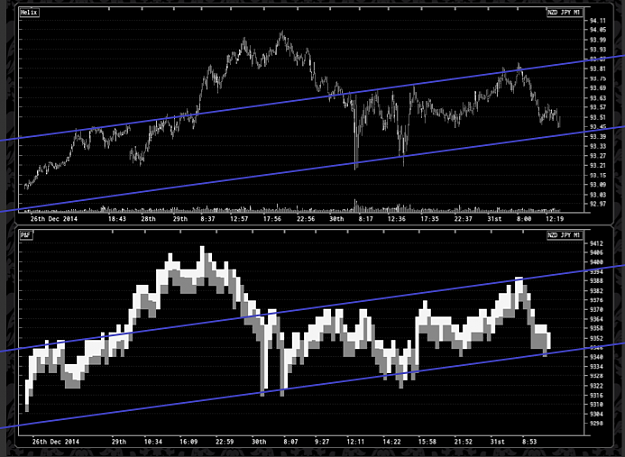
- Tavurth replied Dec 30, 2014
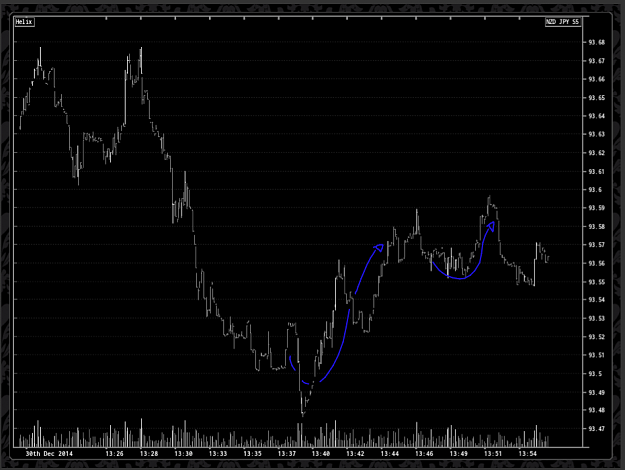
NZDJPY: Chart: I like the overflowing highs, showing plenty of coerced demand. image
MarketProfile and momentum
- Tavurth replied Dec 30, 2014
NZDJPY: Hindsight entry is always 20:20, we'll have to work with what we have. image
MarketProfile and momentum
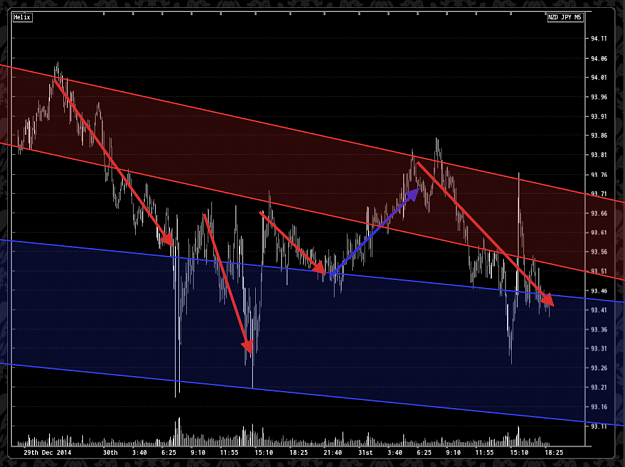
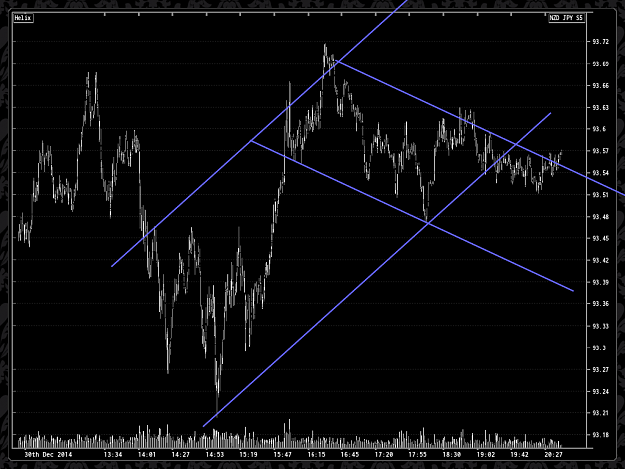
- Tavurth replied Dec 30, 2014
NZDJPY: Perhaps if we drew trendlines as shown: image We would not have taken the trade until the slower trend had been breached. In this way perhaps the entry was an aggressive one. In such cases perhaps consider compensating for excess risk by ...
MarketProfile and momentum
- Tavurth replied Dec 30, 2014
NZDJPY: I wasn't expecting such a surge in short volatility. Possibilities: A: We had a lot of short interest, and the SOS was an upthrust at highs, cleaning the books. This would be bearish. B: Someone unloaded a lot of inventory at the exit of the ...
MarketProfile and momentum
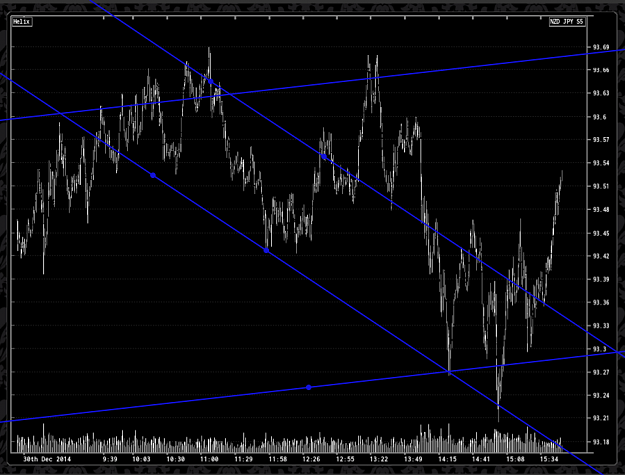
- Tavurth replied Dec 30, 2014
NZDJPY: LPS failure as supply at exit. image
MarketProfile and momentum
- Tavurth replied Dec 30, 2014
NZDJPY: And there is our Long entry. A little large on volatility, yet volume shows low repsonse. image
MarketProfile and momentum
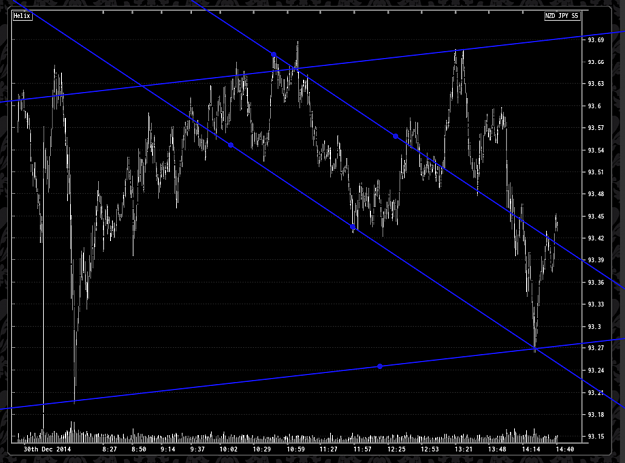
- Tavurth replied Dec 30, 2014
NZDJPY: Sign of Strength (SOS) We're now awaiting a reaction for a LPS (Last point of support) for our long entry. image
MarketProfile and momentum
- Tavurth replied Dec 30, 2014
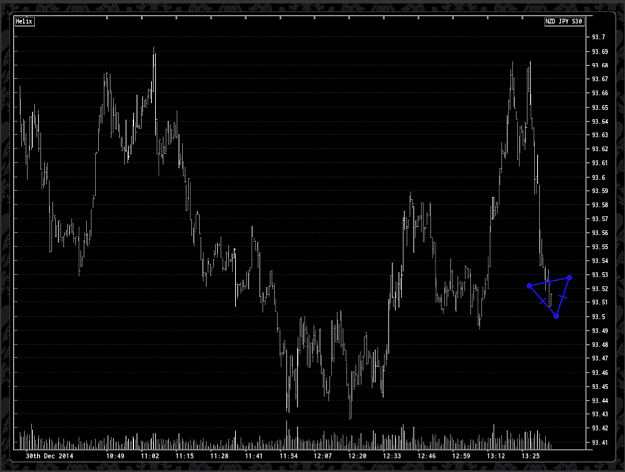
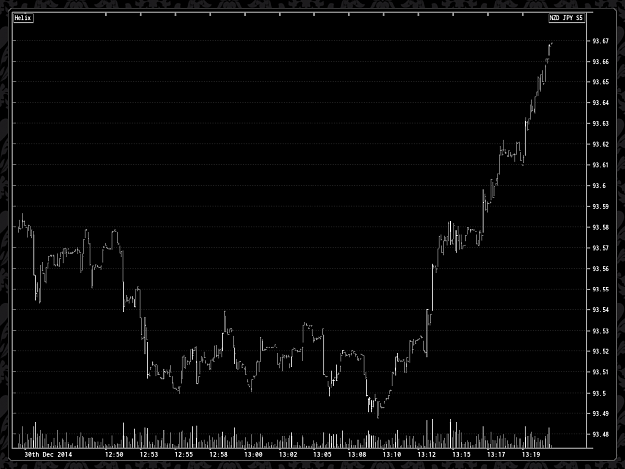
NZDJPY: A short from the highs of supply yesterday would have done well. image Chart: Supply dries up below 93.4. image
MarketProfile and momentum