- Search Forex Factory
- 124 Results (1 Thread , 123 Replies )
-
 Shaltay replied Jan 29, 2014
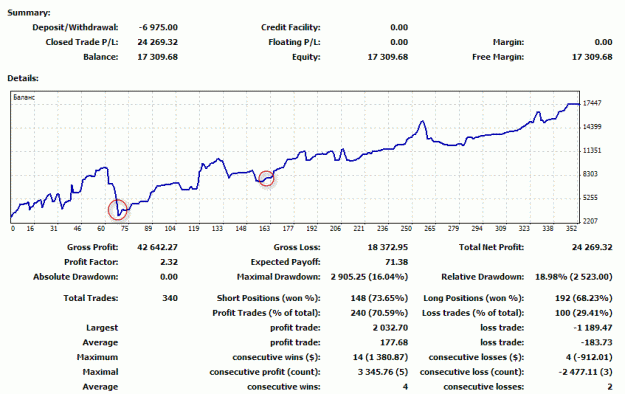
On the importance of a sixth sense at the edge of an "apocalypses": I had a Sell position in EURJPY, and it could be in profit at this moment. But this morning it was under water, and though there were no logical reasons to stop it, and there were ...
Trial Run for Volume&Range Patterns
- Shaltay replied Nov 26, 2013
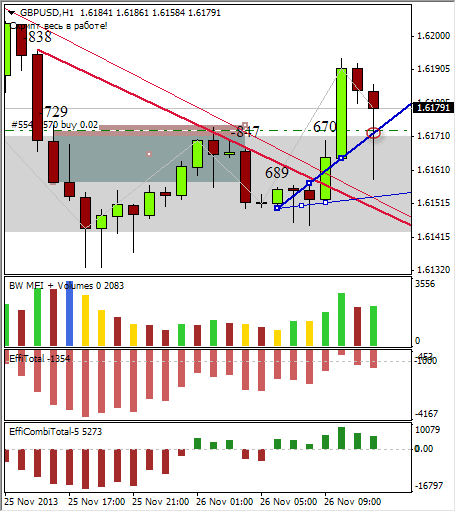
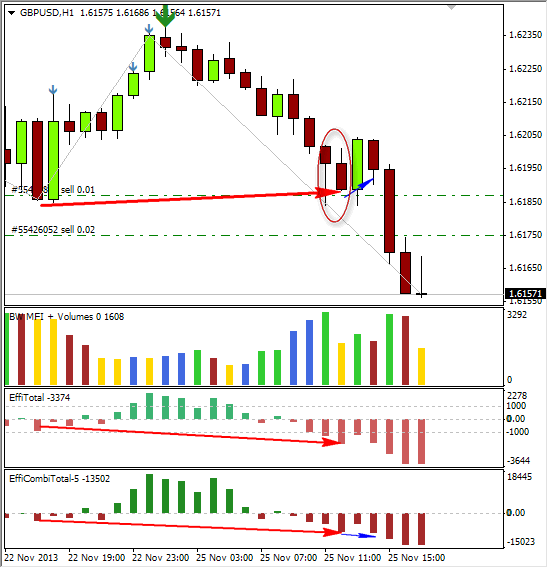
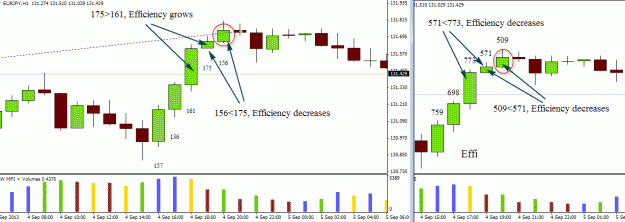
GBPUSD bought @ 1.6170. Leaving the drift sand zone (gray) the price went upwards, then returned to the bullish main trend line (blue). Together with the difference of the shapes in Effi diagrams it was a strong buy signal. Stop-loss would happen if ...
Trial Run for Volume&Range Patterns
- Shaltay replied Nov 26, 2013
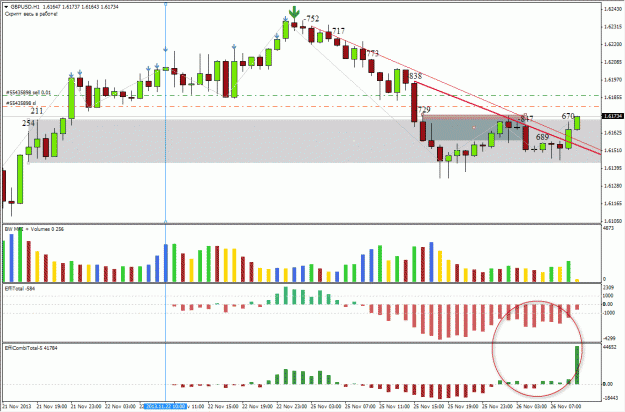
GBPUSD: The last stake didn’t win much. H1 candle efficiently closed above the bearish basic and main trend lines, and there is a divergence in the shapes of Effi diagrams (the red circle). I closed one position and put a small BE at the second (and ...
Trial Run for Volume&Range Patterns
- Shaltay replied Nov 25, 2013
While waiting for pending Sell orders in GBPUSD I also opened a Sell trade at the breakout of Effi inside bar supported with the divergences growing down.
Trial Run for Volume&Range Patterns
- Shaltay replied Nov 25, 2013
I put pending Sell Stop orders in GBPUSD hoping for the breakout of reinforcement candles on Daily and Weekly charts (@ 1.6175 and 1.6055 accordingly). There are no clearly visible signs of reversal yet, except the fact that on Daily the horizontal ...
Trial Run for Volume&Range Patterns
- Shaltay replied Nov 20, 2013
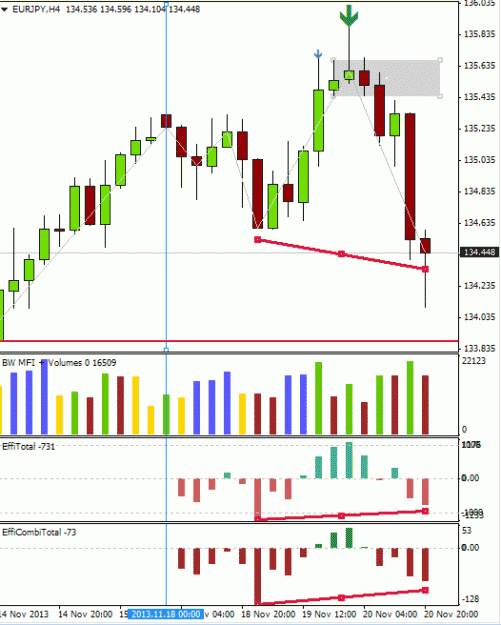
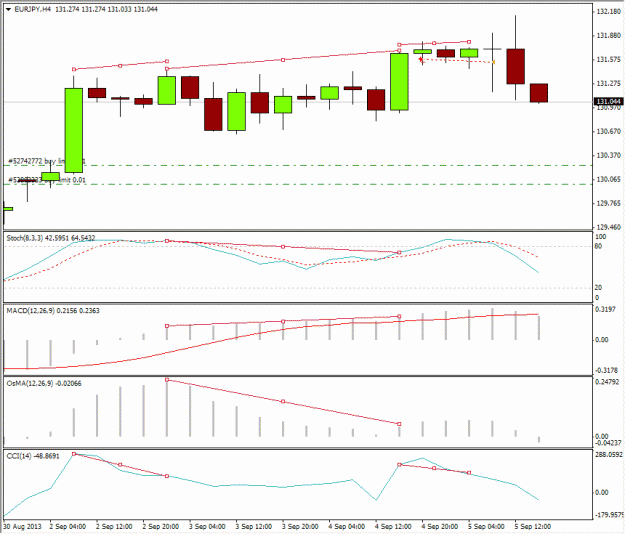
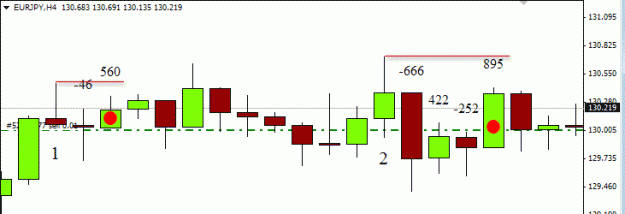
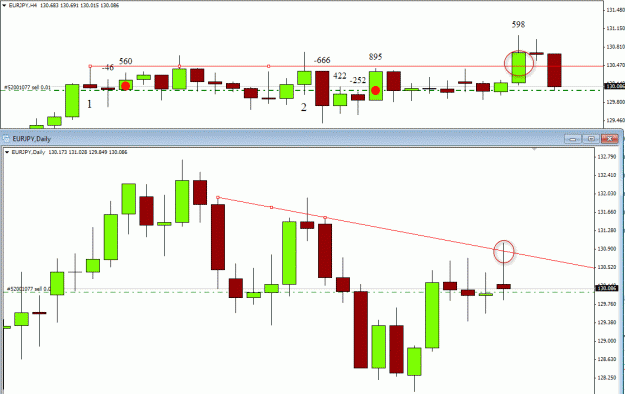
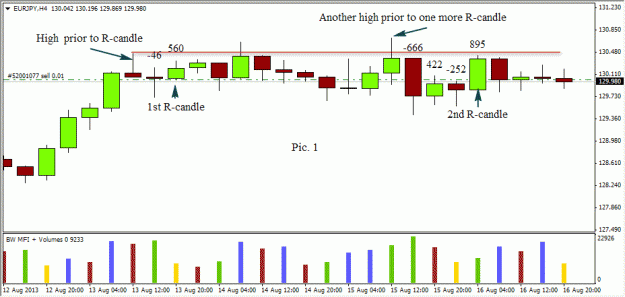
EURJPY: The price didn't reach my target zone, but I don't like the picture on H4 at the last minute before the end of the day. I closed the Sell trades here. image
Trial Run for Volume&Range Patterns
- Shaltay replied Nov 20, 2013
EURJPY - pure Effi trade, the detailed explanation of the trading decision. First, I was wrong removing BWMFI+Volumes from the chart. It absolutely belongs to Effi method. Volume values are necessary to determine supdem zones and drift sand zones. ...
Trial Run for Volume&Range Patterns
- Shaltay replied Nov 19, 2013
Hi OneMoreFloor, sorry for the late answer, there was no notification from FF. I can honestly say that with EFFI analysis my trading became much better; the share of guessing and hoping was significantly reduced. And yes, EFFI readings are the core ...
Trial Run for Volume&Range Patterns
- Shaltay replied Sep 16, 2013
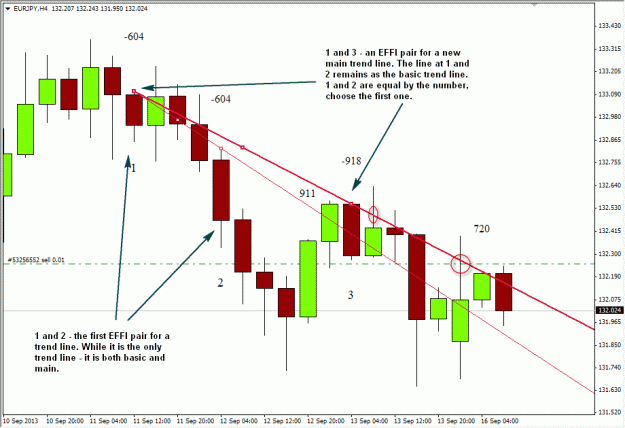
Example of drawing EFFI trend lines, and an indicator to help drawing Supply and Demand levels. 1) The weekend didn’t bring any changes in EURJPY, despite many gaps in other pairs, and I continue in the bearish mood. Here is a recent example of my ...
Trial Run for Volume&Range Patterns
- Shaltay replied Sep 12, 2013
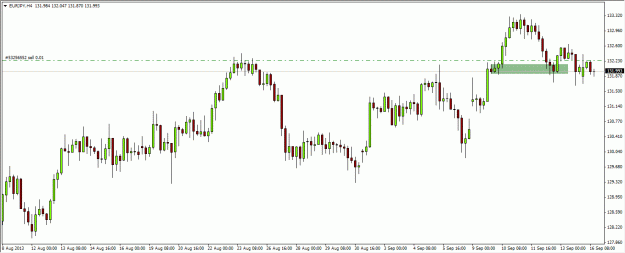
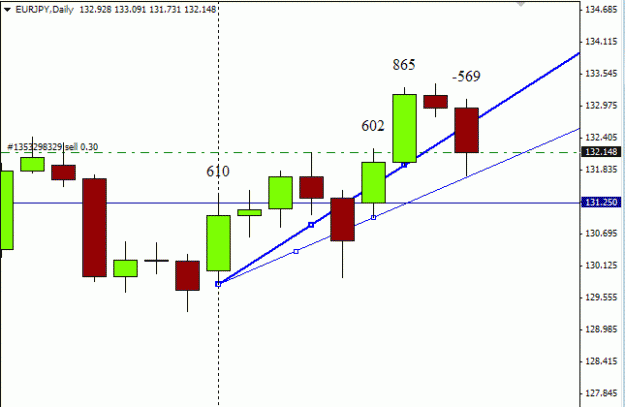
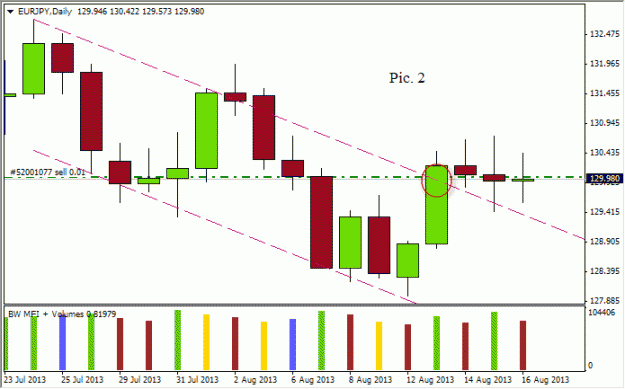
EURJPY: The daily candle has recently crossed the main trend line and bounced from the basic trend line (on my chart), but without much enthusiasm. image If the daily candle grows efficient (for that it should close somewhere below 132.10, I ...
Trial Run for Volume&Range Patterns
- Shaltay replied Sep 5, 2013
Hi DrNoStopLoss, I’ve broken my brain over these Effi variants. My original equation (with volume in it) and the coder’s simplified version (without volume after the mathematical reduction) – both give the same result as they are. My original ...
Trial Run for Volume&Range Patterns
- Shaltay replied Sep 2, 2013
What a strange amendment in the new version of MT4! Last week I placed take profits for my Buy positions in EURJPY. For a long-term trade it was at 135.50, and it is so on my live account. But on demo it happened to be 130.50 instead of 135.50, in ...
Trial Run for Volume&Range Patterns

- Shaltay replied Aug 22, 2013
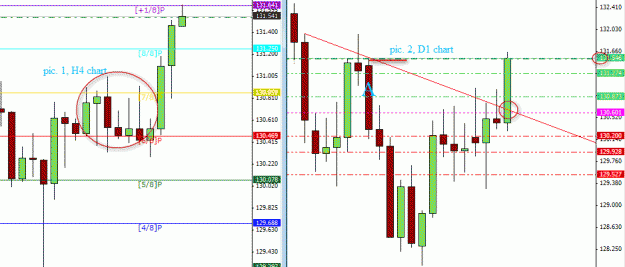
EURJPY. Two illustrations for the old posts about Murray lines and EFFI candles of ABC types and a new Sell trade. Pic.1. This is one of the variants how the price can act close to 7/8 level before trying to reach 8/8 level: many attacks, and all ...
Trial Run for Volume&Range Patterns
- Shaltay replied Aug 19, 2013
It would be perfect
Trial Run for Volume&Range Patterns Ok, more questions and answers. Question 2. Can you explain a reinforcement candle in more depth? I guess, you’ve already read the post about the model of the broken reinforcement in the blog ( url ), so I’ll explain precisely ...
- Shaltay replied Aug 17, 2013
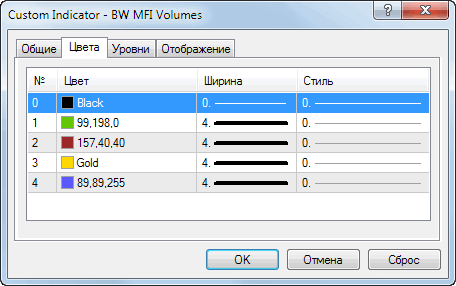
My BWMFI+Volumes colors are image It will, sure. Is it a problem? I don't think so. ( "Yep"... "Nope" -
Trial Run for Volume&Range Patterns "Interstate 60") I can't see all possible trades on my charts, you will not see all possible trades on your charts, all of us will see their ...
- Shaltay replied Aug 17, 2013
Hi Raymond, Yes, the chart is nice, though I would like to know how you've chosen the colors for BWMFI+Volumes. Mine are: Green for (MFI up, Volume up); yellow for (MFI up, Volume down); blue for (MFI down, Volume up); brown for (MFI down, Volume ...
Trial Run for Volume&Range Patterns
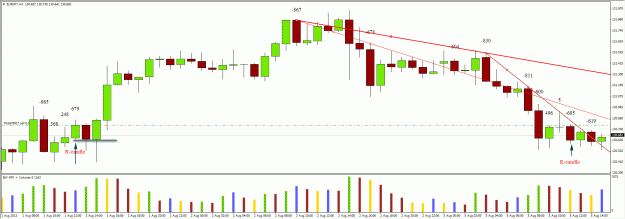
- Shaltay replied Aug 6, 2013
And the reasons for today's SELLs in EURJPY: These positions were opened at the pullback to the broken yesterday main trend line on H4 chart. At the same time, on H1 chart the price broke down the main and the basic trend lines at once. Stop loss ...
Trial Run for Volume&Range Patterns
- Shaltay replied Aug 6, 2013
Hi Ati, This indicator is Market Facilitation Index of Bill Williams combined with volumes. It doesn’t create spikes in the diagram at the opening of a new period and saves place on the chart. It shows exactly what BW said: interest (green)/fake ...
Trial Run for Volume&Range Patterns

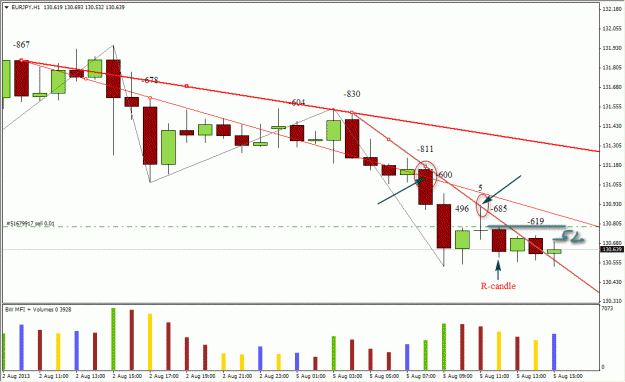
- Shaltay replied Aug 5, 2013
I opened a Sell in EURJPY at 130.78 in my live account, but by mistake chose another demo for this trade, and it will not appear in the Trade Explorer. Here are the reasons for the position and a possible stop. On H4 chart the bearish candle ...
Trial Run for Volume&Range Patterns
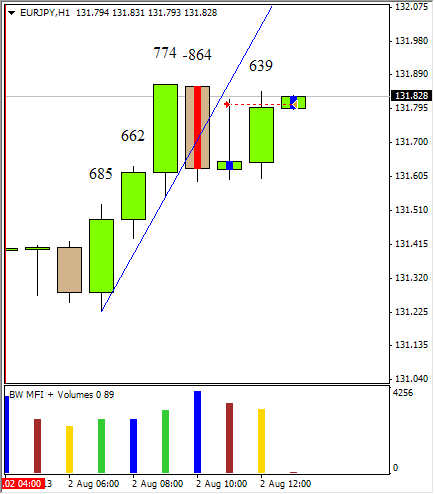
- Shaltay replied Aug 2, 2013
A bit more about my stops. I took a trial Sell in EURJPY H1 after the efficient breakout of the recent trend line, and the appearance of EFFI inside bar, though a “second-class” one, with more volume in it than in the chief candle. I waited for a ...
Trial Run for Volume&Range Patterns