- Search Forex Factory
- 29 Results
-
 Seepiprun replied Jul 23, 2012
1.07 is where the buyers will be laying because price took off extreme fast here, which means alot of buyers, possible enough to stop downward move ment.
EURUSD
- Seepiprun replied Dec 1, 2010
Equilibrium: This is an example on market equilibrium. I think it could help some of you, I hope! Ø When the market is in equilibrium there is an equal amount of buyers and sellers in the market. With average or above average volume, price can be ...
vsa with Malcolm
- Seepiprun replied Dec 1, 2010
EUR/USD 1. Squat candle: High volume down candle with small body at the bottom of the mini trend. Ø Evidence buyers have enters Ø The reason the trend stops here is because it is at the bottom of the right shoulder of a possible head and shoulders ...
vsa with Malcolm
- Seepiprun replied Nov 12, 2010
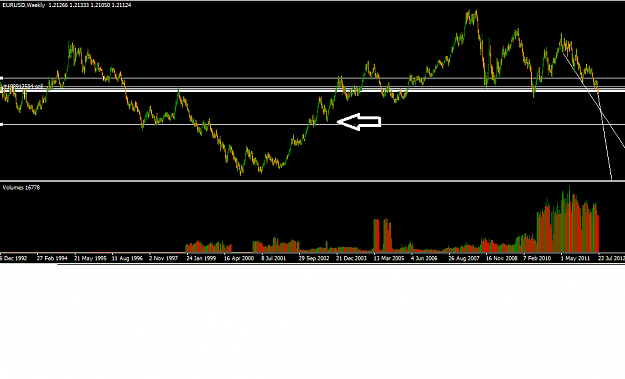
The head of a head and shoulders is considered a false breakout. And that is what we have at the moment, a false break. Price broke below the long term range and then moved back into it. And it also moved above the low of the left shoulder. There is ...
vsa with Malcolm

- Seepiprun replied Nov 12, 2010
The circle is the left shoulder of a possible head and shoulders setup. Im just waiting for the formation of the possible right shoulder.
vsa with Malcolm
- Seepiprun replied Nov 10, 2010
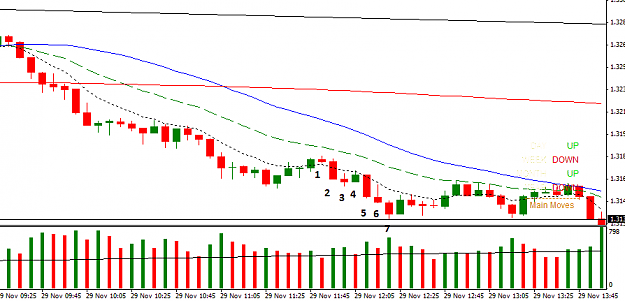
EURO/USD 5 Minutes Chart: The 1st chart I enter the trade here on the first arrow. 1st arrow: No supply · There is now enough back ground buying to suspect an up move · No supply happens within all of the high volume candles · Also we are at the ...
vsa with Malcolm

- Seepiprun replied Nov 8, 2010
The Current Trade: Alot of buying in the background on the bottom of the range 1st arrow is a test 2nd arrow a hidden test: price goes down then goes backup on low volume showing there are no more sellers. When this happen price can go up with ...
vsa with Malcolm
- Seepiprun replied Nov 3, 2010
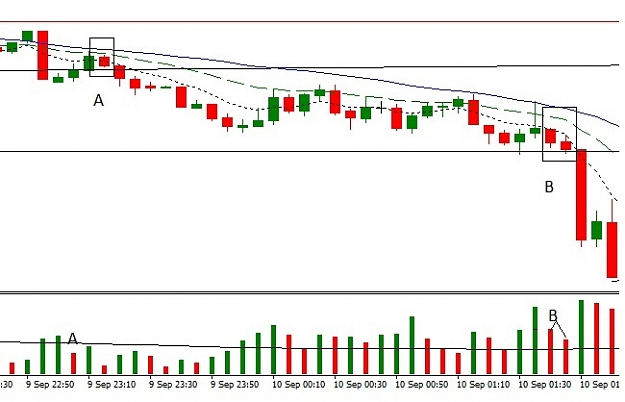
A. Wide Spread down candle closing off the low and closing at the bottom of the range with the next candle closing up B. A Squat candle closing off the low with high volume C. 3 no demands that have selling in them which can be seen with closing off ...
vsa with Malcolm
- Seepiprun replied Sep 14, 2010
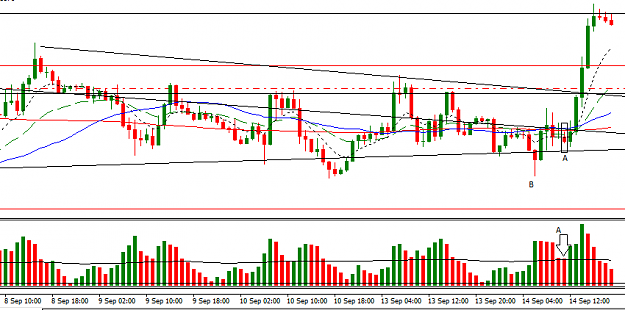
GBP/USD had a good 1 hour setup today. A. This your no supply or test B. A shakeout that happen before the no supply A Marriage made in heaven
vsa with Malcolm
- Seepiprun replied Sep 14, 2010
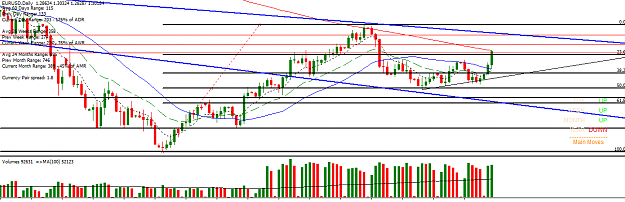
38 and 50 Fib retracement on any chart is high probability of a continued up move or down move. Likely scenario is retest of high or channel trend line in blue. EUR/USD Daily
vsa with Malcolm
- Seepiprun replied Sep 12, 2010
I have to ask because I see this all the time. In hiddengaps chart there is an upthurst and then 2 low volume down candles before price falls of the cliff. If you look in many trend you will see same thing over and over. I no there is no hidden test ...
vsa with Malcolm
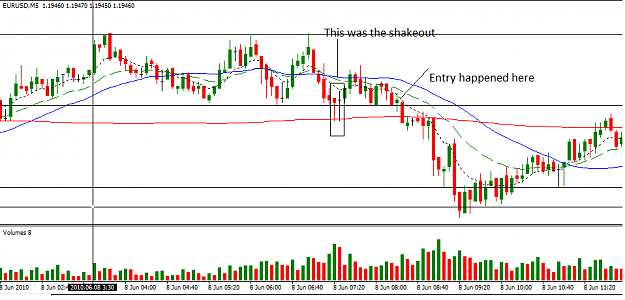
- Seepiprun replied Jun 9, 2010
Malcomb you are right about the no demand i need to relook at my notes again. But i entered after the shakeout passed and most of the buyer were absorbed. I guess it is not truely vsa but i mix in my own strategy. But do you VSA principals to help ...
Trade Using VSA (Volume Spread Analysis)
- Seepiprun replied Jun 8, 2010
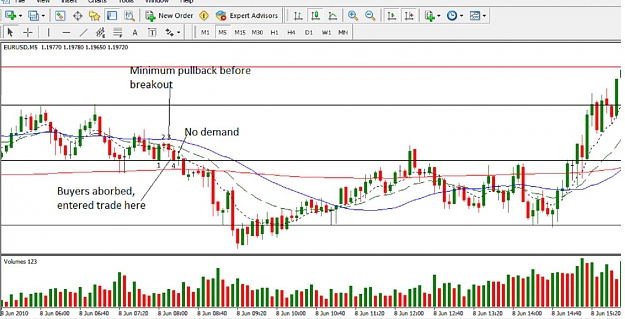
]Here is a trade from last night. I waited for breakout. Background: Desending triangle with lower highs Minimum pullback from the breakout line buyer were absorbed 1.If you look at the minimum pull back you will see buyers entering with a large ...
Trade Using VSA (Volume Spread Analysis)
- Seepiprun replied Oct 26, 2008
breakout GBP/USD — It been a while since I posted here. I have been at school its hard to find time to post on this forum. Everyone should study the history of the currency that you trade by going one candle at a time (press f12). It will ...
4 Hour Strategy (MACD)
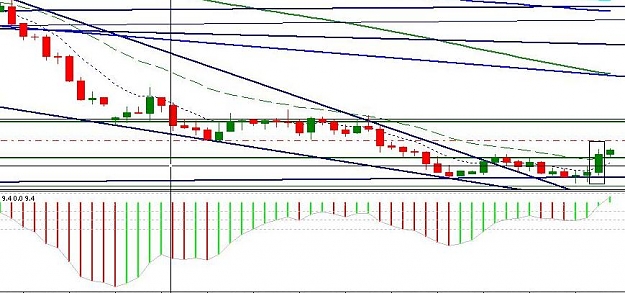
- Seepiprun replied Sep 22, 2008
image Took this trade on GBP/USD Price made a higher low MACD made a zero break Price was under 50 sma Resistence on 50 and 200 together Took 10 pips profit target profit was at previous low
5Min Intraday System
- Seepiprun replied Aug 19, 2008
I enter Eur/USD this morning. Reason for trade: 4hr Higher low 4hr double tails down 4 hr TC up Daily double bottom Weekly trend line that bshadroo point outEnter: 1.4710 Stop loss: 1.4663 Took Profit: 19 pips 1.4729 Opened second trade: up 35 pips ...
4 Hour Strategy (MACD)
- Seepiprun replied Aug 12, 2008
USD/JPY This a great emotion setup. There is alot of emotion building up and you can see how powerful the downward movement is. There is lower highs, great engulfing candle, and a nice TC down on the second candle. You can enter after the tail up. ...
4 Hour Strategy (MACD)
- Seepiprun replied Aug 12, 2008
EUR/USD emotion is building up on 4 hr and daily, possible breakout coming up? The more consecutive candles you have the more powerful the breakout will be. image image
4 Hour Strategy (MACD)
- Seepiprun replied Aug 11, 2008
I wish I noticed the double top on the weekly early I would have known what to expect. image But I would expect, now, for the EUR/USD have a retracement or consolication before moving down again.
4 Hour Strategy (MACD)
- Seepiprun replied Aug 6, 2008
I enter on the second green bar double bottom. Reason for enter the trade: Enter 1.5436 SL 40pips (below last candle) First green candles is engulfing Double bottom forming Lower high & TC up Price Near Bottom of price channelI think the odds are in ...
4 Hour Strategy (MACD)