- Search Forex Factory
- 21 Results
-
 Red Herring replied Aug 1, 2013
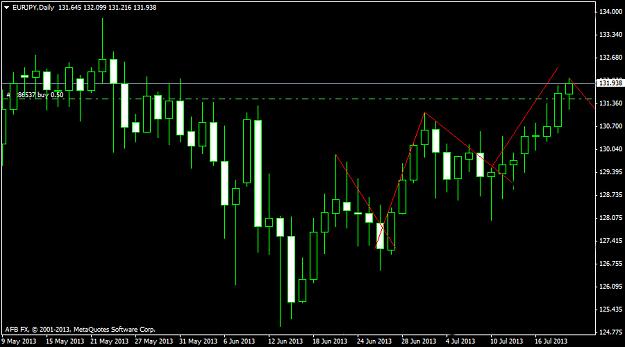
Hi Guys After the sell opportunity on around July 20 as I have posted before, the price consolidated and confirmed its bullish trend yesterday. I did not forget to enter at the right time. Here is my chart where I am in a very good position already: ...
Daily EUR/JPY analysis
- Red Herring replied Jul 27, 2013
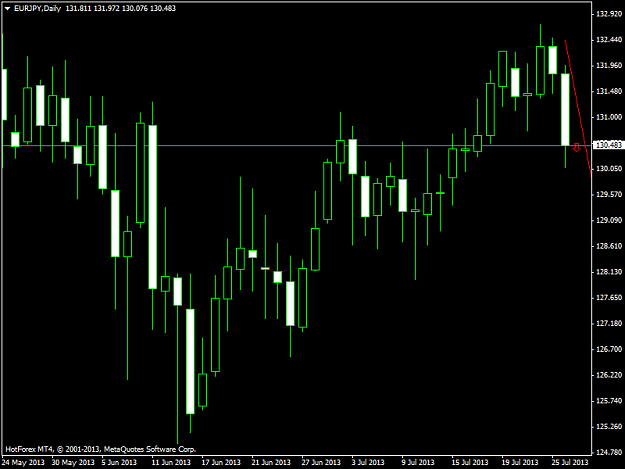
So here is comes...the expected sell set-up as I have mentioned earlier: image
Daily EUR/JPY analysis
- Red Herring replied Jul 24, 2013
Though there was a probability of bullish, surprisingly sell was on and I got some of it: Here is my trade taken yesterday: image
USD/CAD
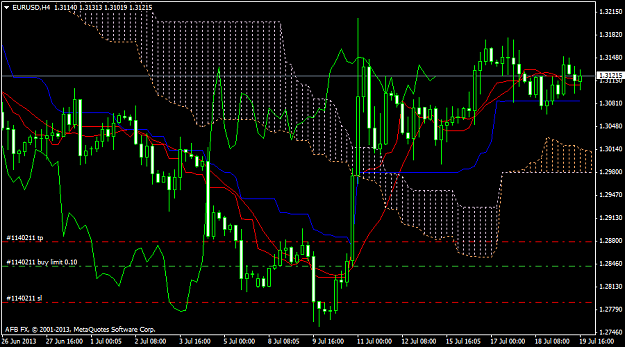
- Red Herring replied Jul 23, 2013
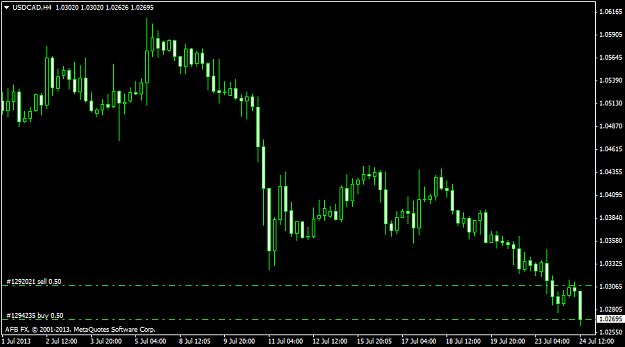
But according to Mr. ichimoku, Long is on: Hope the market will move soon... image
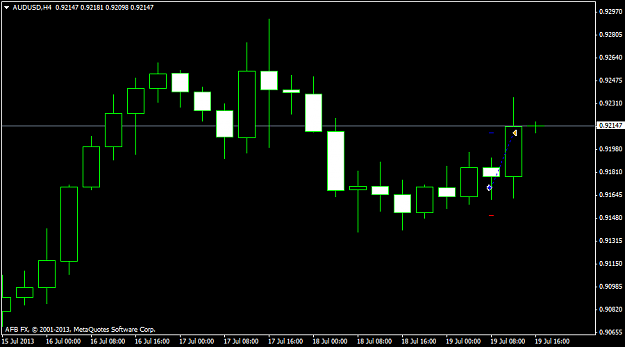
AUD/USD
- Red Herring replied Jul 23, 2013
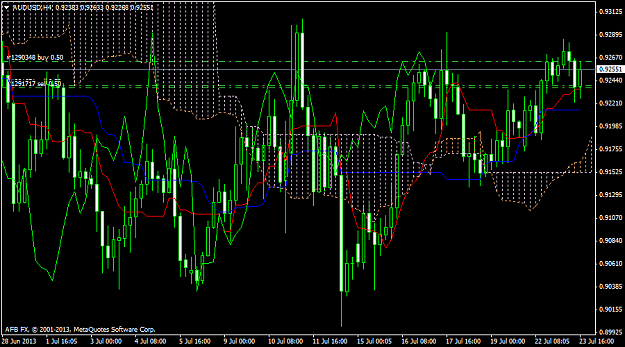
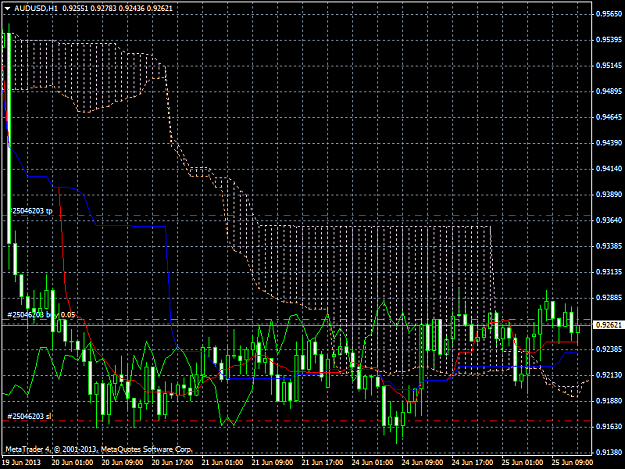
Lets post some ichimoku guys... Buy signal is no but my feeling is market will change soon... image
Ichimoku King System

- Red Herring replied Jul 19, 2013
Hey guys, though I am not an ichimoku expert but feel a long position is possible...what do you think? image
Ichimoku Technical Sessions 2013
- Red Herring replied Jul 19, 2013
Well said Venice! Indicators are waste of time. Here is my chart (and one of my successful trade based on naked price action and candle stick analysis): Buy: 0.91700 Close : 0.92100 image
Price is everything
- Red Herring replied Jul 12, 2013
The situation is reversed I see...even I also made some pips going long... image
USD/CHF
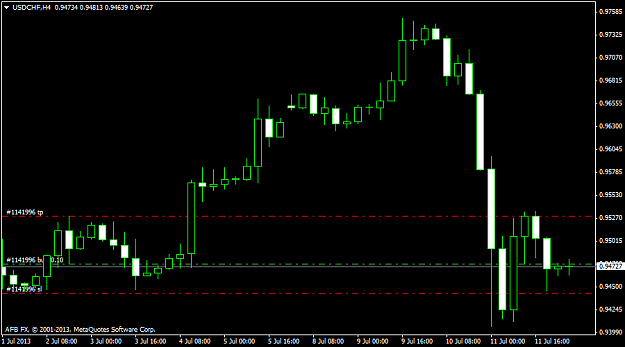
- Red Herring replied Jun 26, 2013
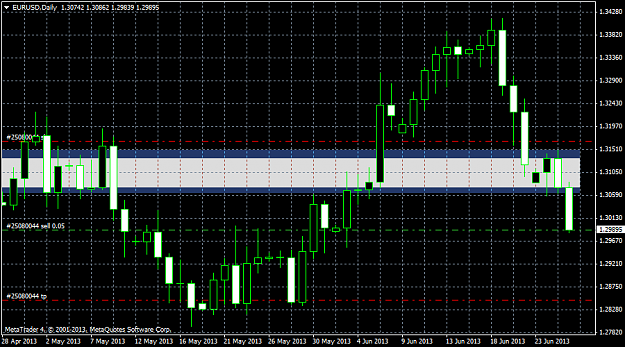
I have an idea guys: Why not we take this thread forward using what we have learned from Dadas? We can make posts and share, right? Here I go: A sell setup on EURUSD daily: image
Price Action in Day Trading by Dadas
- Red Herring replied Jun 25, 2013
Here is my setup....(I was also watching this pair too as silitmambu was doing) image
Ichimoku King System
- Red Herring replied Jun 25, 2013
Hi Guys and dear Ichimuku king Here I start with some clouds in this thread since I am also interested about Ichimoku because of its simplicity. Do you see ant trading opportunity here and if yes, than why! The green line is nor crossing the price ...
Ichimoku King System
- Red Herring replied Jun 21, 2013
Here is the update of the same pair that I posted yesterday and now it is more interesting (I have already entered ) but we should analyze what the zone candle was telling yesterday! Dadas can tell us sth I wish...
Price Action in Day Trading by Dadas
- Red Herring replied Jun 20, 2013
Here is a chart where I tried to find the zone candle on NZD/USD 4 hour! It would be clear for me if someone could tell me what the zone is representing! Is it the last closed H4 candle of yesterday?
Price Action in Day Trading by Dadas
- Red Herring replied Jun 18, 2013
After saving the zone candle here: C:/Program Files/MetaTrader 4/experts/indicators folder, I do not find any option to input these as indicated: 1 = M1 5 = M5 15 = M15 30 = M30 60 = H1 240 = H4 1440 = D1 10080 = W1 43200 = MN and my D1 chart looks ...
Price Action in Day Trading by Dadas
- Red Herring replied Jun 3, 2013
My today's message is this missed out opportunity:
Share your daily Message

- Red Herring replied Jun 3, 2013
I have entered although no price action :
Daily and H4 engulfing price action

- Red Herring replied Apr 13, 2013
Hi FerruFx Now 0 at the low point: image Please tell me what what is the exact price that I can pick from those range! I just want to clear my understanding regarding what fib indicates and how to understand what it indicates! For example at 61.8 ...
Why do people use Fibonacci in trading?
