- Search Forex Factory
- 20 Results
- Papion replied Oct 6, 2009
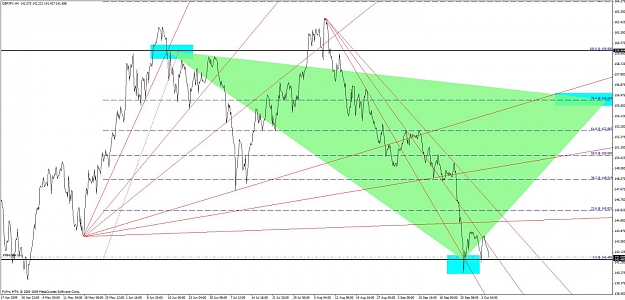
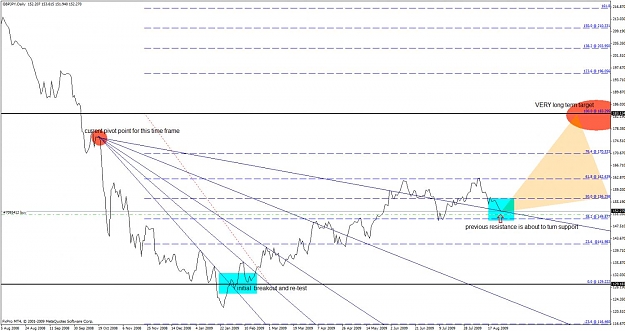
I am a long term position trader — Hello, I just wanted to share something here, which is the long term view of GBPJPY, IMHO.....in this case of the 4H chart......which you can confirm with the daily. The currency pair seems to have completed ...
Indian Guru Trading Majors
- Papion replied Oct 2, 2009
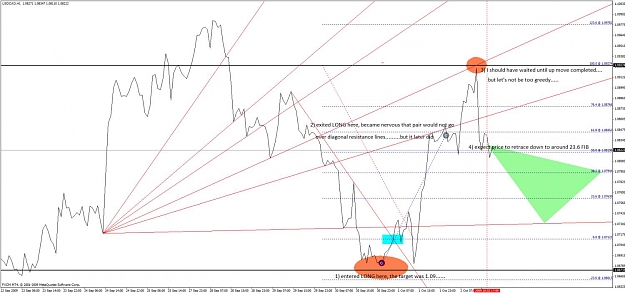
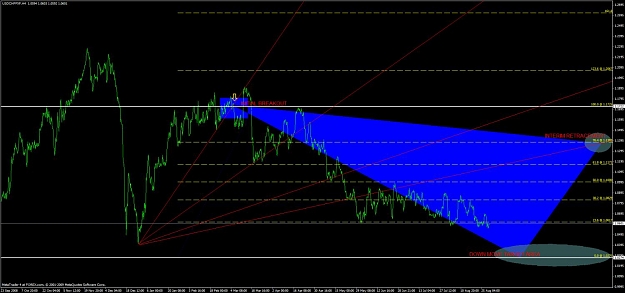
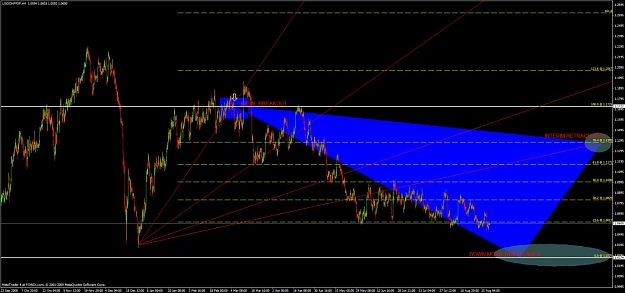
my view of the USD/CAD today — Please see annotated picture for info. PAPION
Canadian Update (USDCAD, EURCAD, GBPCAD)
- Papion replied Oct 2, 2009
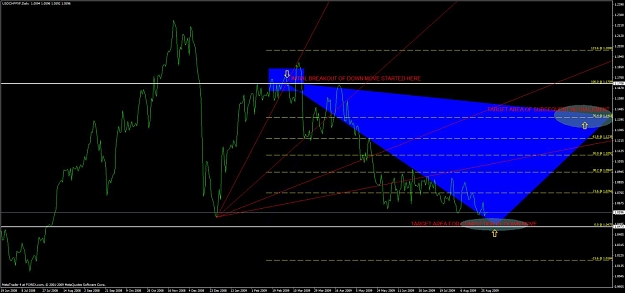
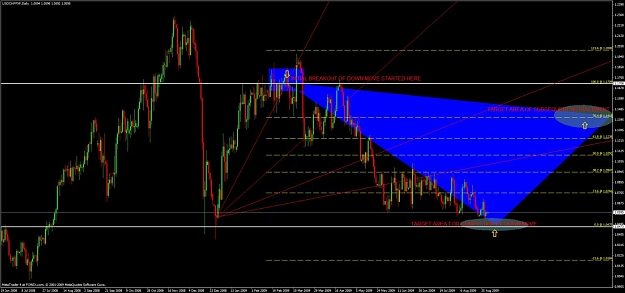
I am going short on EUR USD — The current pattern in the line charts for EUR/USD is a bearish formation. The price has already started to break thru the diagonal (S/R) trend lines.... If the down measured move develops well, I am short until ...
Drawing correct resistance and support-lines
- Papion replied Sep 28, 2009
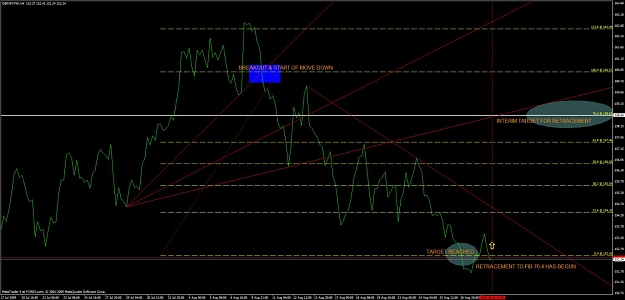
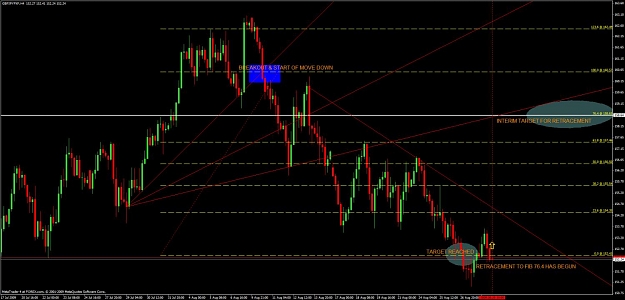
geppy completed the down move — I exited my 3 shorts in the past few hours, here is the result. Geppy finally commited to end the down move...IMHO I have entered 2 longs, looking for retracement up back to 76.4 FIB (back up to around ...
Daily GBP/JPY analysis
- Papion replied Aug 30, 2009
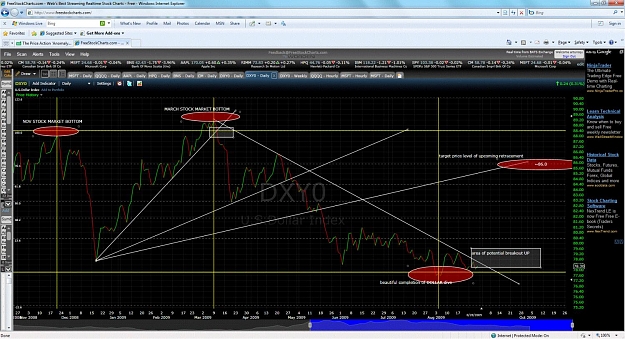
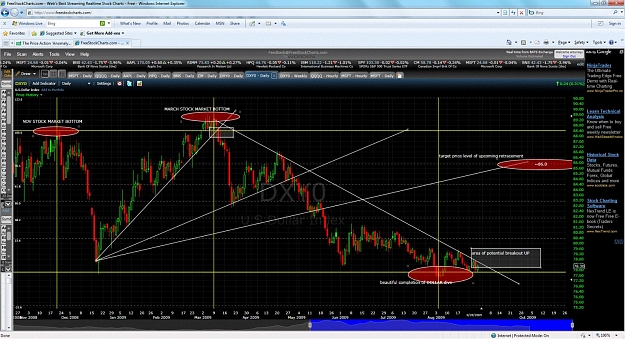
dollar index about to break up...... — Who knows, but the price action for the USD INDEX is clearly showing it is about to break up...... to where??, I do not know, but I can tell you that in similar circumstances, DXY0 tends to retrace up to ...
yen crosses vs. dow?

- Papion replied Aug 30, 2009
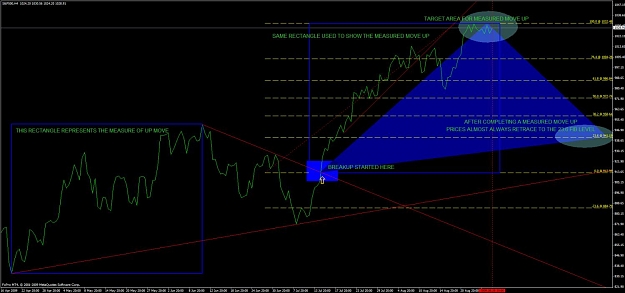
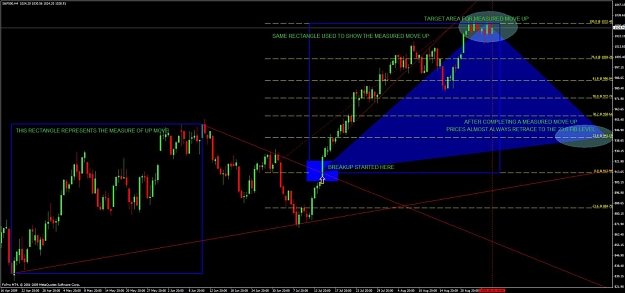
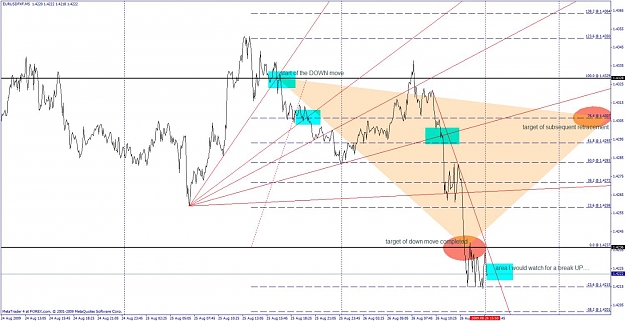
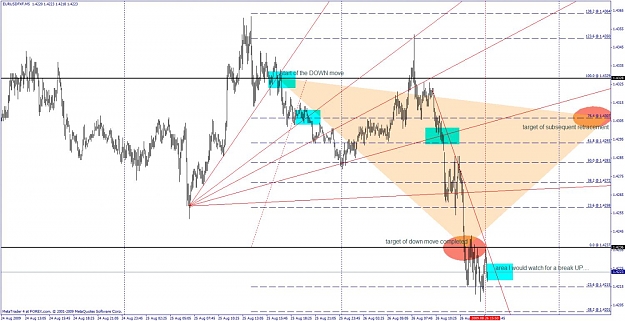
CHARTS FOR SP500 — Like you, I do believe that we are about to experience a retracement in the markets.... A clean measured move up just completed, and usually when thsi happens, a clean retracement to the 23.6 fib level follows. FWIW PAPION
yen crosses vs. dow?
- Papion replied Aug 30, 2009
this is my current take on GEPPY — I agree that financial markets are in for a retracement.... Now, this is my current take on geppy... I entered long last Thursday...waiting for it to get back to 158..... See annotated charts. Best regards, ...
yen crosses vs. dow?
- Papion replied Aug 30, 2009
this is what I mean about the dollar index — The dollar index, in my humble opinion, is about to break up.... That will help the dollar "crosses", and may force the stock markets to have a "little" retracement.... Notice how HIGH the dollar ...
The Price Action 'Anomaly'

- Papion replied Aug 30, 2009
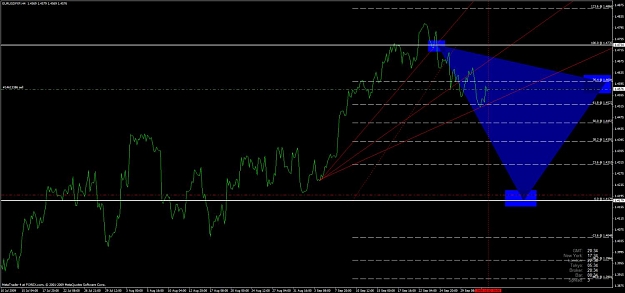
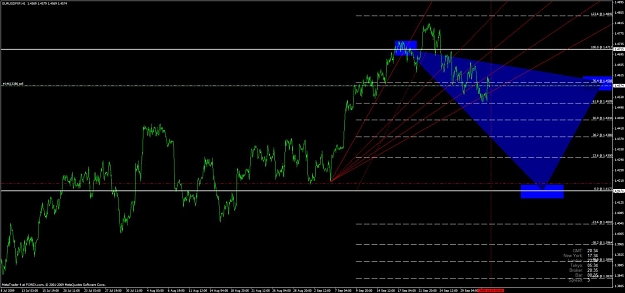
And here is my perspective on the 4 hour tf — Hello Again... A continuation on my previous post, which had the DAILY charts for SWISSY. Here are my 4 H charts. FWIW, PATION
The Price Action 'Anomaly'
- Papion replied Aug 30, 2009
Good to see your post Jacson101 — Hello Jacson101: Don't mean to intrude or anything, simply to provide a perspective (on DAILY charts) that perhaps you have already seen before. The persistent ranging price action around the 23.6 FIB level in ...
The Price Action 'Anomaly'
- Papion replied Aug 29, 2009
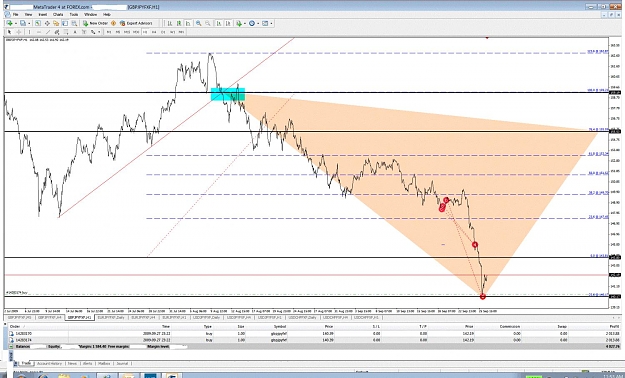
one of many ways to look at GEPPY — This is one of many ways to look at GEPPY, in the DAILY chart..... FWIW PAPION
Daily GBP/JPY analysis
- Papion replied Aug 29, 2009
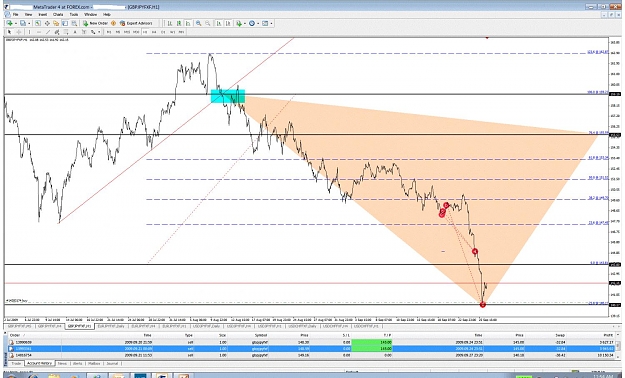
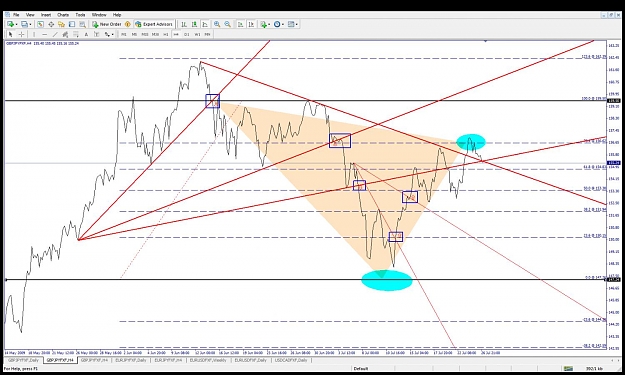
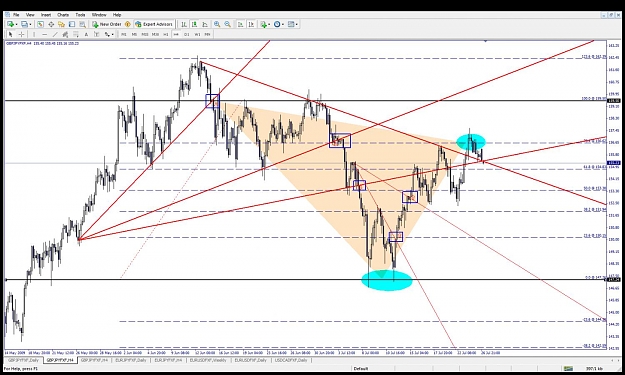
this is my current trade in GEPPY — Hello, this is my current trade in GEPPY (can't show the live account, here is my demo). Showing both 4H and 1 H charts. The down move just completed (bottom ellipse), and the retracement up will hit the ...
Daily GBP/JPY analysis
- Papion replied Aug 26, 2009
I use ONLY price acton too — Someone else mentioned the price action (current) in the EUR USD pair.... SO, here is my take of the current EUR USD 5 minute LINE chart... I am also attaching the candle chart, which is what most people (not me ) ...
Best Read Threads On FF
- Papion replied Aug 3, 2009
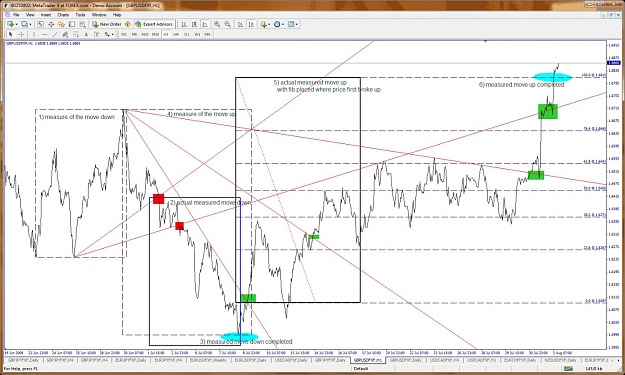
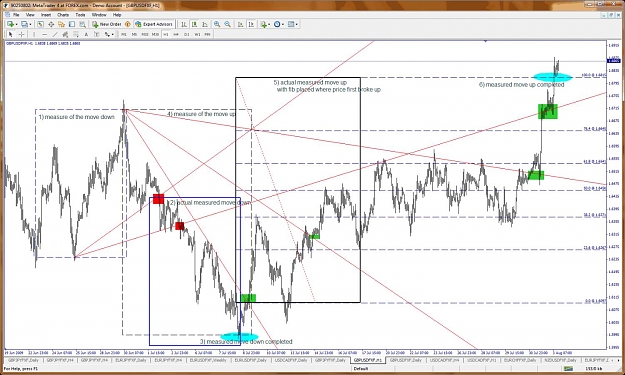
cable just completed two well measured moves — Cable just completed two well measured moves, one down and one up.... Text book measured moves, that I seldom see in this low time frame (1 hour) See my annotated pictures, one for LINE CHART (the ...
Cable Update (GBPUSD)
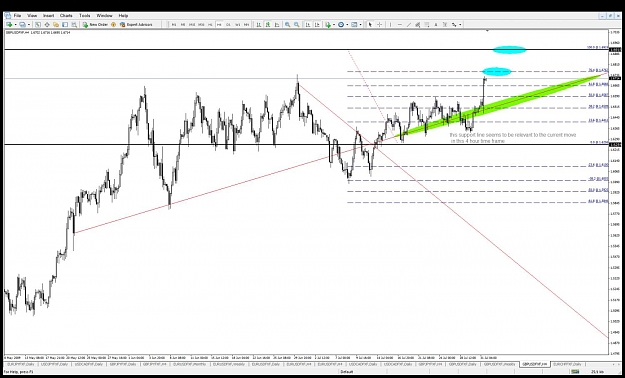
- Papion replied Aug 2, 2009
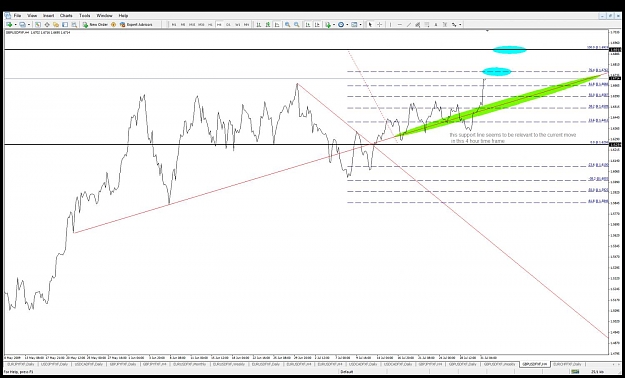
further info now in 4 hour time frame — This is usually as low as I go (as far as time frames are concerned). This is in additon to the weekly and daily charts I recently posted here. PAPION
Daily Cable Analysis
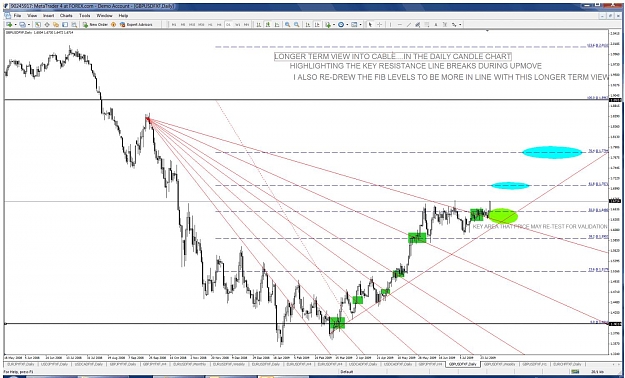
- Papion replied Aug 2, 2009
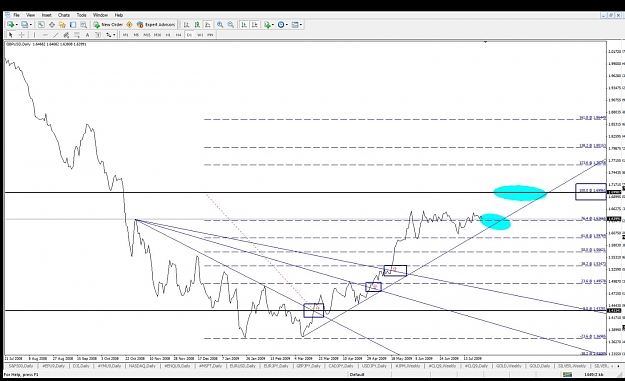
Here is my daily candle chart — I am attaching my daily candle chart, as I mentioned in my previous posting. I have also highlighted a potential re-test area. Even if price re-tests the area I have highlighted, the up trend would still be in ...
Daily Cable Analysis
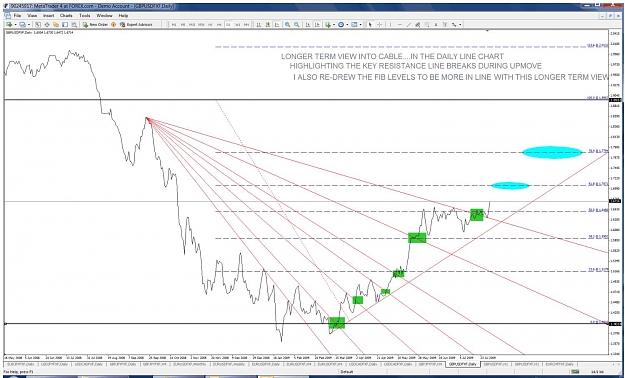
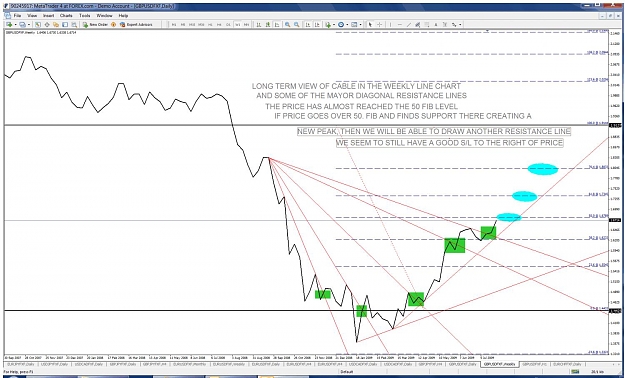
- Papion replied Aug 2, 2009
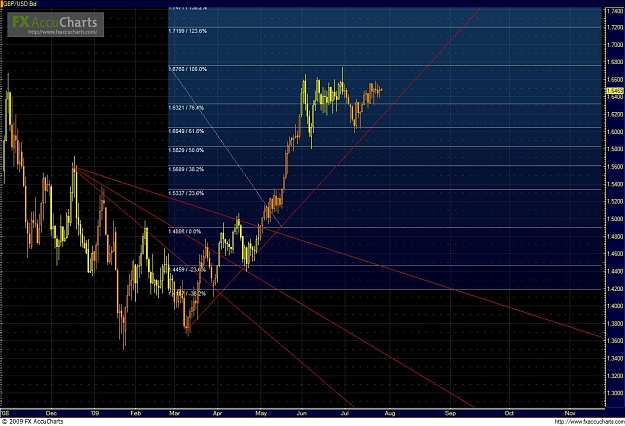
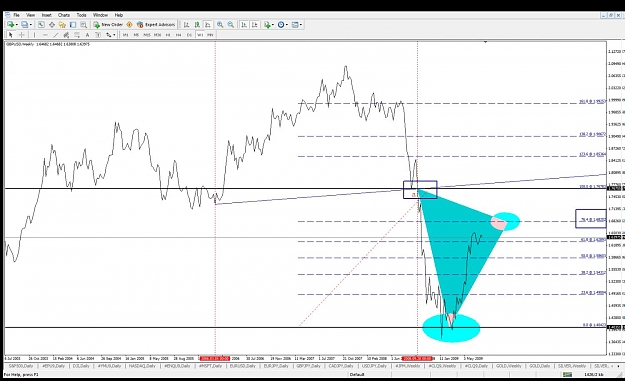
It looks like cable is still moving up — As a follow up of the posting I made back in July 26th. Here is now my updated analysis of cable, for both the daily chart and weekly chart. I am now going longer term. I use LINE Charts, but in the ...
Daily Cable Analysis
- Papion replied Jul 27, 2009
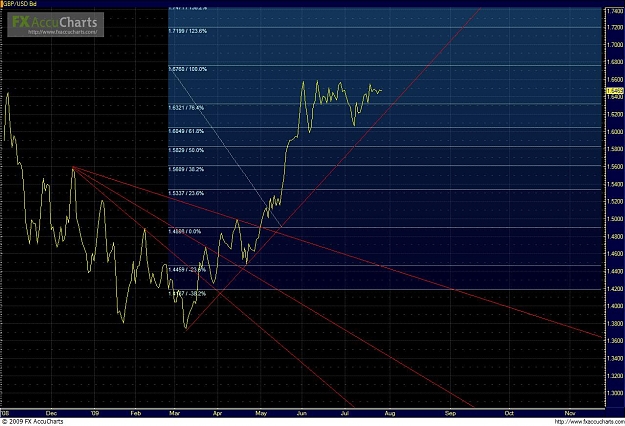
PA action for GBPUSD inthe DAILY CHART — This is what I see as far as PA on the GBPUSD daily line chart. The price has been consolidating around the 76.4 fib level for some time now. The key is the upcoming diagonal support line to the right. ...
Cable Update (GBPUSD)
- Papion replied Jul 26, 2009
GBP USD still to go up to about 1.6900 — Hello, I use LINE CHARTS to look at PRICE ACTION. I draw my trend lines based on LINE CHARTS only, and based on both the WEEKLY and DAILY charts, it seems to me that CABLE is to go up to 1.6900. This is ...
Daily Cable Analysis
- Papion replied Jul 26, 2009
GBPJPY completed down move and up move.... — Since the GBPJPY recently completed the measured move down and the measured move up....I am staying in the sidelines for now, waiting for it to break either an up trend line or a down trend line, to ...
Auslanco - GBP/JPY and GBP/USD (newstrade)
- Posts by Member Search: 'Papion'