- Search Forex Factory
- 40 Results
-
 One day! replied May 12, 2015
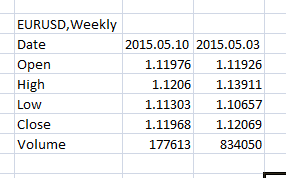
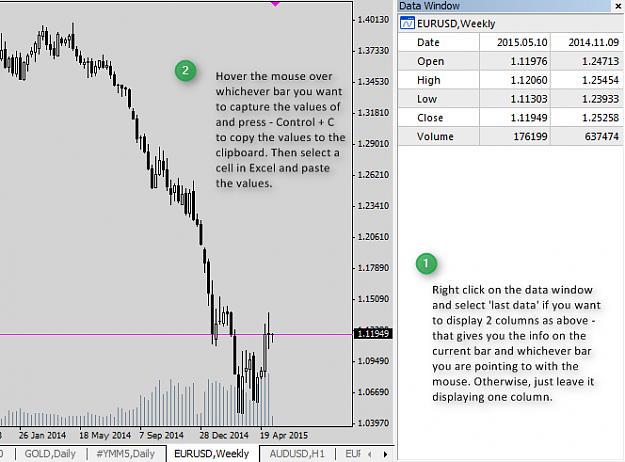
If you are only interested in a few pairs, you could just copy and past the data that you need from the data window in your MT4 terminal.... image Which when pasted into Excel, looks like this.... image No coding, but for a few pairs it might do ...
Excel and VBA analysis
- One day! replied Dec 30, 2014
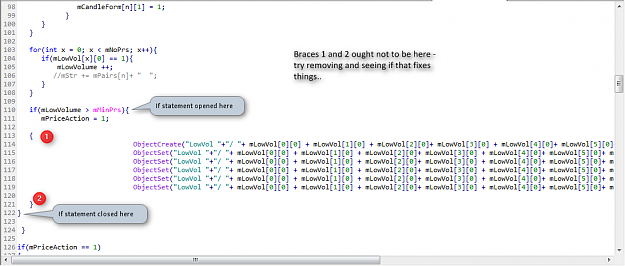
I think you need to check your use of braces... image
Please help find bug in my code!
- One day! replied Jun 2, 2014
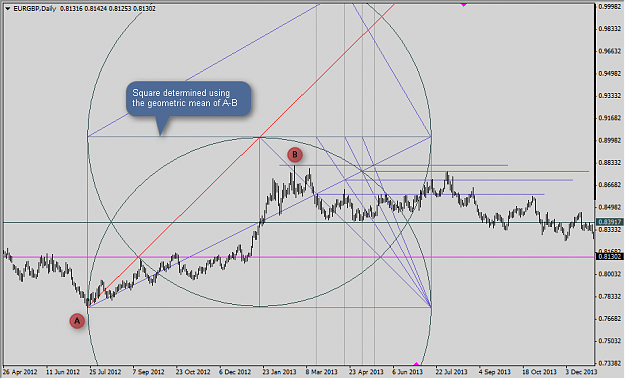
Your image reminded me of something that I played around with a while back. An article from the, Geometers Angle: url On page 5 of the PDF, you'll find the beginning of the article which discusses square root rectangles. I used the method to ...
Sine Wave and Channel Reflection, Action/Reaction putting it all together
- One day! replied Jun 1, 2013
Not sure if info from a demo account is of use in your project.... 11:18:36 TestTickVolume GBPUSD,H1: ====================================================== 11:18:36 TestTickVolume GBPUSD,H1: Date and time: 2013.04.29 00:00 Tick count: 1045 11:18:36 ...
Request for a little bit of help with some Broker info - MT4
- One day! replied May 19, 2013
Although I have put a lot of hours into coding various versions of ICCE, I haven't used it much in trading - I'm a slow learner and still demo trading
The Coffee House Trader With that said, I do find Bemac's indicator intriguing. So, I have placed the indicator on ...
- One day! replied May 9, 2013
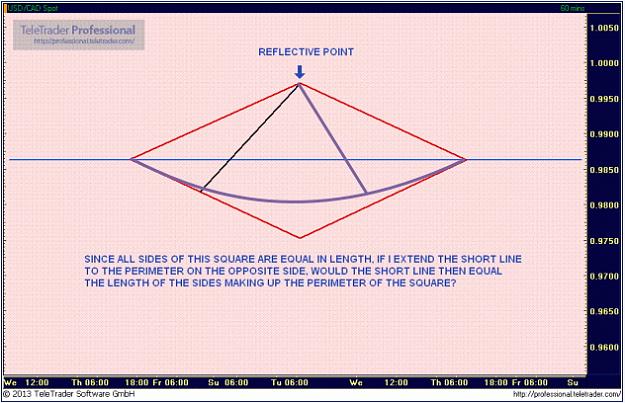
If you think of the lines as radii within a unit circle/ sphere, then they will have the same length.... image Line a and b are equal. They are still equal in the image below as they still emanate from the centre and project to the surface of the ...
Sine Wave and Channel Reflection, Action/Reaction putting it all together

- One day! replied May 8, 2013
Excuse me for butting in, but I don't follow your logic. Given that the side of a square is equal to a radius that connects adjacent corners of the square, how can any line originating from that point and projected to an opposing side, be of the ...
Sine Wave and Channel Reflection, Action/Reaction putting it all together
- One day! replied Apr 29, 2013
I don't know if you have noticed, but using the above formula you will always arrive at 20/7 = 2.857142, which is related to the cyclic number 142857. The following calculations relate to the chart below: image Calculations: image . image It ...
Numerical analysis


- One day! replied Mar 27, 2013
I have been lurking around on this thread for a few weeks now, trying to pick up on the nuances of the method. Yesterday I spotted what looked like a good opportunity on AUDJPY, so I set a pending order which got hit as price came into the zone that ...
B.S. Trading with Kenneth Lee
- One day! replied Dec 12, 2012
Hi Eric. I understand what you mean about switching off - there are a lot of lines to watch
The Coffee House Trader
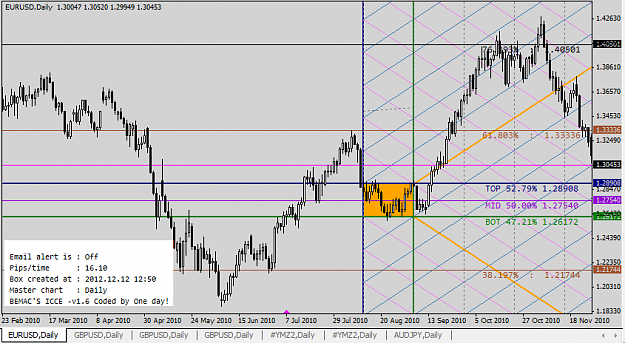
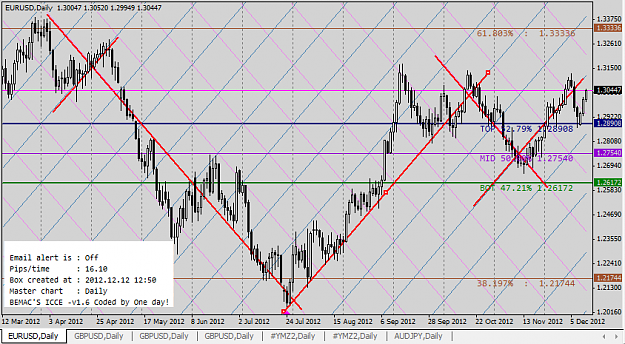
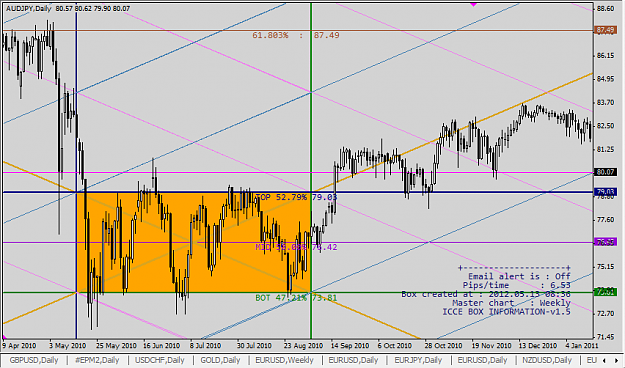
 But having said that, if you get a good fit, then it is surprising how price will wrap around them, as in the images below... Back in 2010... ...
- One day! replied Oct 13, 2012
How about D?..... — Hi PB, I think that it is fair to state that ICCE requires a certain amount of discretion when selecting locations for the box. Personally, I pick a few areas of interest and then review each against criteria such as: ...
ICCE. Bemac's Fib. Reverse Engineered
- One day! replied Jun 7, 2012
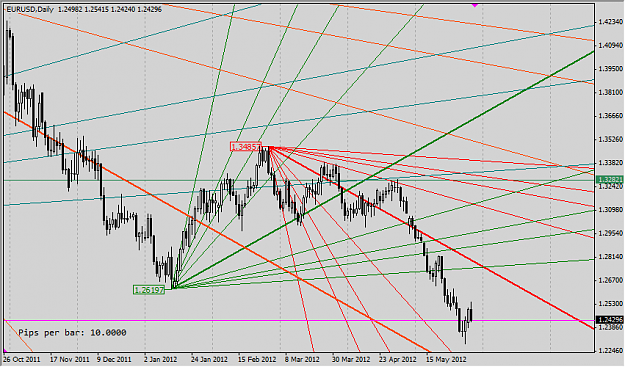
I quite like the look of 16.6667 = (24/1.44) on the daily EU.... image
Gann Analysis
- One day! replied Jun 5, 2012
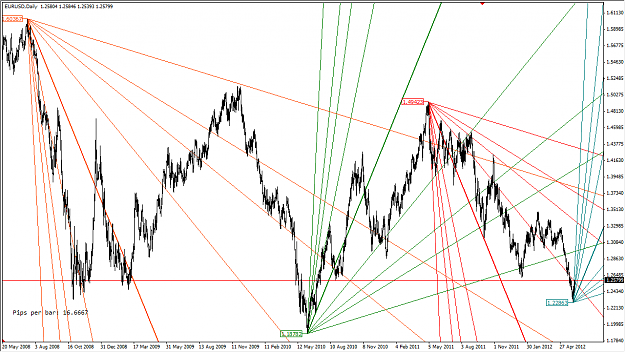
4X Gann fan indicator — Well I plumped for pips per bar in the end..... image I think that the use of the indicator is fairly straightforward, but I have put a short video together to demonstrate setting up etc,. The one grey area is ...
Gann PVS (Price vibration System) Trading
- One day! replied May 23, 2012
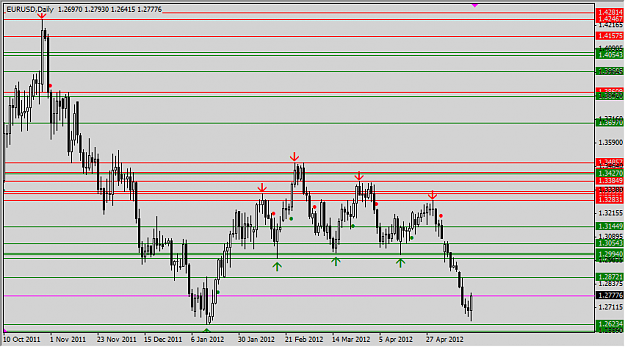
On closer inspection - the indicator is working correctly. I have marked where it has drawn the lines on your chart in the image below: image By coincidence, some of your order lines are in the same locations as the lines. By default, the ...
Coding request: close fractal swing indicator
- One day! replied May 21, 2012
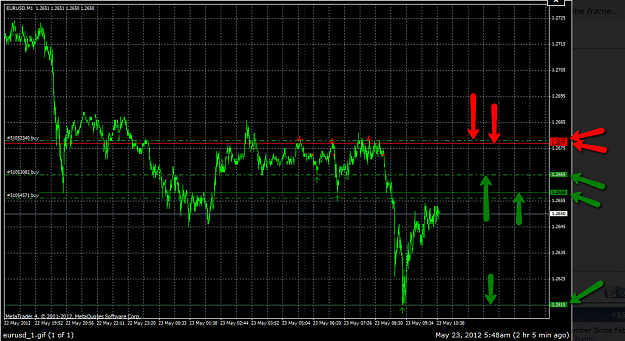
New version 1.2 — Here is the new version Kas: image Revisions: Changed the method of calculating arrow spacing; Added option to show S/R lines; Fixed the redrawing issue; Added option to hide the arrows, lines, etc,. That's me done on this ...
Coding request: close fractal swing indicator
- One day! replied May 19, 2012
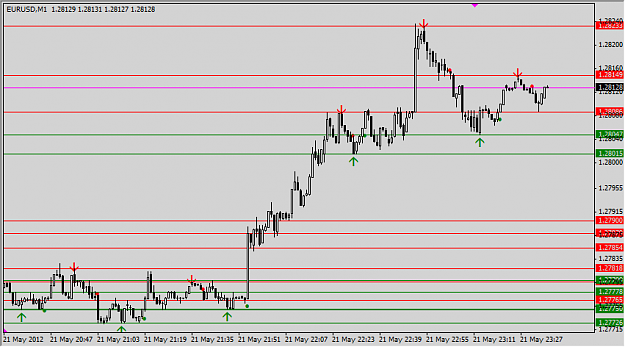
Nearly there.... — Hi Kas, Just about done I think. image I will check it when the markets re-open, before uploading the file.
Coding request: close fractal swing indicator
- One day! replied May 13, 2012
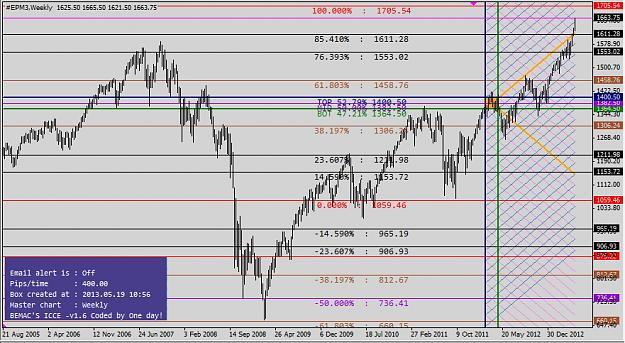
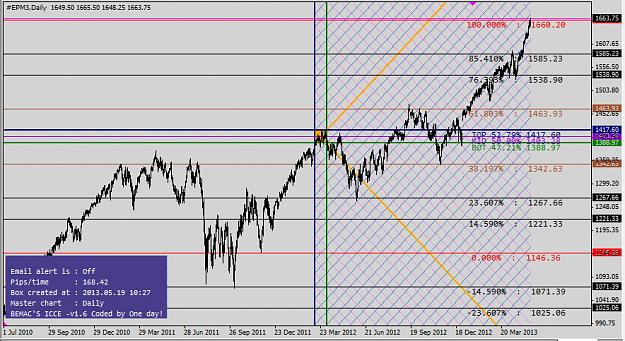
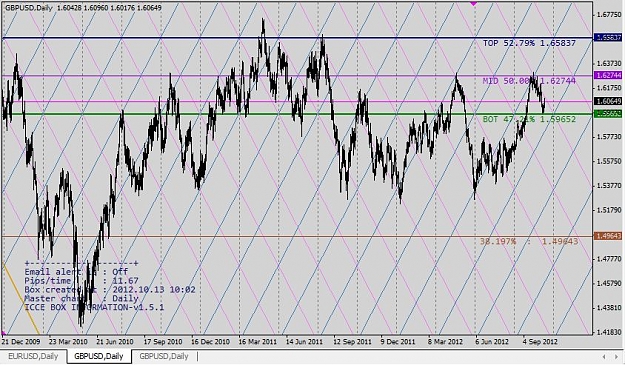
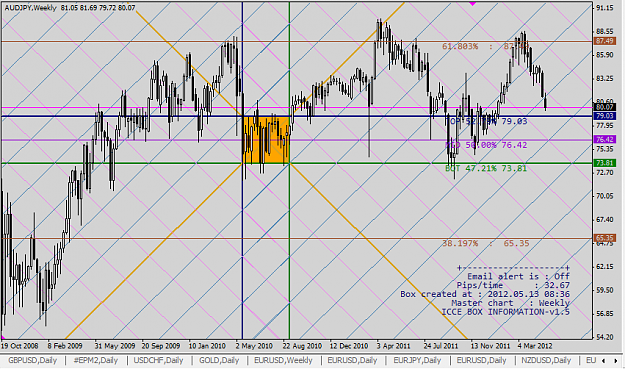
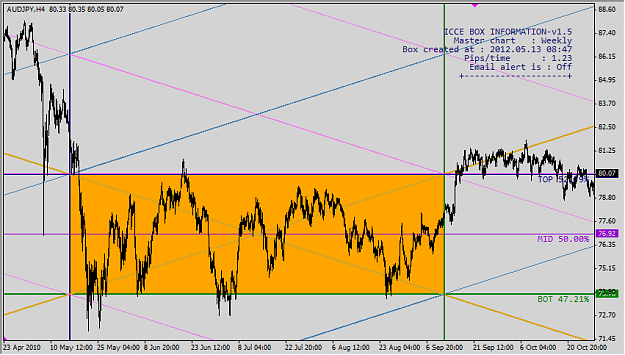
Hmmmm.... — I am not sure why this is happening, but I will keep digging and see if I can get to the bottom of the issue. I set up my chart with similar values on the weekly.... image ...then dropped down to the daily without a problem... ...
ICCE. Bemac's Fib. Reverse Engineered
- One day! replied May 12, 2012
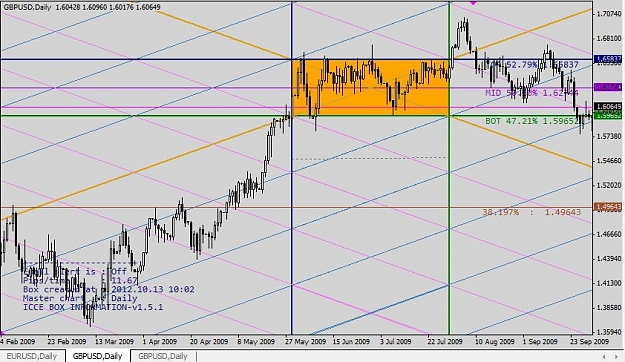
Thanks for the charts PB - Here is one for you.... image I have also attached an updated version of the indi' that allows you to switch off the info box. I think that Bemac wanted to have a timestamp on his charts and I added other info', such as ...
ICCE. Bemac's Fib. Reverse Engineered
- One day! replied Apr 29, 2012
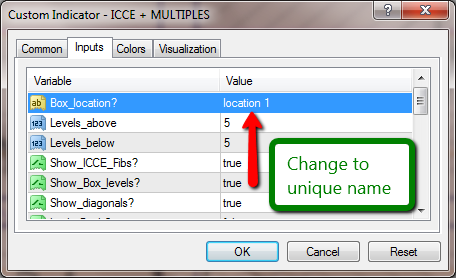
The file should be placed in experts/indicators. After doing that, I would suggest restarting your Metatrader terminal. You should now be able to see the indicator in your list of custom indicators. Assuming that you can, the first thing that you ...
ICCE. Bemac's Fib. Reverse Engineered
- One day! replied Apr 1, 2012
Clarification of requirements — Hi Kas, I have been looking at this and need some clarification from you so I have posted some charts. On the first chart I have set up a scenario using a 10 bar window: image In this second chart I have ...
Coding request: close fractal swing indicator