- Search Forex Factory
- 16 Results
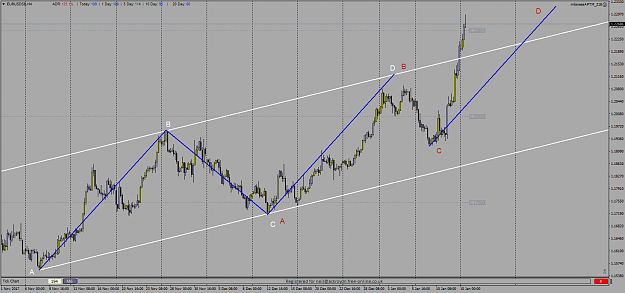
- Nelson35a replied Jan 15, 2018
Hi Parviz, I have a quick question regarding where you have drawn your EURUSD larger AB leg from/to on the H4 chart. On my attached chart I have marked with white letters an AB=CD pattern which seems to have already completed. The red letters are ...
Ratios & Harmonics: a Different Way to Trade
- Nelson35a replied Jan 30, 2017
Hi Wdays, Great thread you have here. I have been following with interest and read through the thread a couple of times over recent days. I like the way it provides you with definite targets. I need to work on my entries so as not to enter too soon. ...
Price action trading - Trade like the pros!
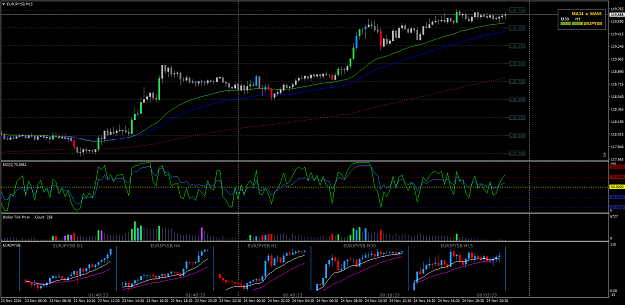
- Nelson35a replied Nov 24, 2016
Hi Wizlon, Don't know if you've seen these mini charts but I find them quite useful in terms of checking where price is in relation to MAs on higher time frames. I have just one of these windows open in my profile along with the other charts and ...
Start Winning - Trade the Current Trend
- Nelson35a replied Nov 23, 2016
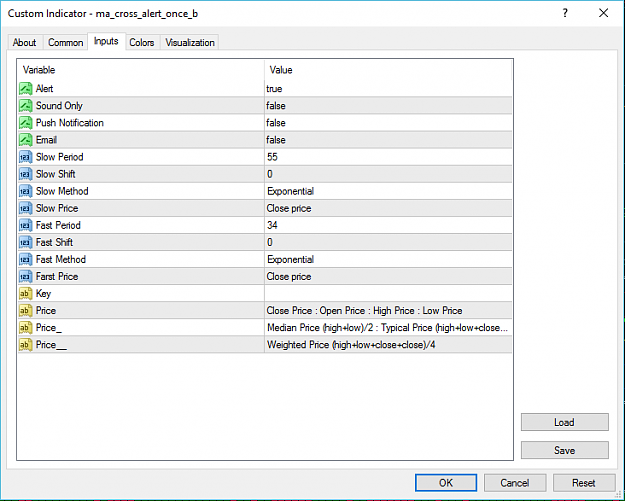
They seem to be OK but I'll try setting the MA cross alert with the settings below for the 34/55 EMAs. When I get a cross signal just need to check that the lights in the signal bar match, i.e they have changed colour. Anybody else spot any funny ...
Start Winning - Trade the Current Trend
- Nelson35a replied Nov 23, 2016
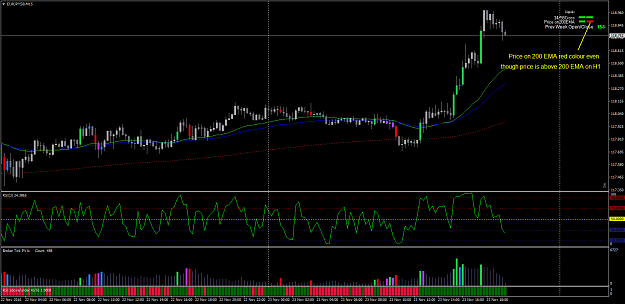
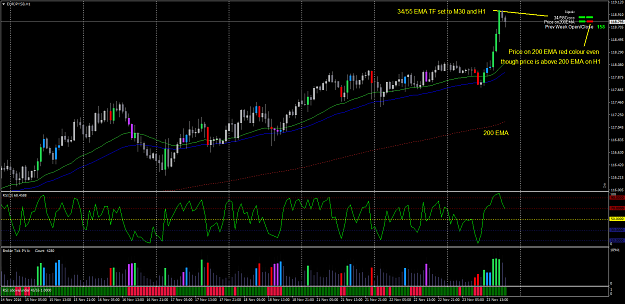
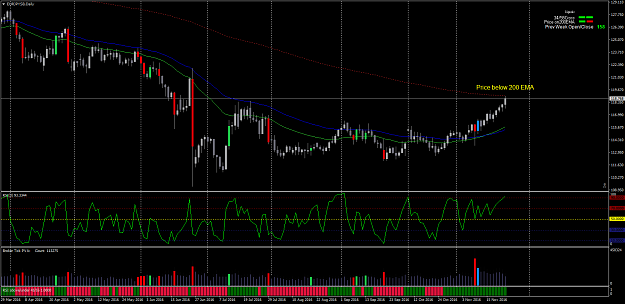
Hi Wizlon, I was checking out your revised strategy and have a question/observation. On the Signal Bar indicator it seems that the "price on 200 EMA" colours/TFs are hard coded H4/D1 and above. I have my M15 charts set so the 2 time frames on the ...
Start Winning - Trade the Current Trend
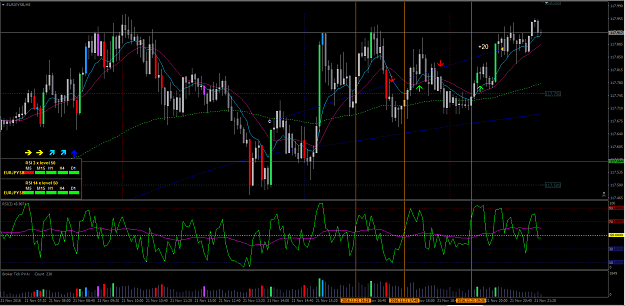
- Nelson35a replied Nov 21, 2016
Hi Wizlon, Took this EURJPY long trade today for +20. Pull back on the H1 looked valid with all the MAs in the right place and 3 RSI crossing 50 from below. Entry taken on M5 after high volume up candle just after a couple of high volume down ...
Start Winning - Trade the Current Trend
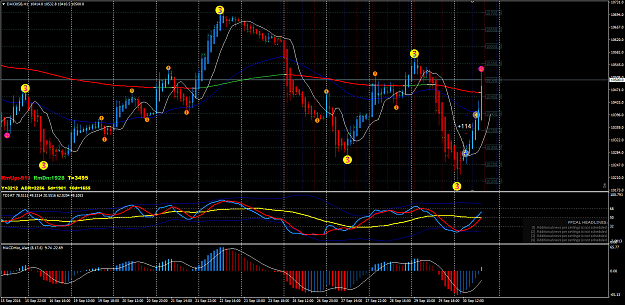
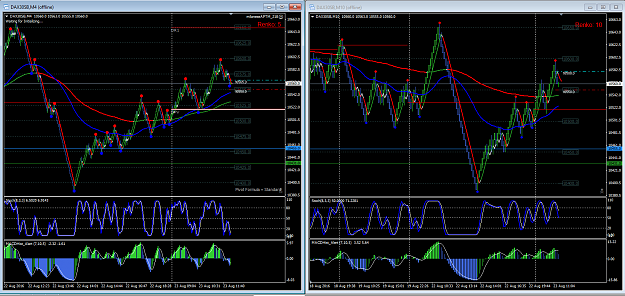
- Nelson35a replied Sep 30, 2016
DAX30: +114. Not sure if anyone has tried using this method to trade the Dax, but thought I'd give it a go with some success. Entered after yellow semaphore, candle colour change and TDI cross. Also TDI was oversold. After first blue candle price ...
RSS (Ridiculously Simple System)
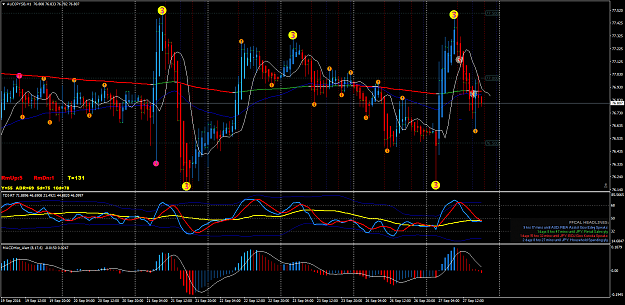
- Nelson35a replied Sep 27, 2016
AUDJPY +26. Was dubious about this trade as it had already exceeded the ADR for the day before London open, but TDI was overbought and had crossed on it's way back down so thought I'd give it a go. Trailing stop took me out but it didn't work out ...
RSS (Ridiculously Simple System)
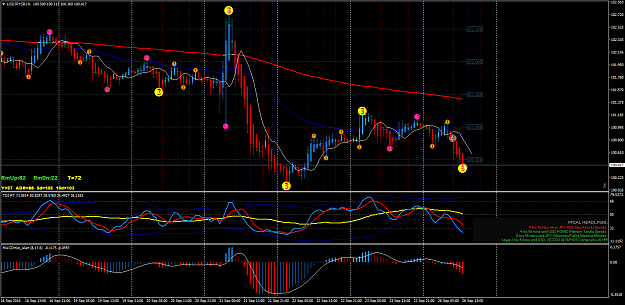
- Nelson35a replied Sep 26, 2016
Got to say thanks again Drewas for this thread and method. I've been trying it out on demo for the last few weeks and am getting the hang of it slowly. Thought I'd post a trade for today. USDJPY - +44. Traded short away from orange dot and last ...
RSS (Ridiculously Simple System)
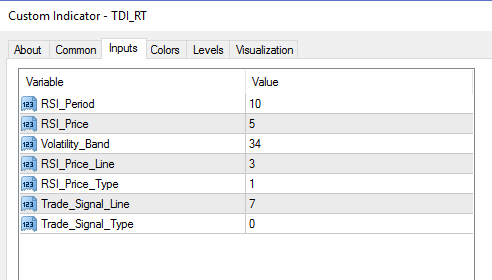
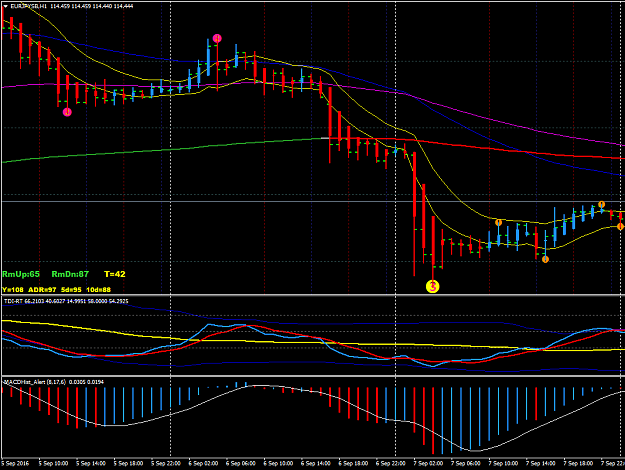
- Nelson35a replied Sep 8, 2016
Thanks Drewas. Here is an image from my MT4 showing the TDI Realtime indy for 6-7 Sept which pretty much matches accurately your Synergy Pro TDI for the same time period. image If anyone else wants to try the TDI Realtime (which doesn't repaint) ...
RSS (Ridiculously Simple System)
- Nelson35a replied Aug 23, 2016
Hi Intrepidpips, Just wanted to check a point on your maths and how you arrived at taking the HTF MA and multiply by 4 to get the replica in the LTF. If your HTF is 10 renko and the moving average you use is say 50 EMA and your LTF is 5 renko, ...
More simple is impossible
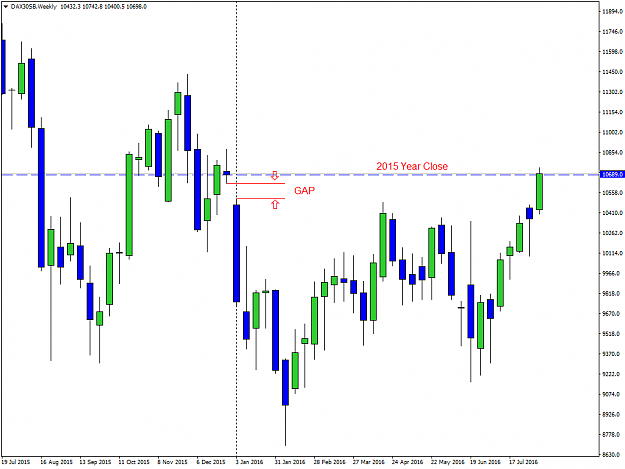
- Nelson35a replied Aug 12, 2016
Just thought I would post something I spotted on the weekly chart. The weekly gap down that happened 1st week of the year has just been filled this week. It's taken all year to get there but price is now just above the 2015 yearly close and it's ...
More simple is impossible
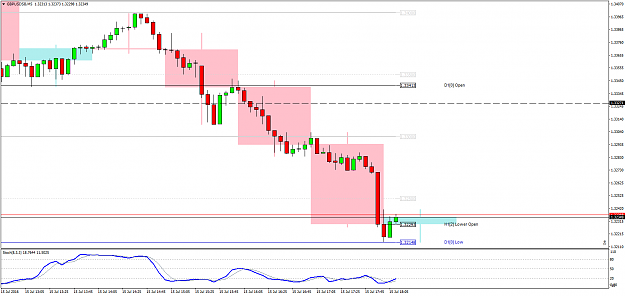
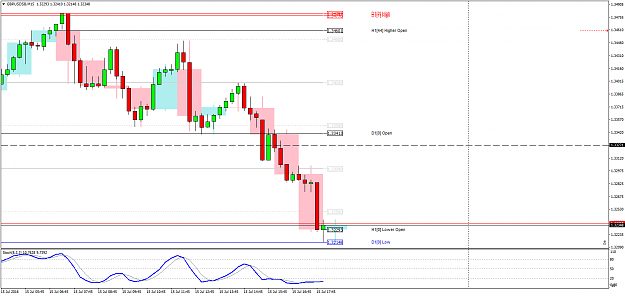
- Nelson35a replied Jul 15, 2016
Hi TooSlow, I am new to this thread. I have been reading the thread and trying out the method on demo. Quick question if I may. The first rule you have on your charts - "No entry on H1, M15 or M5 breakout bars", does this apply to prce making a new ...
Highest Open / Lowest Open Trade
- Nelson35a replied Apr 21, 2016
I like the squeeze pattern you referred to yesterday. Strangely enough the pattern you had on you chart from yesterday didn't show up on my charts, but today I had a couple which are not so obvious on your charts. I think it might be broker data ...
More simple is impossible
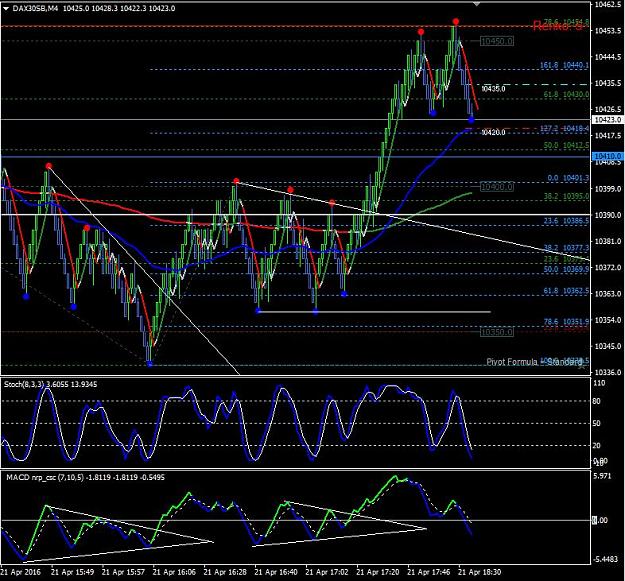
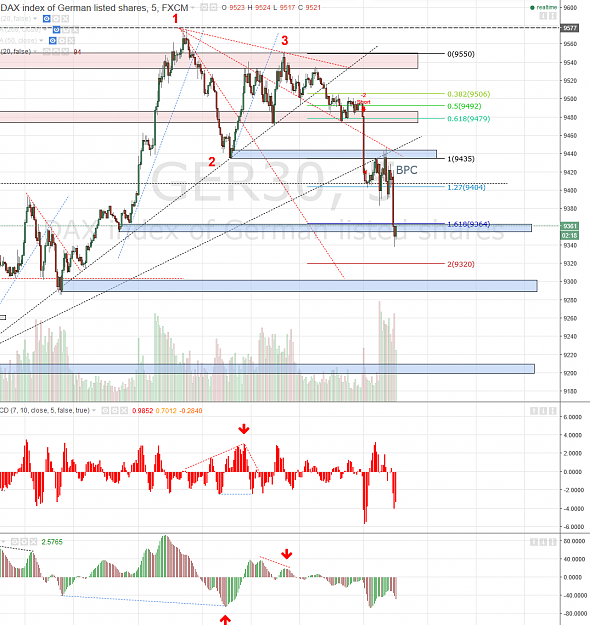
- Nelson35a replied Feb 29, 2016
Hi Friska, Quick question regarding how you have drawn your fibs on your DAX 5min chart? You have drawn your fib from point 2 to point 3 of a 123 ( I have marked what I think is the HTF 123 points on the chart below). Normally I thought fib ...
More simple is impossible
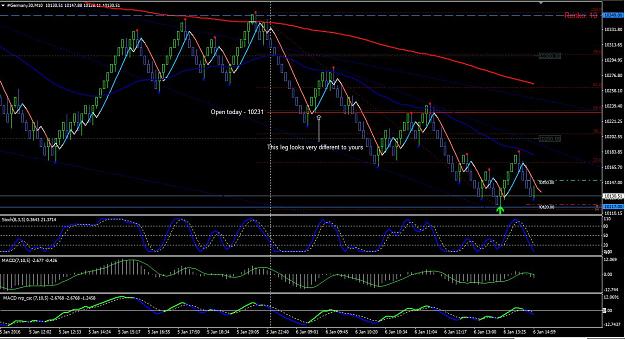
- Nelson35a replied Jan 6, 2016
Hi All, My first post here. I have been following this thread for a few weeks with interest, in the hope I can learn Dee's method and other methods mentioned here. Many thanks to Dee, Friska and all the others who contribute here, I have learned a ...
More simple is impossible
- Posts by Member Search: 'Nelson35a'