- Search Forex Factory
- 2,514 Results
-
 Nala66 replied 11 hr ago
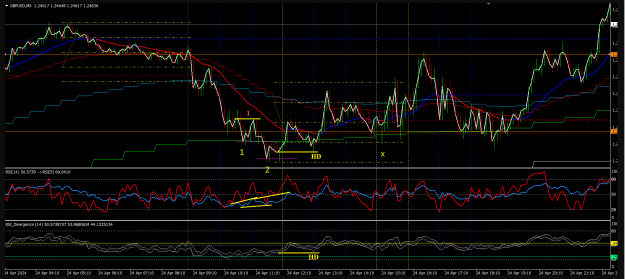
Couple of things to point out here for your edification (nice word). And yes, you are getting good at this. image
Trading the Cable swings via averages
- Nala66 replied 27 hr ago
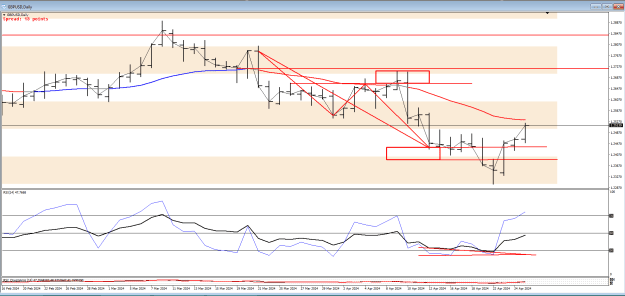
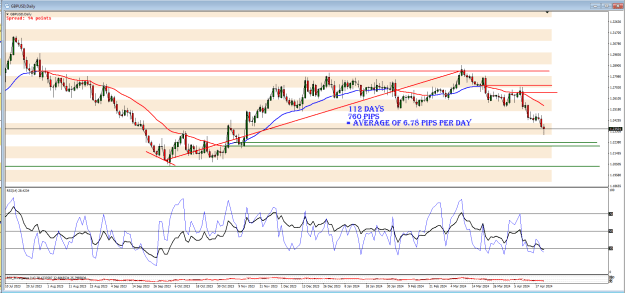
Not sure about the going back on the bounce. To me that is in the lap of the gods. Here is the daily AB=CD for those who don't understand... image Note the only div that counted was after the target was hit.
Trading the Cable swings via averages
- Nala66 replied 29 hr ago
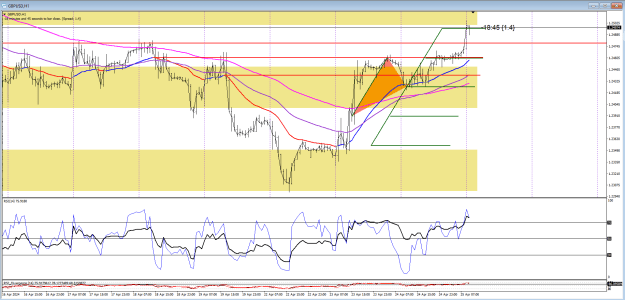
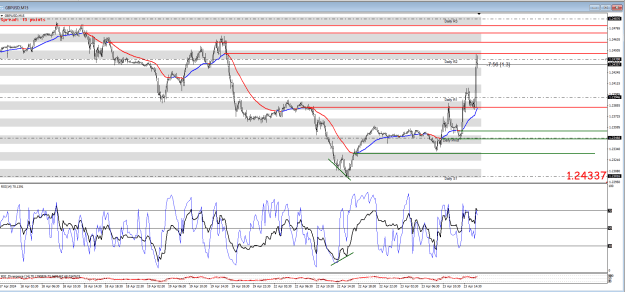
Made the 1-hour ABCD now what? image Have to wait a tad and see what sets up.
Trading the Cable swings via averages
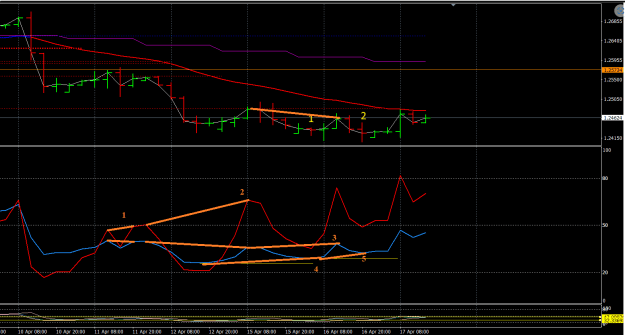
- Nala66 replied 32 hr ago
Another bad day, another loss. Here is how i trade yesteday image I'm busy yesterday so i miss our trade time, price is too near EMA H1 So my first order is at 1, i buy due to M5 DIV bull and got stoploss I re-entry at 2, my target is 2454, the ...
Trading the Cable swings via averages
- Nala66 replied 33 hr ago
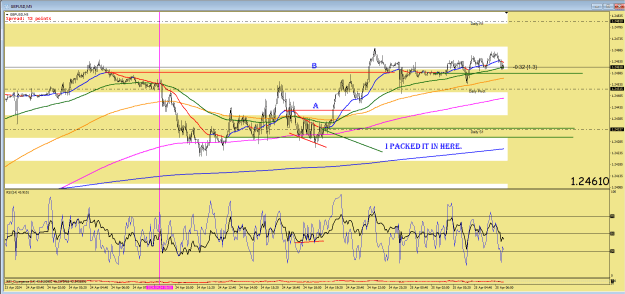
For those still trying to get a handle on this... For the average to pass A the price should reach B on this 5-min chart. image This is my main trading method. Hence trading the average swing levels.
Trading the Cable swings via averages
- Nala66 replied 33 hr ago
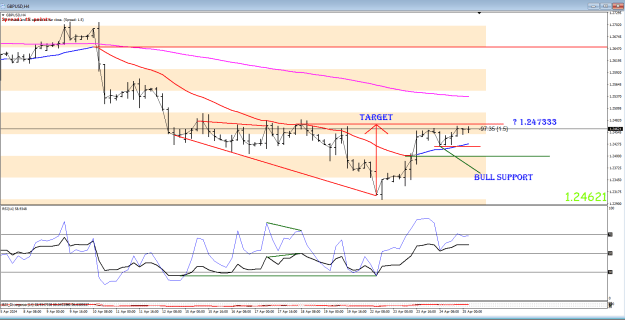
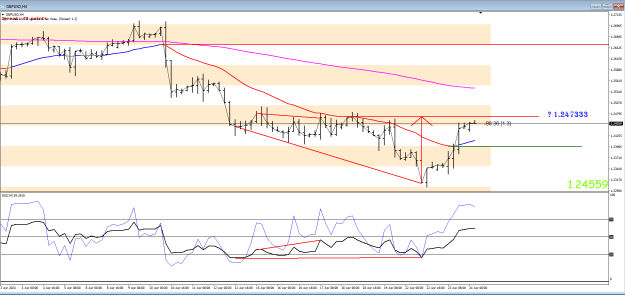
Well overnight I see the4-hour has found support and is still on track to the target level... image I only made a total of 23 pips yesterday. It was so slow. After a slow market day, I am always wary that a bigger move is in the making.
Trading the Cable swings via averages
- Nala66 replied Apr 24, 2024
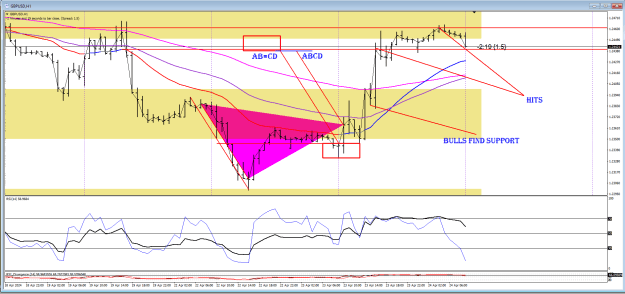
Yep, there was quite a bit going on with the 1-hourchart yesterday which I didn't pick up on... Both the ABCD and the AB=CD were the same target level image
Trading the Cable swings via averages
- Nala66 replied Apr 23, 2024
This is what I was looking at before going to sleep last night on the 4-hour chart. image I was expecting to see the target hit by now, however maybe it needs more time.
Trading the Cable swings via averages
- Nala66 replied Apr 23, 2024
Gee that push was 1 pip off my TP but I have closed now anyway. Whoops no it wasn't my red line was a tad too high. image Note how the EMA is trying to break the red line level that price reaches the next red line level.
Trading the Cable swings via averages
- Nala66 replied Apr 23, 2024
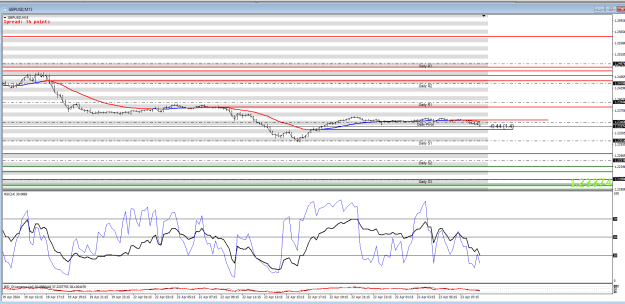
The daily pivots such as the S1 S2 etc are supplied by your broker in the tool list. Mine is called Auto Pivots. I then remove the ones I am not interested in. I am at a loss to understand why you cannot see targets for today. Look at the15-min ...
Trading the Cable swings via averages
- Nala66 replied Apr 22, 2024
Here is the workings of the 5-min chart today... image If you cannot get the required pips from this then you are doing something wrong.
Trading the Cable swings via averages

- Nala66 replied Apr 22, 2024
1) Yes, the 108 bar is about the London open and is the time I start to look for trades. I am in Australia, so it is about teatime for me round about 5pm depending on daylight saving. 2) Anything to do with long term trading is very inefficient as ...
Trading the Cable swings via averages
- Nala66 replied Apr 20, 2024
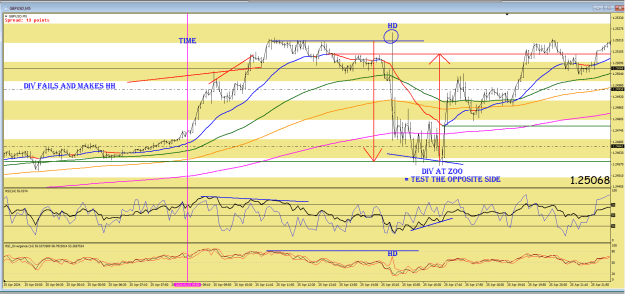
Yep, these are all good. Now because this is the 4-hour chart we treat these divs as ZOO points. Zones Of Opportunity and we drop to a lower time frame to trade them. Dropping to the 5 min chart we would identify an entry and would see a trend in ...
Trading the Cable swings via averages
- Nala66 replied Apr 18, 2024
Also, on the 4-hour chart you posted there were 5 different divs to take advantage of...
Trading the Cable swings via averages
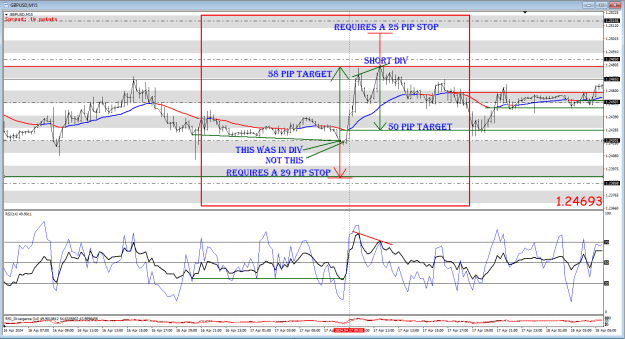
- Nala66 replied Apr 18, 2024
Sorry I did miss the question! Here is the 15-min chart. The part we are looking at is inside the red box. Also added is the risk reward ratio of 1:2. image As for the horizontal lines. I use a red one to mark the past swing high average and a ...
Trading the Cable swings via averages
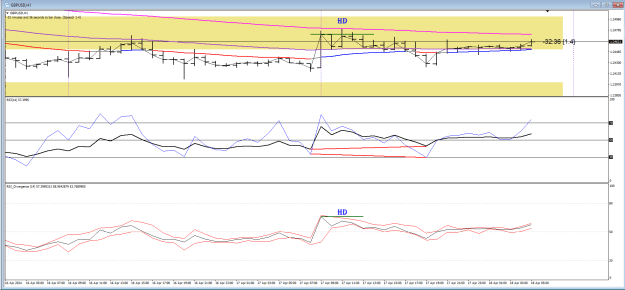
- Nala66 replied Apr 17, 2024
I see what is going on with your chart. You are using the two speed RSI to look for HD's. You should be using the historical RSI. It is because the divergence is hidden that we have to look at the total repainted moves of the RSI to see if it was ...
Trading the Cable swings via averages
- Nala66 replied Apr 17, 2024
There was a bull RSI div on the 1-hour but it was harder to spot....
Trading the Cable swings via averages
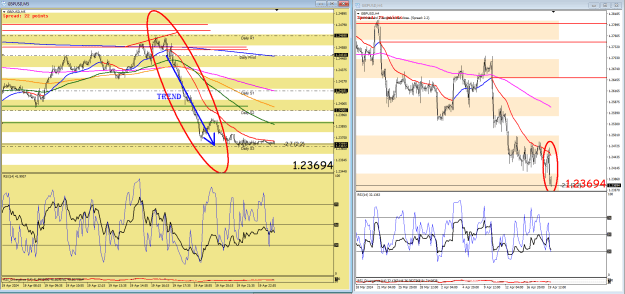
- Nala66 replied Apr 17, 2024
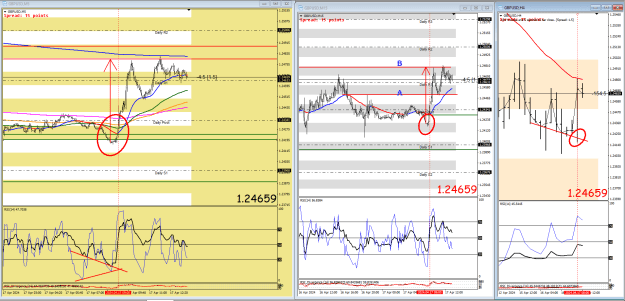
We see at the appropriate TIME. We have a bull div on the 4-hour chart. On the 5-min we see the SIGNAL to go long with about a 60 pip TARGET. On the middle chart (15-min) we see additional confirmation. If the average is to break A then price should ...
Trading the Cable swings via averages
- Nala66 replied Apr 15, 2024
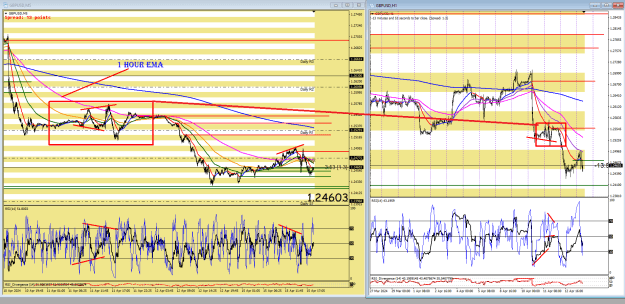
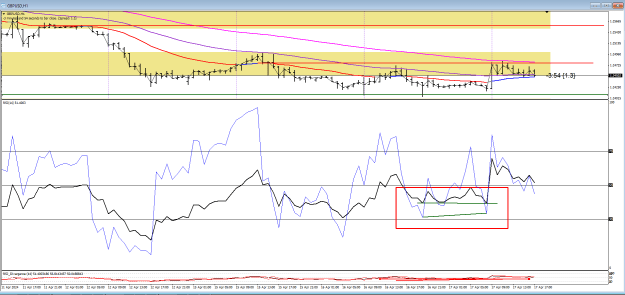
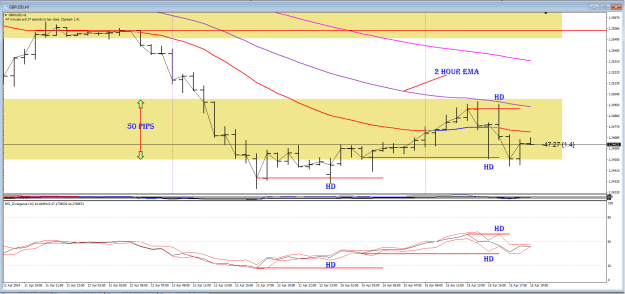
As I have said many times in the past hidden divergence is a great way to trade. Just look at the options here on the 1-hour chart... image We can also see that price is banging its head on the 2-hour EMA. Each HD has at least made it back to the ...
Trading the Cable swings via averages
- Nala66 replied Apr 15, 2024
OK we have a bull div in this case, it should at least return price to the EMA which is in itself quite a few pips for the taking, some 40 pips or so. This is best viewed at the 5 min level where we see a bull div take price back to the 1-hour EMA. ...
Trading the Cable swings via averages