- Search Forex Factory
- 18 Results (1 Thread , 17 Replies )
-
 MetaCoder replied Jun 23, 2023
Very high percentage of good signals for June 2023. image
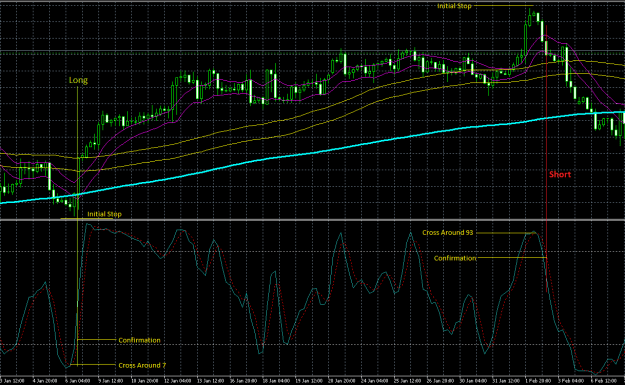
Straightforward Bands with Stochastic
- MetaCoder replied Jun 21, 2023
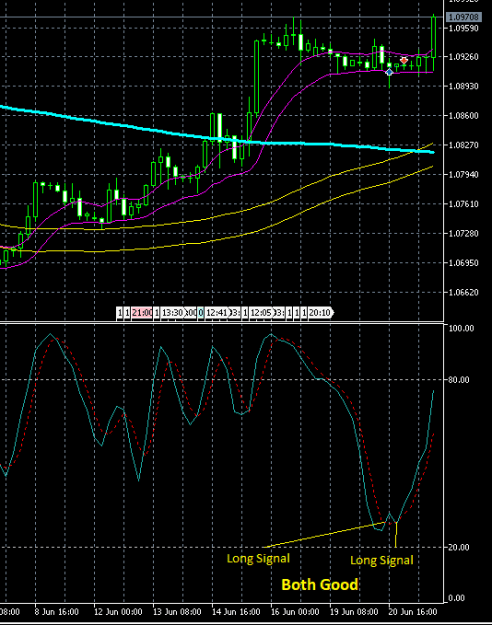
Looking at recent H4 EURUSD, the last two signals per the criteria described in the first post of the thread, are good. image
Straightforward Bands with Stochastic
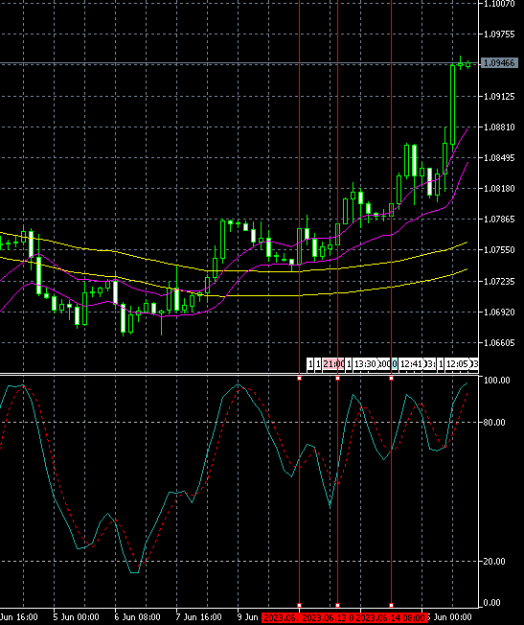
- MetaCoder replied Jun 21, 2023
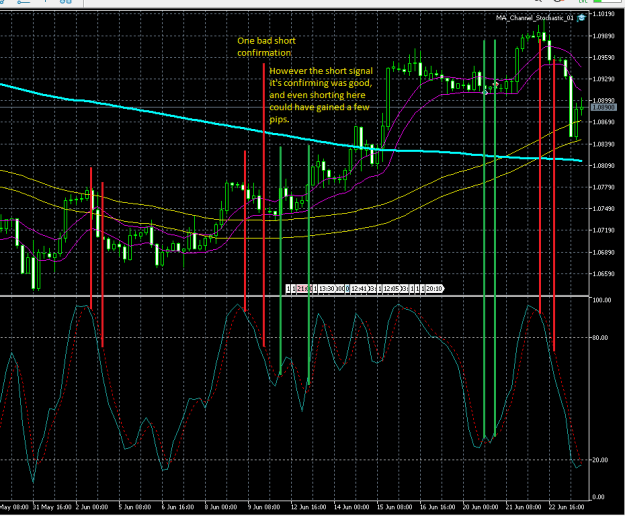
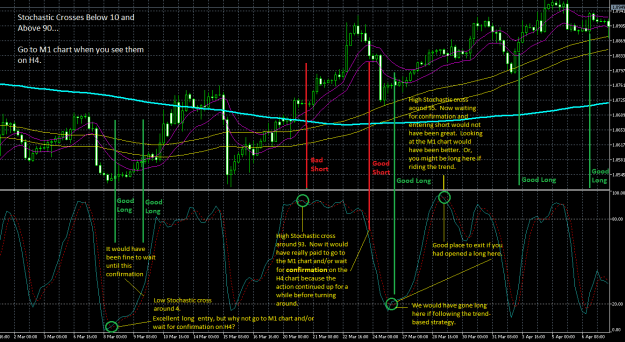
Suggestion: Go to the M1 chart when you see very high and very low Stochastic crosses on the H4 chart. image
Straightforward Bands with Stochastic
- MetaCoder replied Jun 20, 2023
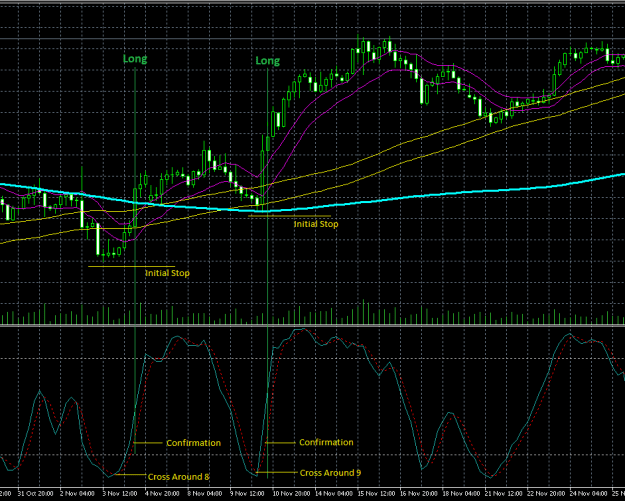
Examples of two good long entries on H4 AUDUSD. image
Straightforward Bands with Stochastic
- MetaCoder replied Jun 20, 2023
A third example showing a long entry and a short entry. During the uptrend shown, there are several good buy signals, based on the strategy described in the first post. The chart just shows one long and one short that are based on an extension of ...
Straightforward Bands with Stochastic
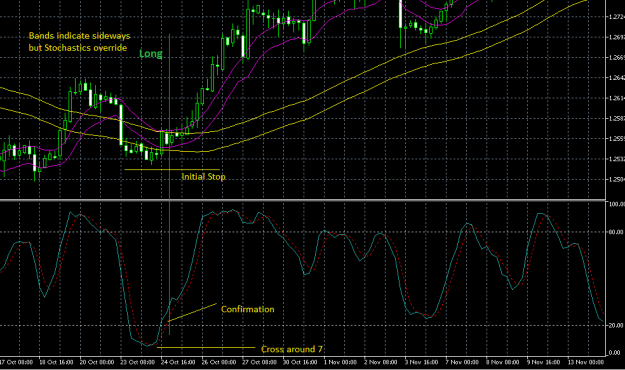
- MetaCoder replied Jun 20, 2023
Another example showing a very nice long entry. Notice that the two MA bands show no trend, but the Stochastic cross with confirmation is a signal to consider. image
Straightforward Bands with Stochastic
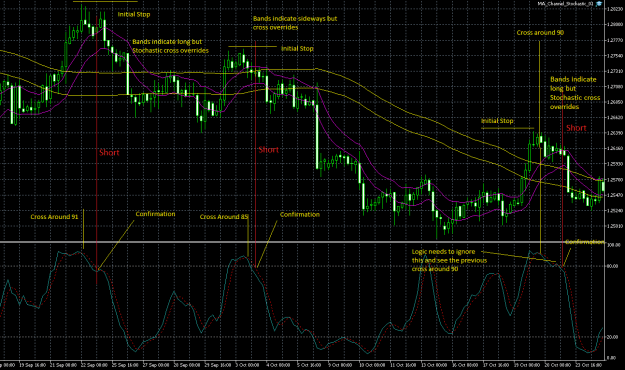
- MetaCoder replied Jun 20, 2023
Here is an illustration of how Stochastic signals can be use to get great entry points. The two moving average bands aren't necessarily indicative of the longer term trend. In this example I'd say the 200-period MA is probably down, even though the ...
Straightforward Bands with Stochastic
- MetaCoder replied Jun 15, 2023
You can see the good entry signals in the latest EURUSD uptrend. 15 Jun 2023. image
Straightforward Bands with Stochastic
- MetaCoder replied Jun 13, 2023
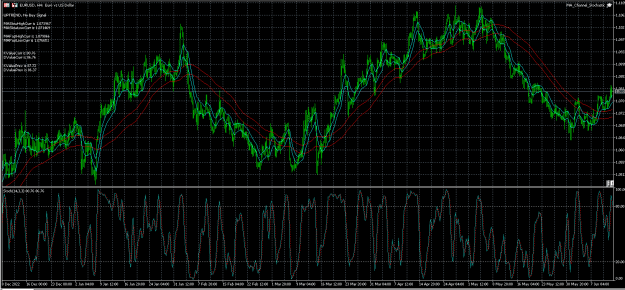
image I wrote my first MQ5 EA (in the past it was always MQ4) that shows the trend, whether a trade signal is seen or not, plus the moving average and stochastic values in the upper-left.
Straightforward Bands with Stochastic
- MetaCoder replied Jun 23, 2017
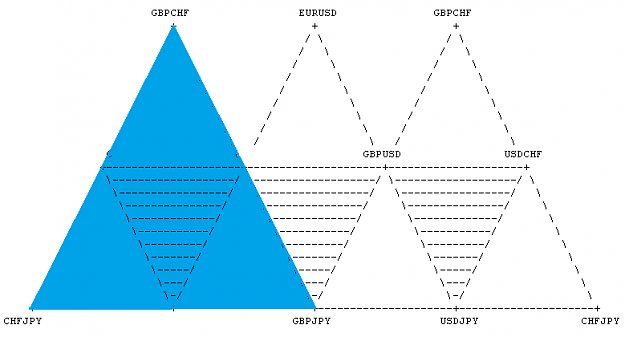
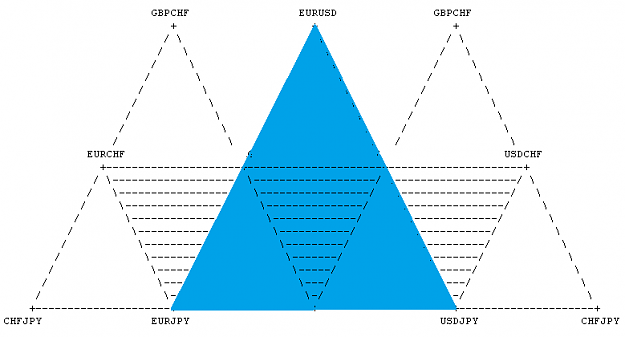
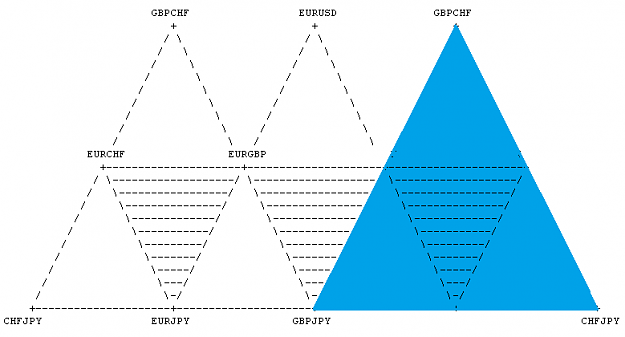
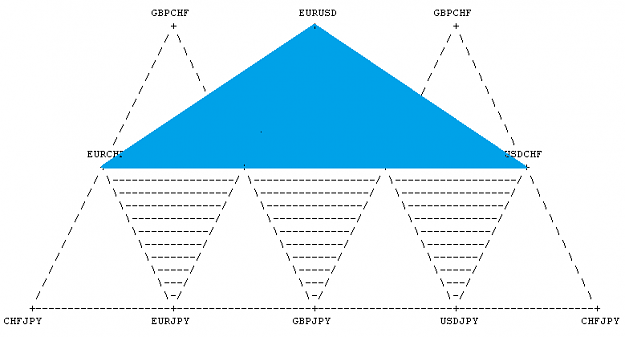
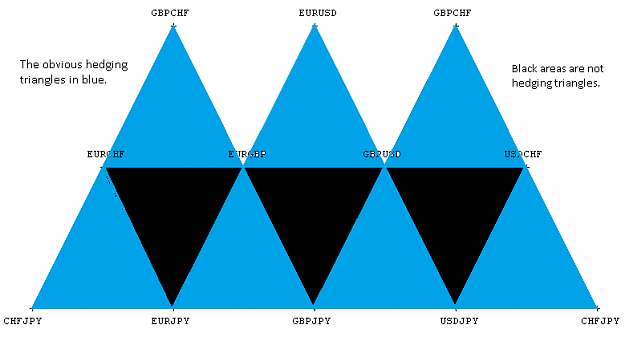
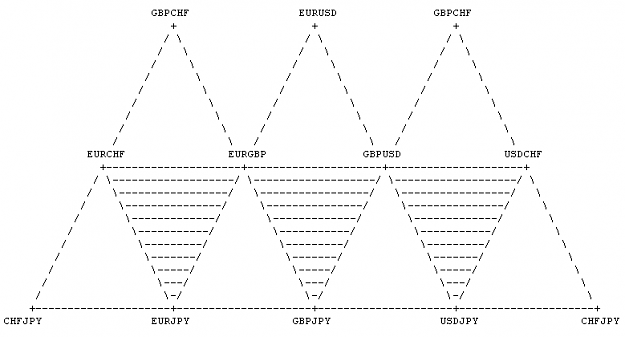
Here are the obvious bigger triangles. We shouldn't count CHFJPY|GBPCHF|GBPJPY twice. The illustration is only for helping us visualize the triangles. image image image
Three Pairs Hedging
- MetaCoder replied Jun 23, 2017
image Look at this. What do you see? Don't worry about the fact that CHFJPY and GBPCHF are shown twice. There are hidden things.
Three Pairs Hedging
- Wormholes - stochastic mismatch systemStarted Nov 3, 2014|Trading Systems|305 replies

Read the first 2 pages of the thread, run the EA for at least an hour, read the first 2 pages ...
- MetaCoder replied Oct 29, 2014
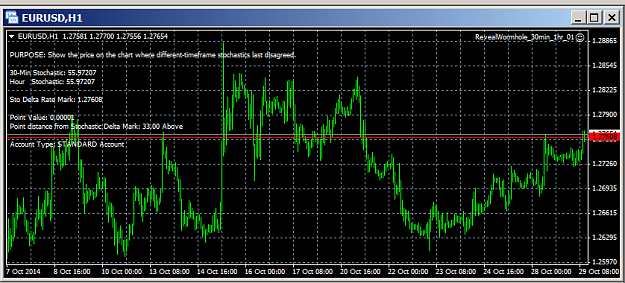
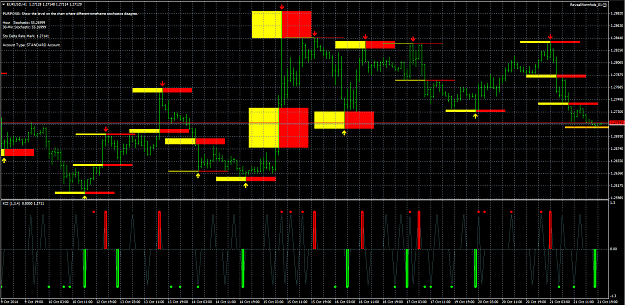
RevealWormhole recently gave a buy signal that one could have taken to grab a few pips in a small amount of time. The chart shows the state of the market after the price rose from below the price mark (red line). The distortion level remains in ...
The similarity system
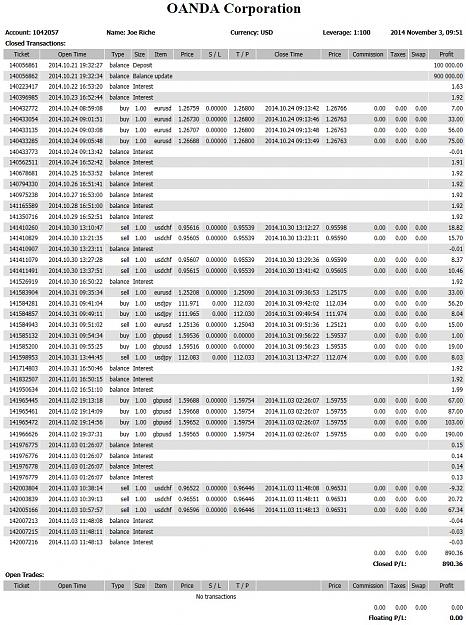
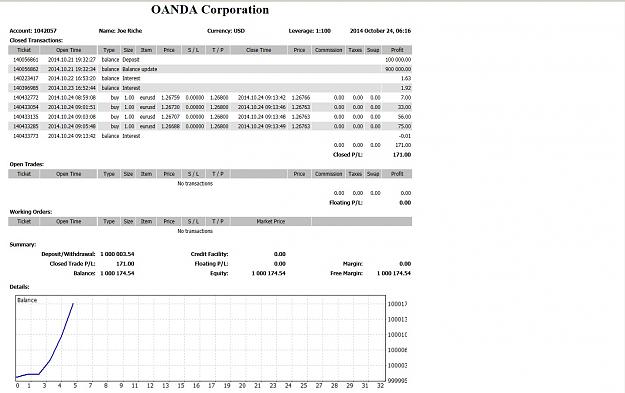
- MetaCoder replied Oct 24, 2014
Did some quick demo trading this morning, my first in a long time. I started up MT4 with the RevealWormhole EA running on EURUSD. I knew I probably wouldn't have to wait very long to see a price mark drawn on the screen. Sure enough, it took about 5 ...
The similarity system
- MetaCoder replied Oct 21, 2014
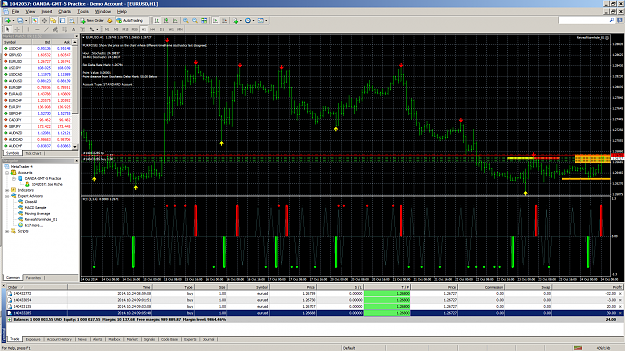
On my chart at the moment, the current price is close to the price where the stochastic mismatch was detected. The reason nothing shows for you yet is probably that only equal stochastic values across the timeframes have been detected so far. As you ...
The similarity system
- MetaCoder replied Sep 7, 2013
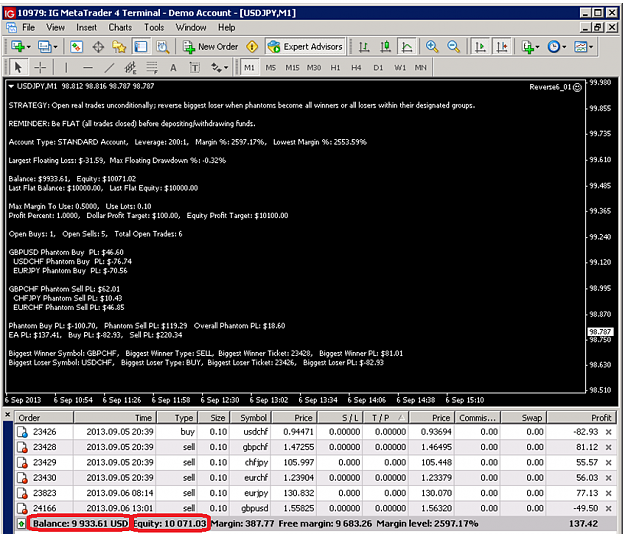
It's a matter of understanding the difference between balance and equity, not the settings. image I circled balance and equity in red. The balance was below $10,000 because one or more losing trades had been trimmed. The equity number shows what ...
Reverse6
- Posts by Member Search: 'MetaCoder'