- Search Forex Factory
- 6 Results
-
 Laditori replied Oct 6, 2018
A nice hammer candle on the USD/CAD weekly chart I would expect to see higher prices next week...just as they did in Sept.. image
USD/CAD
- Laditori replied May 8, 2018
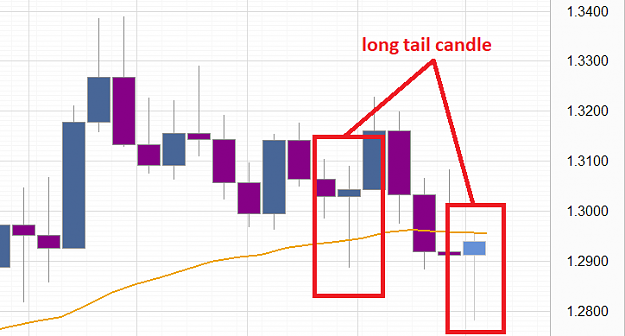
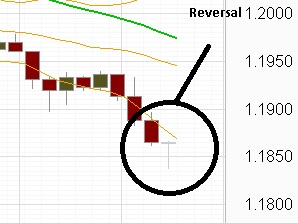
nice reversal candle setting up on the 4hr chart image The candle appears entirely outside the lower (20,2 Boliinger Band) and has a long wick similar to a hammer A Nice combination imho..which should be a reliable short term reversal... ...
EURUSD only
- Laditori replied May 4, 2018
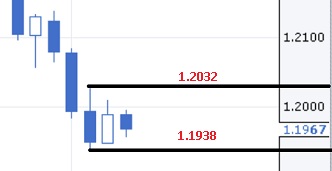
quick Tech reminder - Thursday was an Inside day on the daily chart. A break of Wednesday's hi or low could be a trade trigger Hi - 1.2032 Lo - 1.1938 image
EURUSD only
- Laditori replied Apr 30, 2018
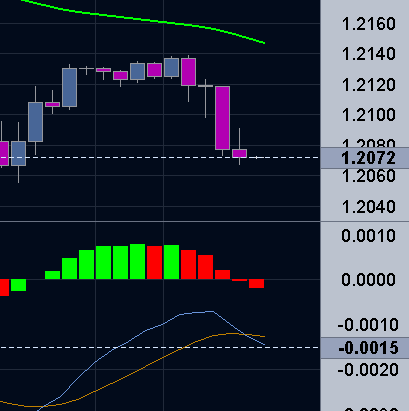
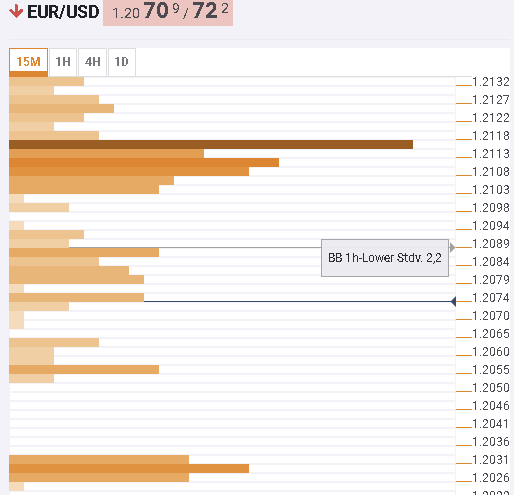
Keep it simple. There is a downward MACD cross on the 2 hour chart image There is little support nearby. image Sell EUR/USD @ 1.2072 ST - 1.2090 TP - 1.2055
EURUSD only
- Laditori replied Mar 27, 2018
this is what has my attention at the moment. 4hour chart of the UsDollar Index. Nice up candle, nearly perfect. I don't want to fight this today..maybe tomorrow. image
EURUSD only

- Laditori replied Mar 21, 2018
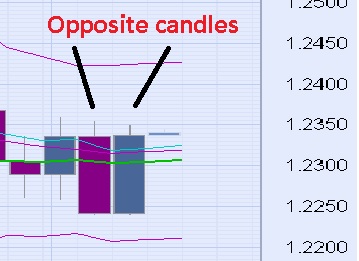
Looking at the daily chart using a 5pm EST close. Tuesday & Wednesday candles are almost exact opposites. That seems unusual. Has anyone ever done a back test on this pattern? image
EURUSD only
- Posts by Member Search: 'Laditori'