- Search Forex Factory
- 8 Results
- Kindke replied Jul 13, 2015
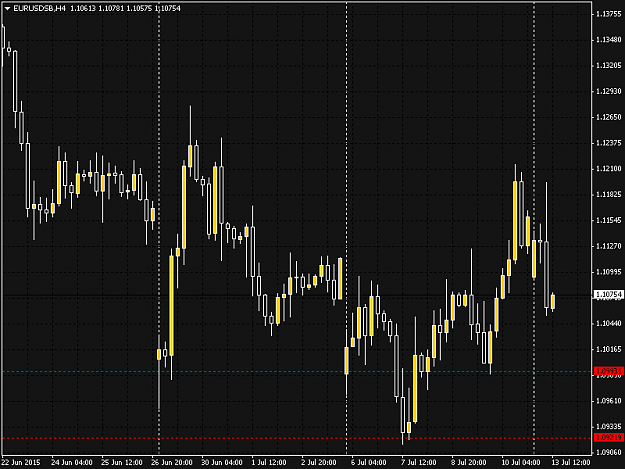
longs at red lines only for me, that 4hr candle was hugely bearish.
EURUSD
- Kindke replied Jul 12, 2015
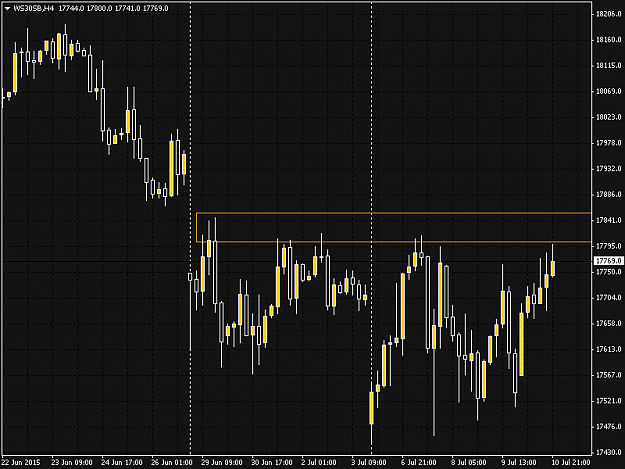
The last leg up into sell zone showed increased pins on the up bars indicating selling pressure as it approaches sell zone. a break above 17869 should see further movement up to next possible sell zones. a short here has a good chance to returning ...
Carpe diem: Intraday tactics for Dax and Dow
- Kindke replied Nov 10, 2011
Zoomed out 1min of dowjones, still tradeable with a bit of confidence.
Price is everything
- Kindke replied Nov 10, 2011
Easy trade this but the zone is bit large (40 pips).
Price is everything
- Kindke replied Nov 4, 2011
Lower supply zone still holding, amazing, I didnt take any shorts from it today sadly as I was far too influenced by my "bias" that the market looks aggressively bullish, I need to learn to stop paying so much attention to the news and what others ...
Price is everything
- Kindke replied Nov 3, 2011
my view on eu, we had 2 strong rally's today compared to only 1 dip and the dip was mainly news driven by the ECB surprise, i think we will break to upside but stall at the second supply level, which is also just above the 50% retrace from the drop ...
Price is everything
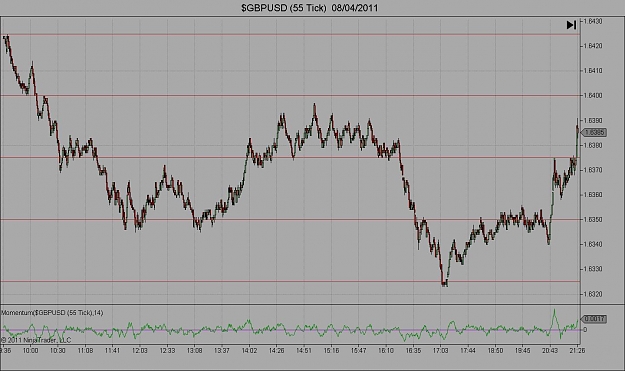
- Kindke replied Apr 9, 2011
Psychology — If anyone is interested or hasnt seen this before, below is a small increment tick chart of Fridays GU from 9:36 GMT to market close. The red horizontal lines are the multiples of 25 in price and it seems these multiples in price ...
Price is everything
- Kindke replied Apr 7, 2011
GBPCHF — PA here looks like consumption of demand since the other bounces from this zone were not at all strong, and last 1hr candle looked pretty bearish. Some help on analysis please
Price is everything

- Posts by Member Search: 'Kindke'